June 21 – The Post Fed Pop
.
I am releasing Thursday mornings report Wednesday Night…
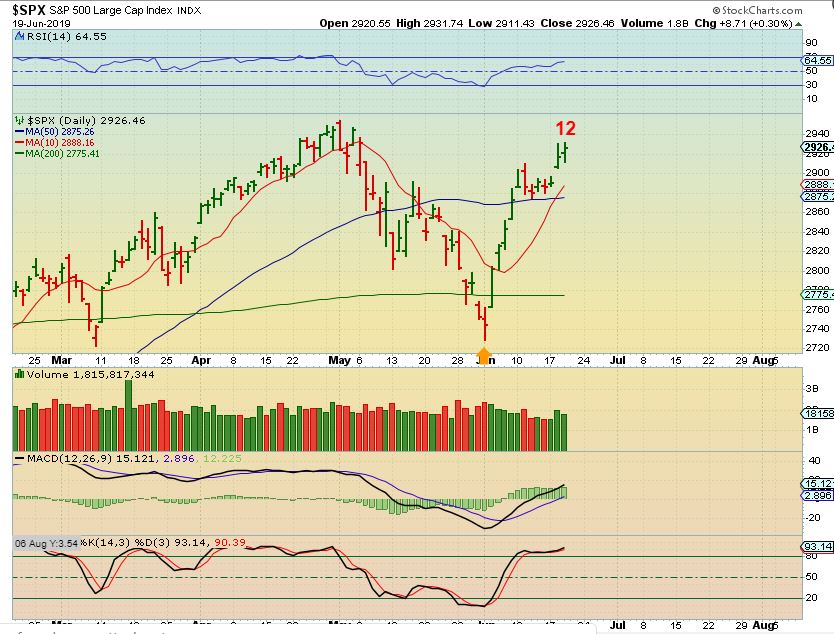
SPX – On day 12, the markets closed higher after the FED MTG. If you went long anywhere near that reversal low, raising a stop to the 50 sma is reasonable.
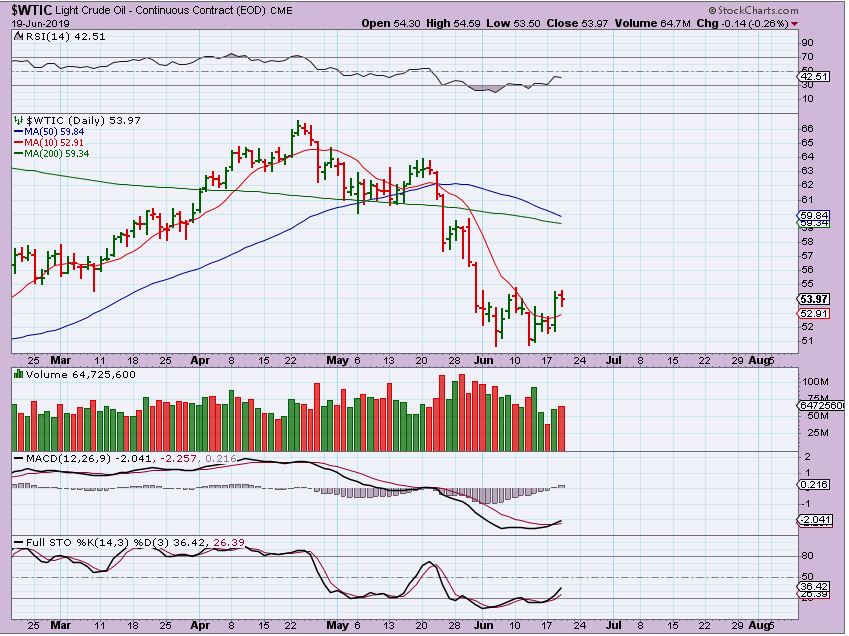
WTIC – Oil broke out above the 10sma and is bullish above that 10sma.
.
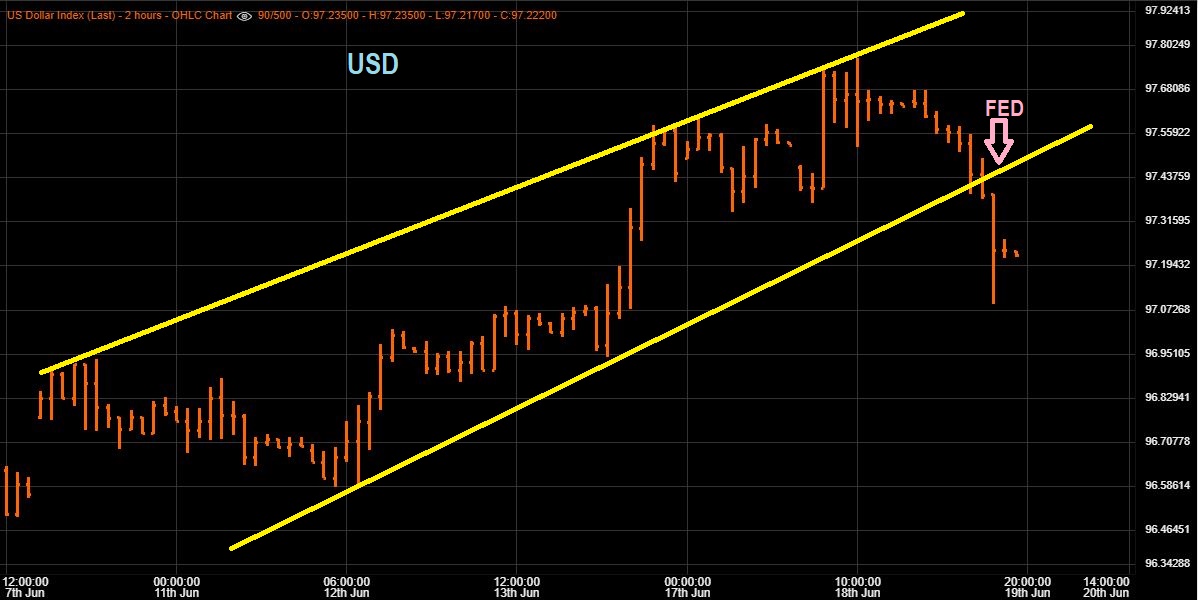
USD 2 HR CHART – I captured this after the FOMC Release & the market closed. The USD dropped sharply.
.
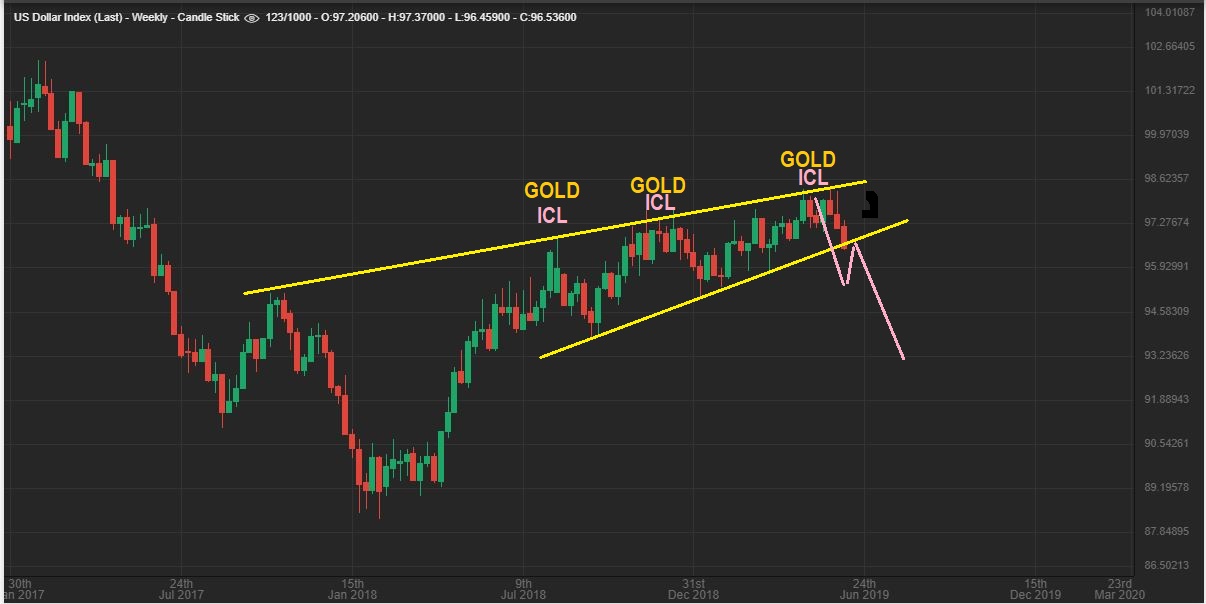
USD WEEKLY – I posted this weeks ago calling for a possible back test and drop by the USD.
.
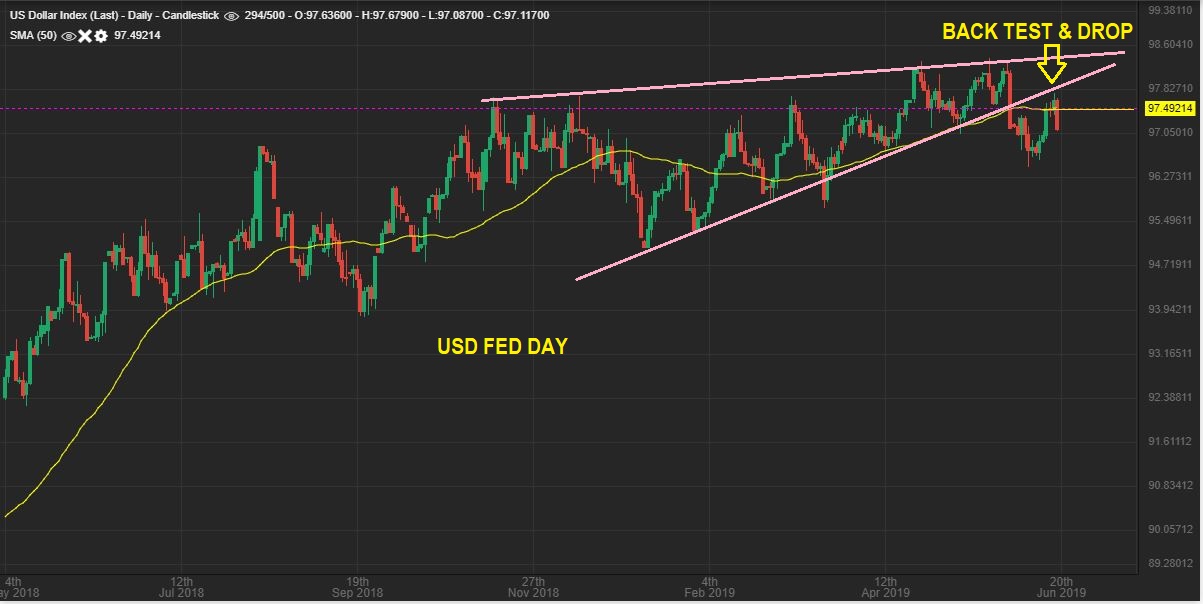
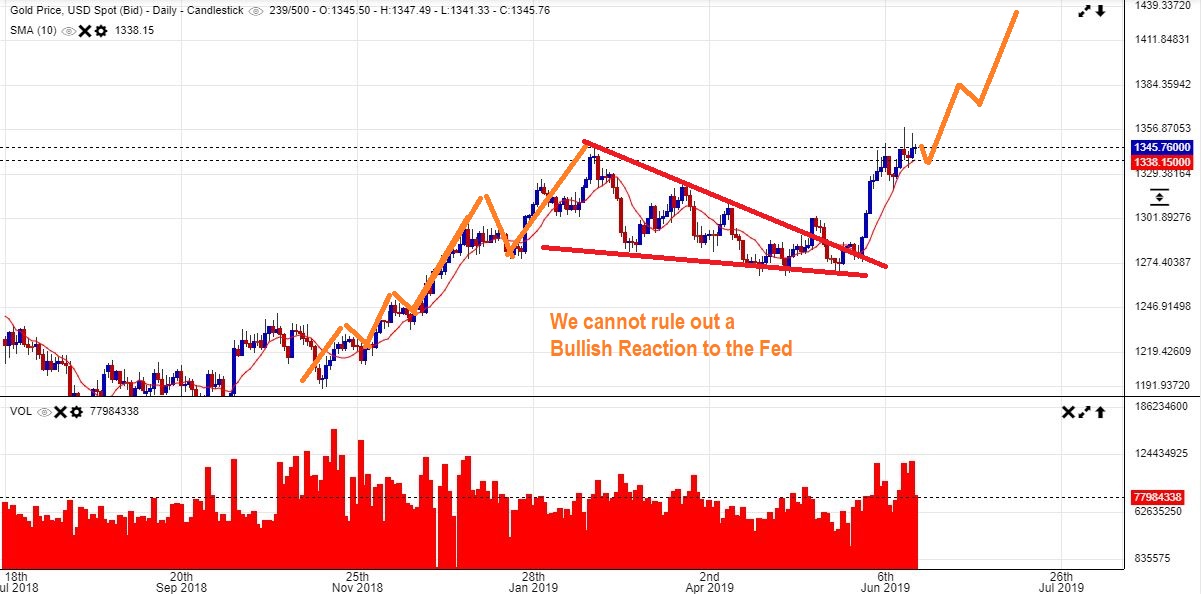
USD DAILY – This could be that back test. This is the daily chart and if this wedge broke down & back tested, it could now enter a bit of a free fall .
.
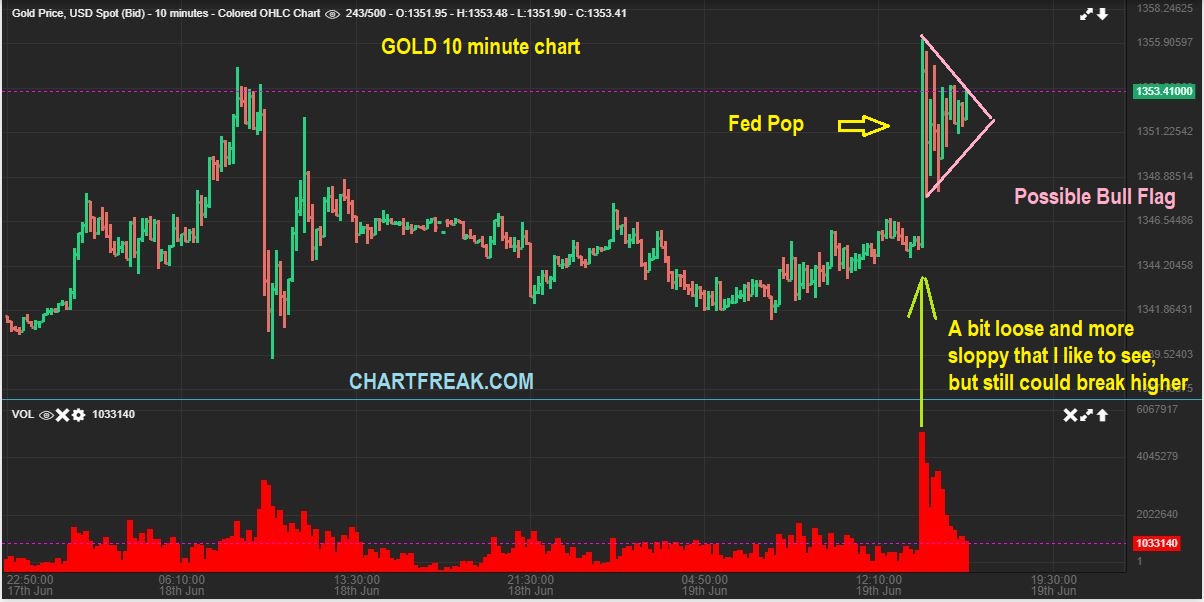
POST FED GOLD #1 – I posted this chart in the live trading chat area below Wednesdays report . It is GOLDs Post Fed Pop as it started to BULL FLAG. I also Tweeted it out.
.
POST FED GOLD#2– Gold then broke out, and this could get Bullish after that long base formed…
.
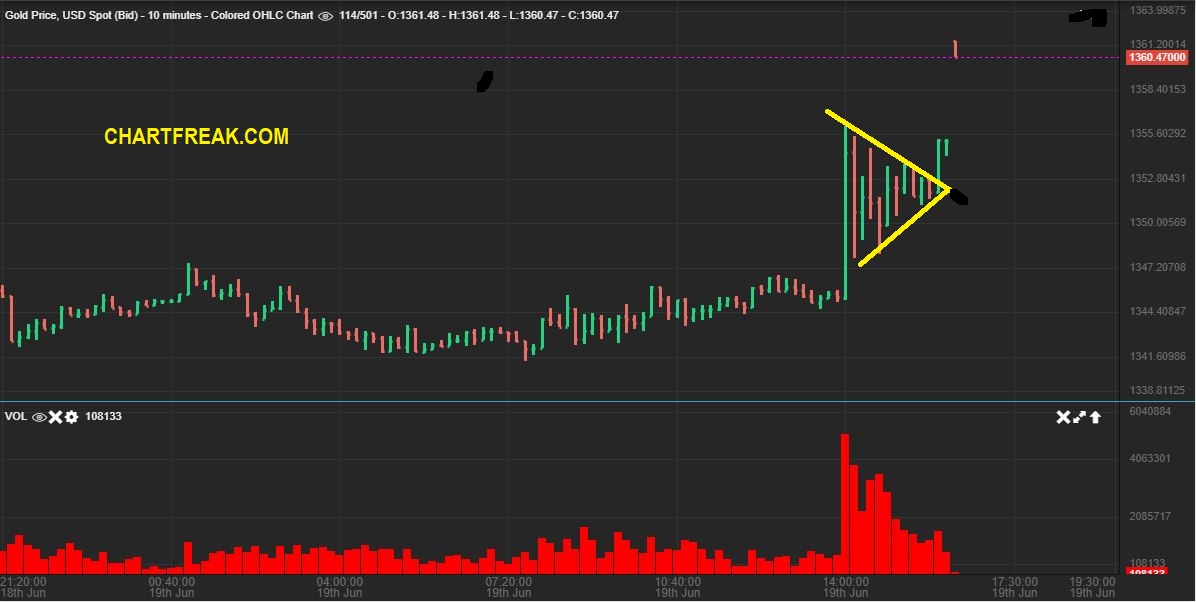
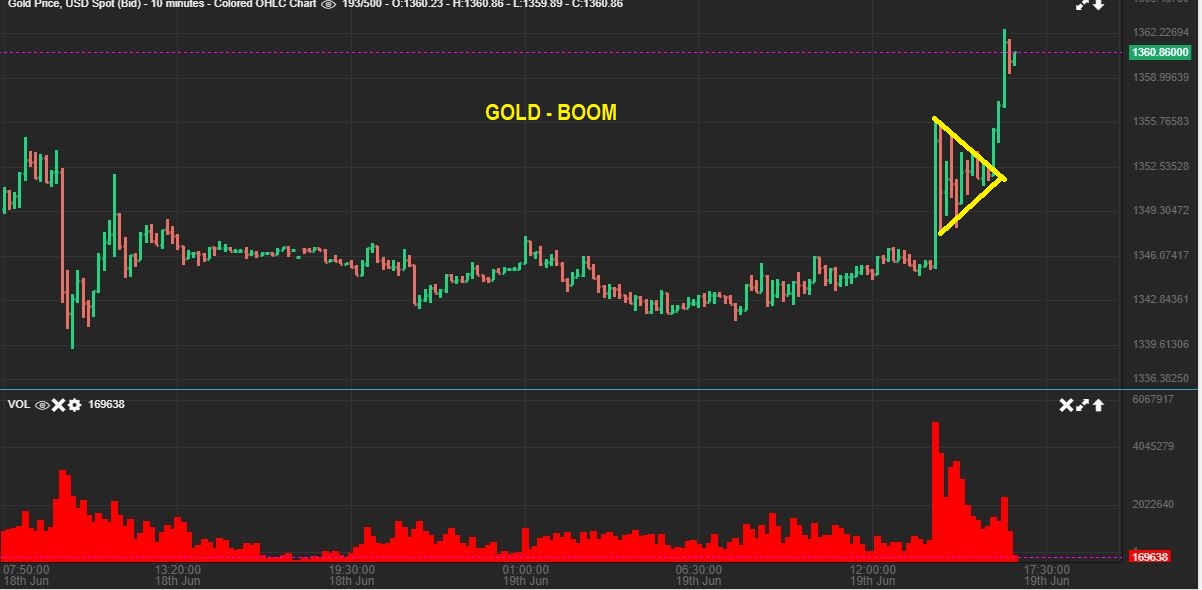
POST FED GOLD #3 – The Bull Flag broke out & rallied. This was 2 hrs after the US Markets closed.
.
I also Tweeted this out & put it in a public report. Gold can really run when the Bulls start piling in.
.
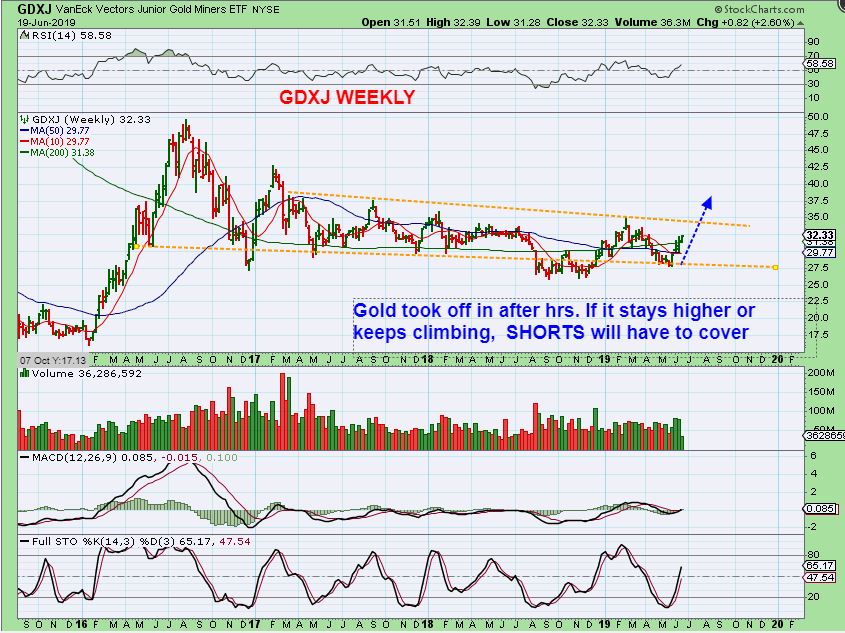
MY THINKING AT THIS POINT is that if GOLDS hold up overnight, many who may have shorted Miners will be forced to cover. A short covering rally could take place Thursday & Friday.
.
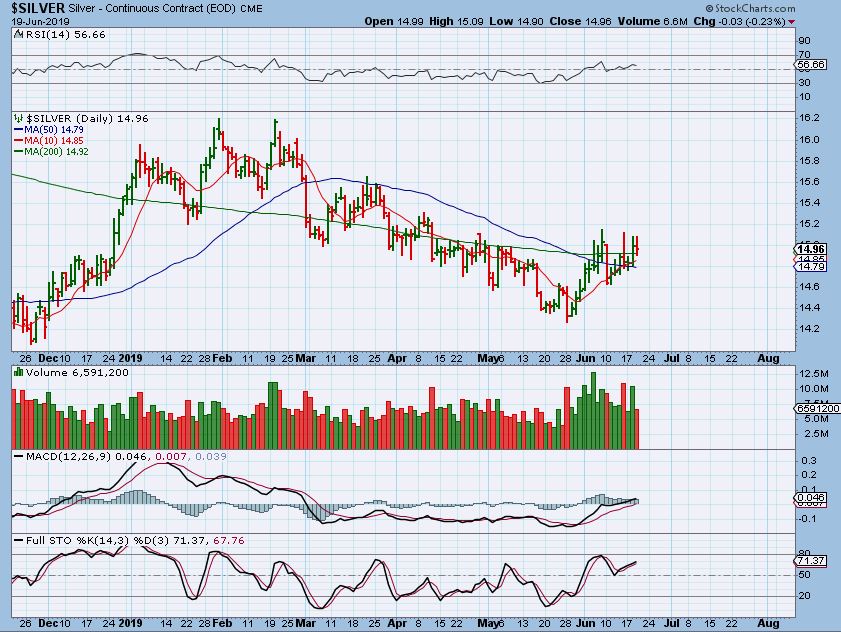
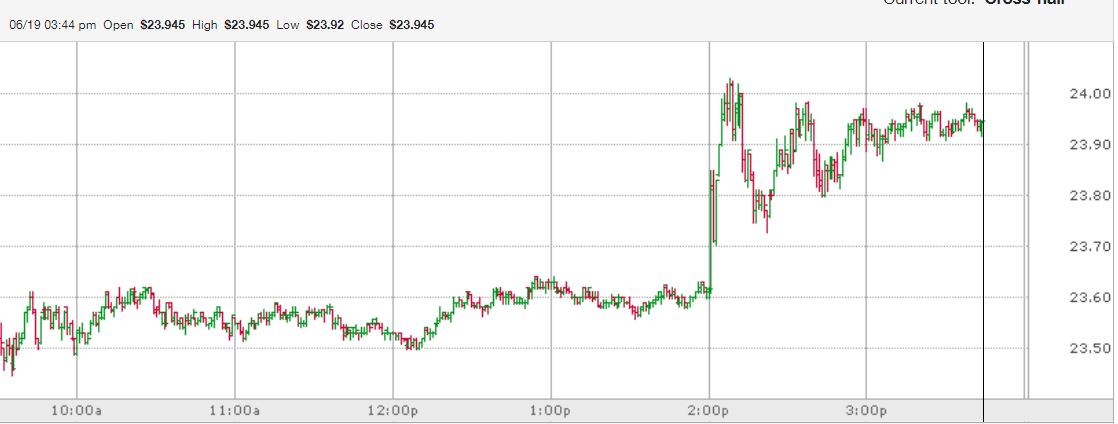
SILVER -Obviously Silver is lagging, but I think that it will play catch up quickly, and I’ve mentioned that Silver Miners should be a good investment going forward.
.
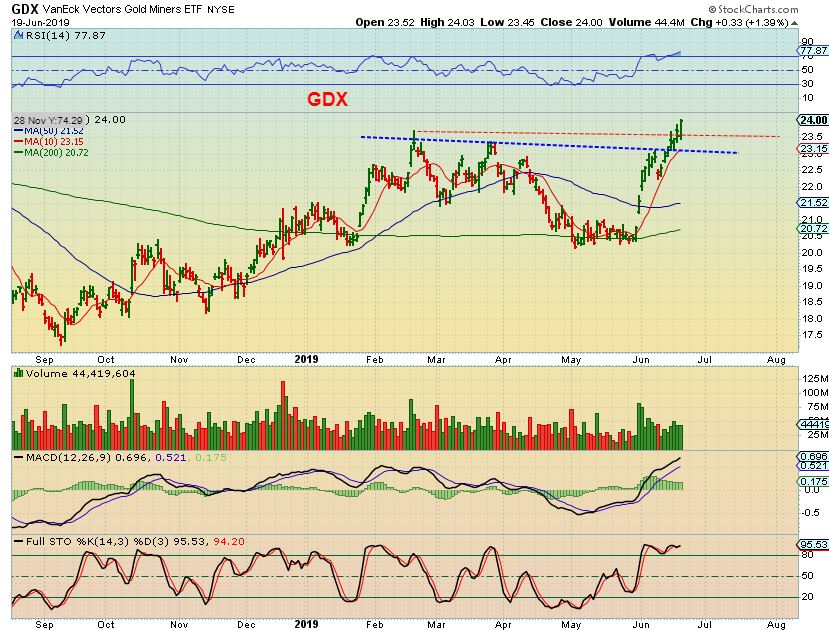
GDX – GDX saw a POP after the Decision,a nd then Bull flagged also.
GDX – This was close to how GDX closed. It didn’t get to enjoy Golds Break out & run from that Bull Flag, but it may do a run of its own Thursday morning.
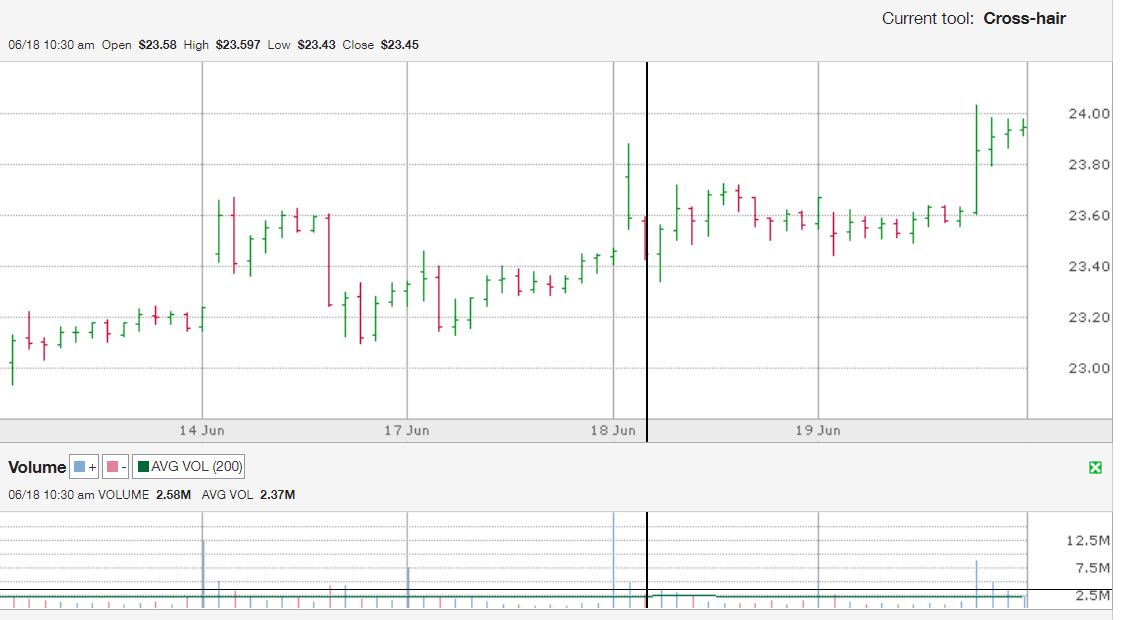
GDX – GDX broke higher and it is starting to look like ‘Shorts’ are caught on the wrong side of this trade. Some may have added to their shorts at this resistance level, so now they will be forced to cover and push this higher. GDX & GDXJ may run Thursday with Golds Pop & Short cover.
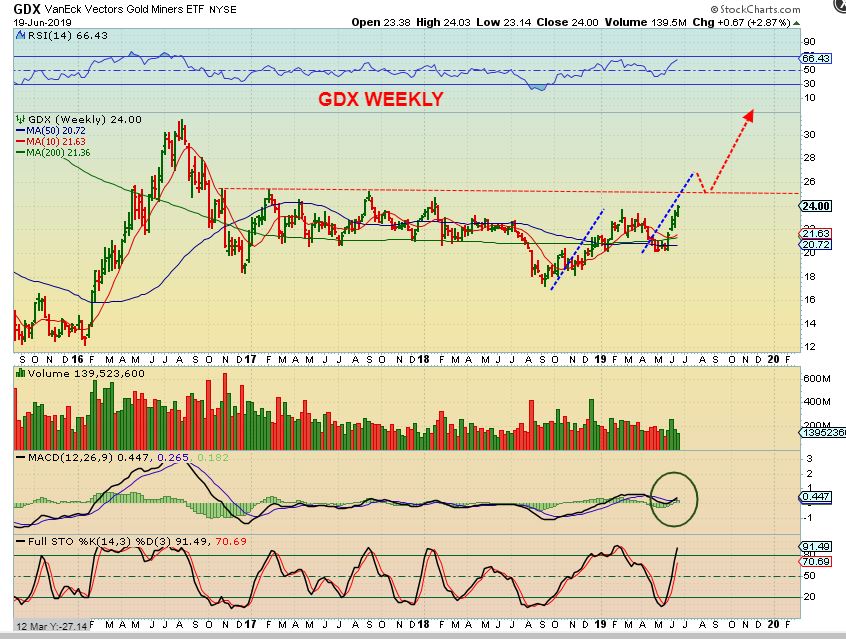
GDX WEEKLY – So we go back to the weekly and all I can say is : THIS IS EXACTLY WHAT I HAVE BEEN TALKING ABOUT FOR WEEKS & MONTHS 🙂 And it looks to be just starting a multi-month run.
.
GDXJ WEEKLY – GDXJ is a bit slower out of the gate as Big Money likely scoops up the major Miners.
.
Let’s Discuss Miners: If you have been here at Chartfreak, by now you are invested for sure, but what if you are not as invested as you want to be? That usually calls for Buy the Dips and maybe even Catch some laggers at this point. Let me explain…
.
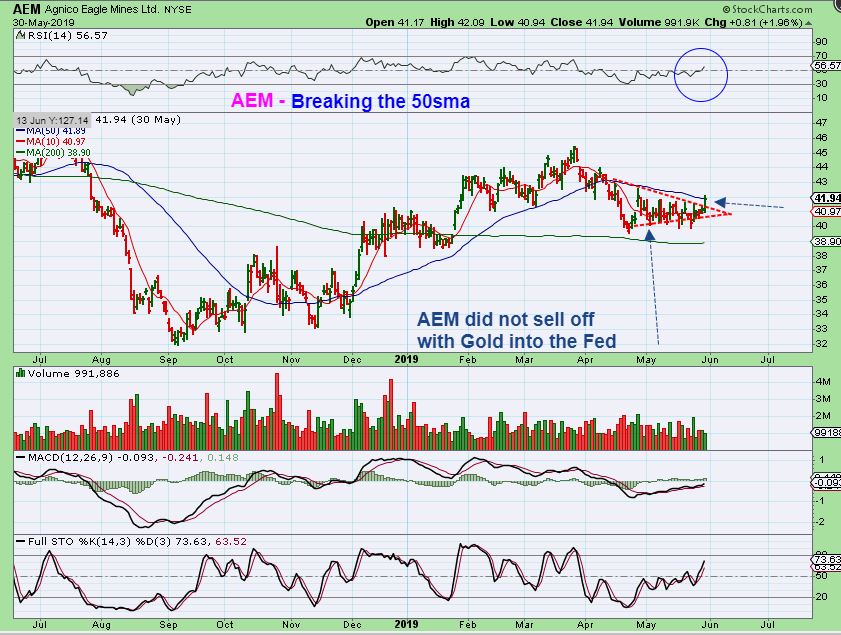
AEM – After the FED MINUTES was released at the end of May, AEM popped breaking a triangle & 50sma as a buy. This was a Buy of a very good stock that ran well ( $32 to $46).
.
AEM – I had also posted the Big Picture at the end of May, to show an inverse H&S, it Showed the potential of a run to $60 , and show how it found support at the weekly 200ma.
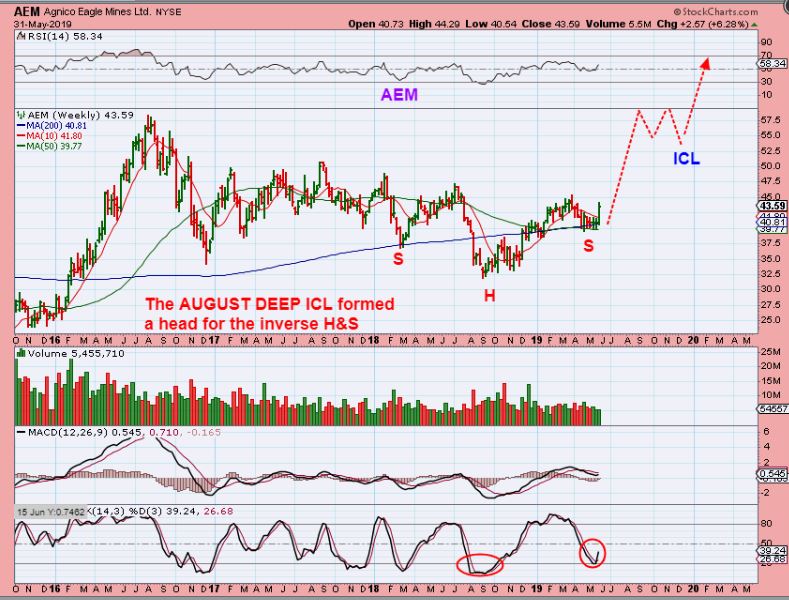
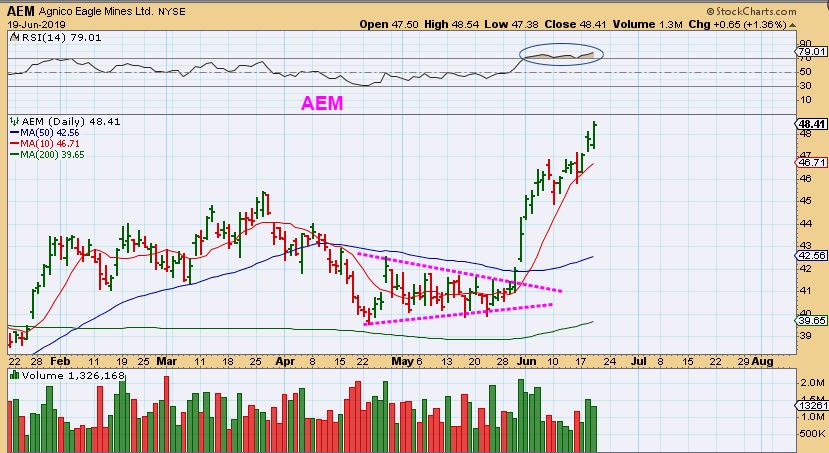
AEM – You can see that when some of these break out, they are NOT letting people buy the dips easily. This looks like it wants to run right to that $60, so this is why you may have to settle for a lagger / Junior if you didn’t already by a Major .
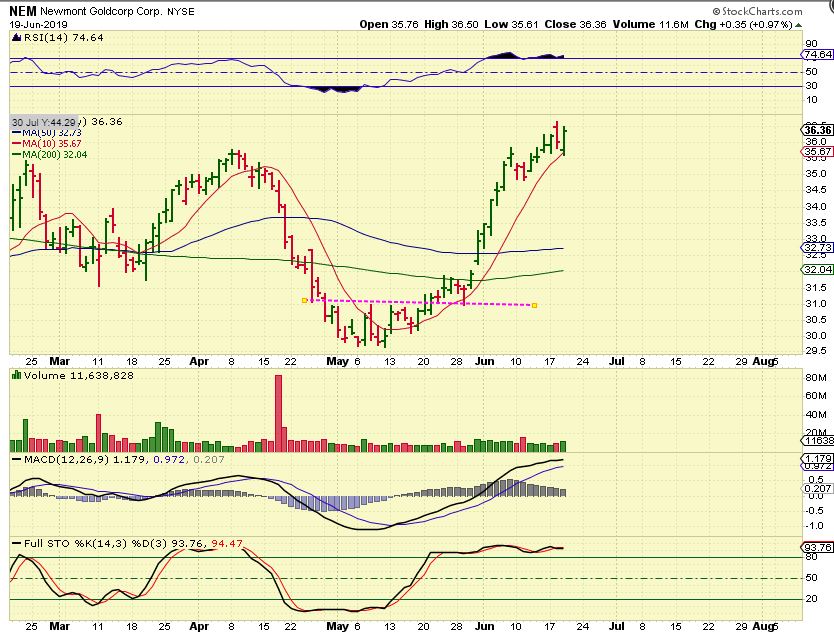
NEM MAY 17 – I posted this as a BUY for NEM. It Popped higher when Gold sold off heading into the Fed Minutes.
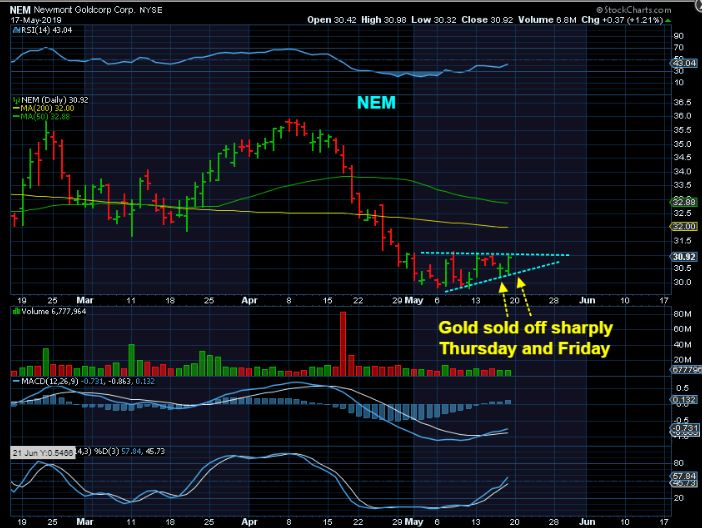
NEM – It took off and if you didnt buy that Base, it has been hard to buy the dips. As mentioned weeks ago, in 2016, Many of these only dipped to the 10sma, not letting people load up. If you dont own this, you may need to find a less extended one, or buy a dip if we see one.
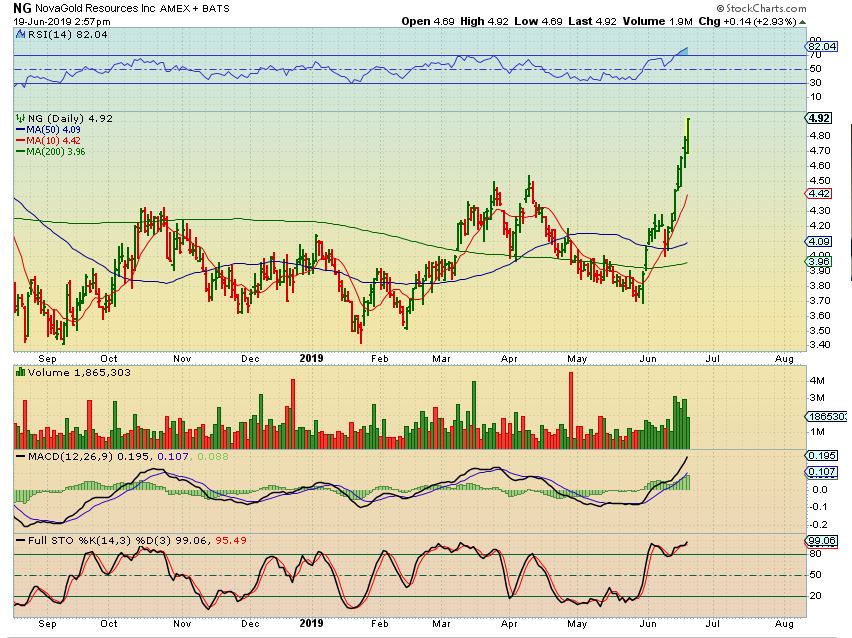
NG – Some of the Juniors have also just been ripping higher, not allowing buyers in. See NG and DRD.
.
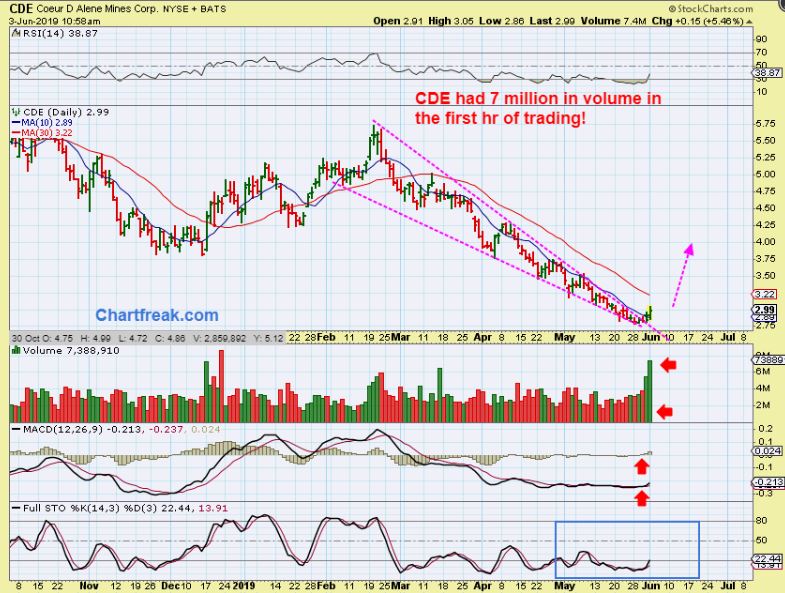
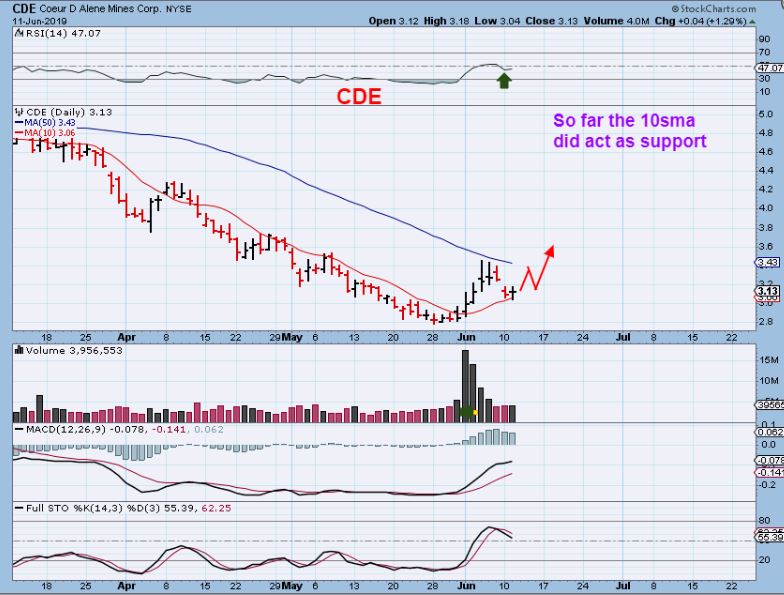
CDE – The Silver stocks could start playing catch up quickly, so if you didn’t buy CDE down here…
JUNE 10– I then pointed out what to look for. It tagged the 50sma, it may flag at the 10sma
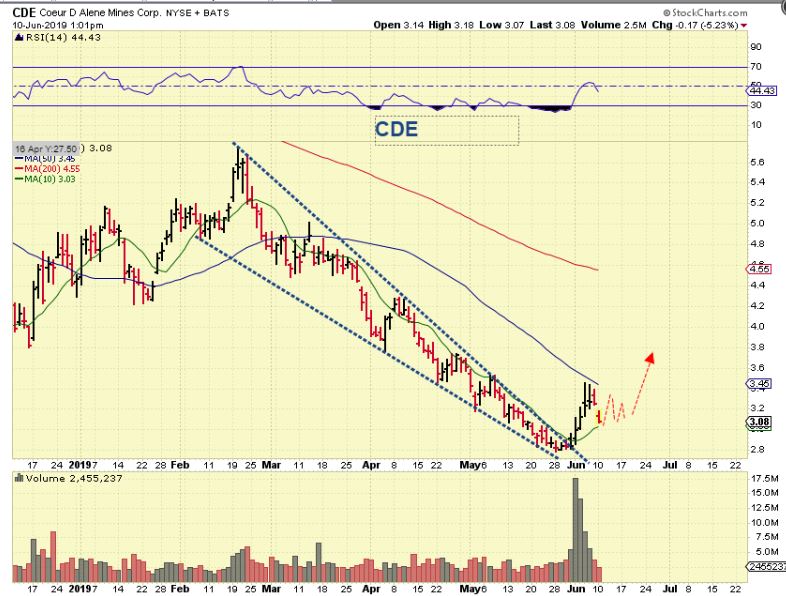
Again, June 11, it may flag at the 10sma
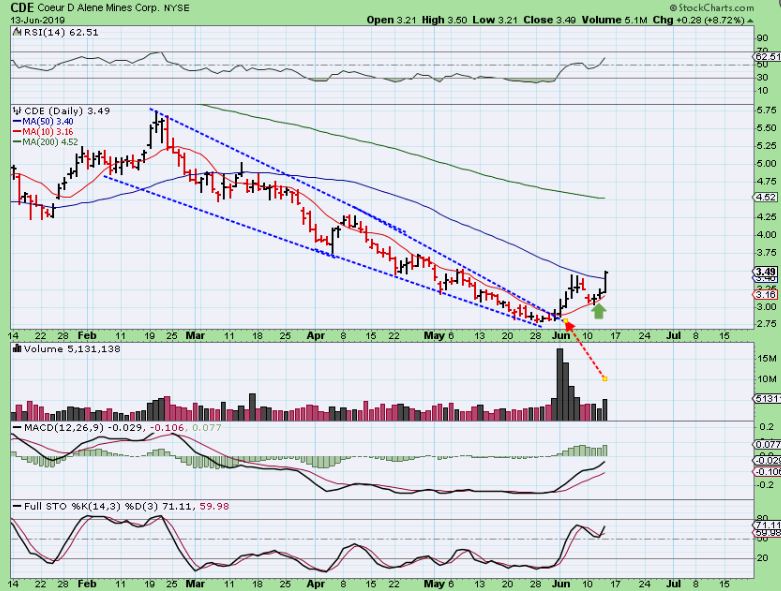
June 13, BREAKING ABOVE THE 50SMA, BUY IT
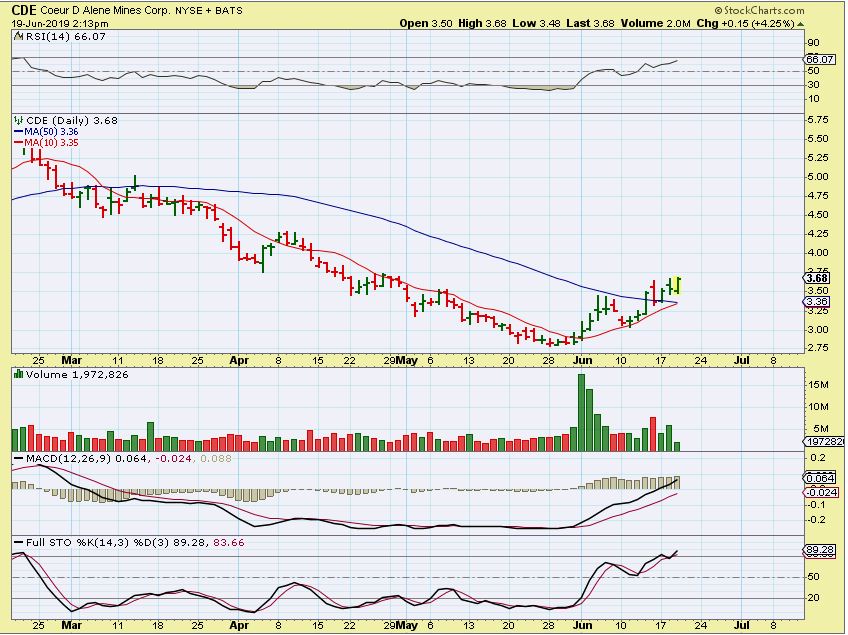
And NOW, June 19th – This may be the last good chance just above the 50sma now.
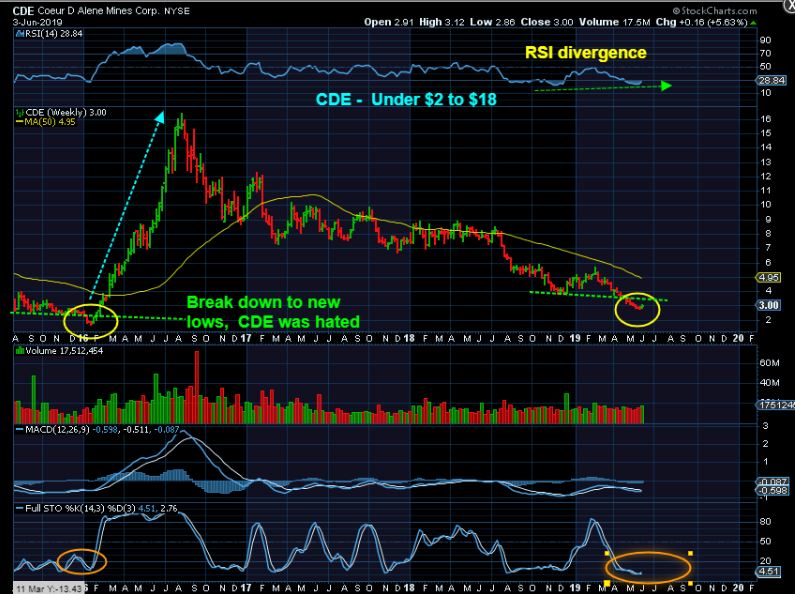
CDE WEEKLY from June 3 – This may be a real winner by the end of this recovery run.
.
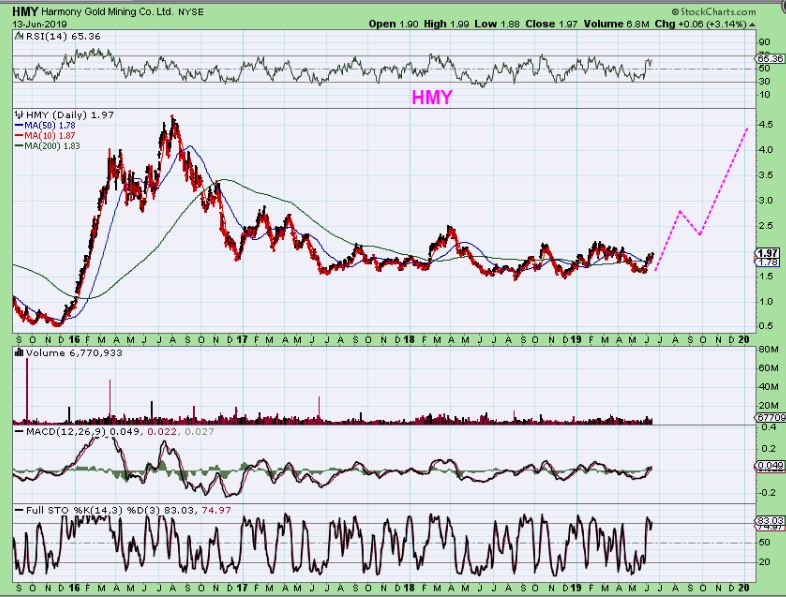
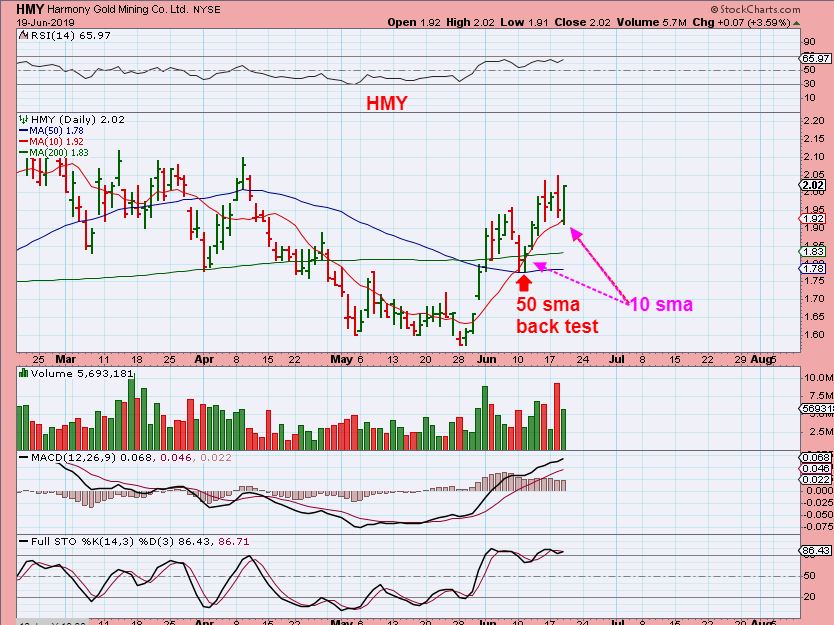
HMY – I discussed the potential of HMY on June 13th too.
HMY – It has been slowly rising up the 10sma, and already did a back test of the 50sma & remains above the 50 & 200sma….
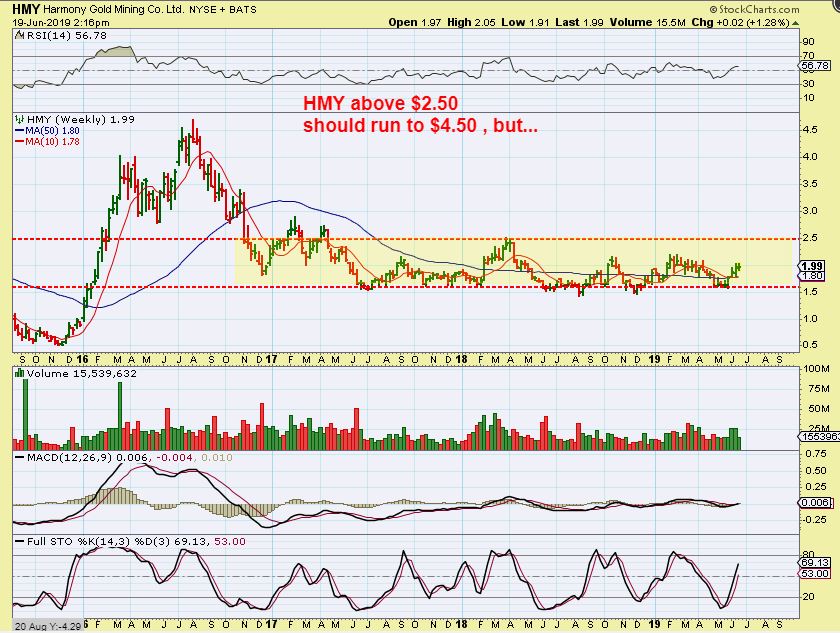
HMY WEEKLY – If it gets above $2.50, you may not get another chance to enter it…
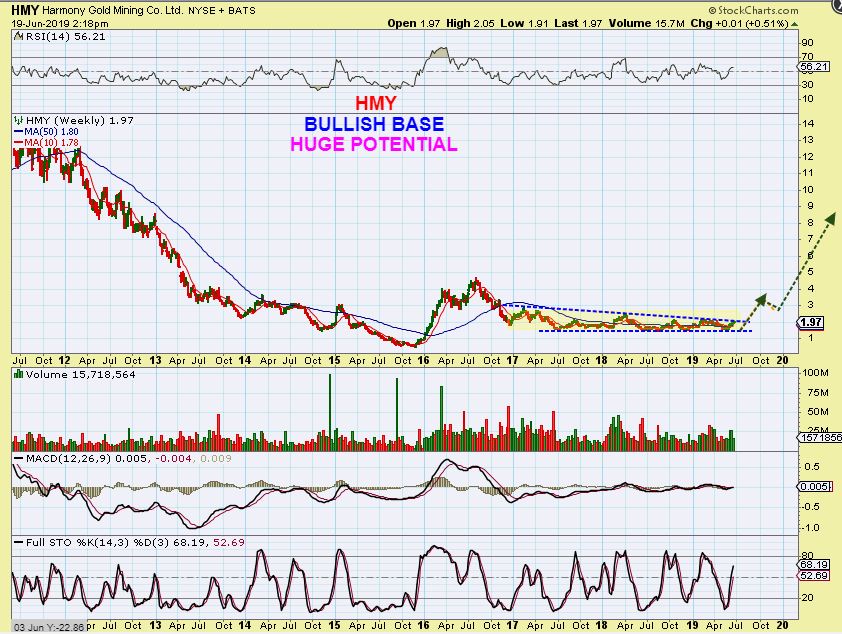
HMY BIG PIC – And the Real Big Picture is even better. HMY was a $14 stock when Gold was at $1700/oz.
So if you are still looking for low risk entries, you want to look at Miners that may be showing some signs of strength, but not over extended. Some have paused or pulled back slightly to the 50sma, others went sideways and flagged. So far that is all we have had as an entry point. I am going to continue to look for some all along as time goes forward.
AUY June 3 – This was a low risk buy breaking from a wedge…
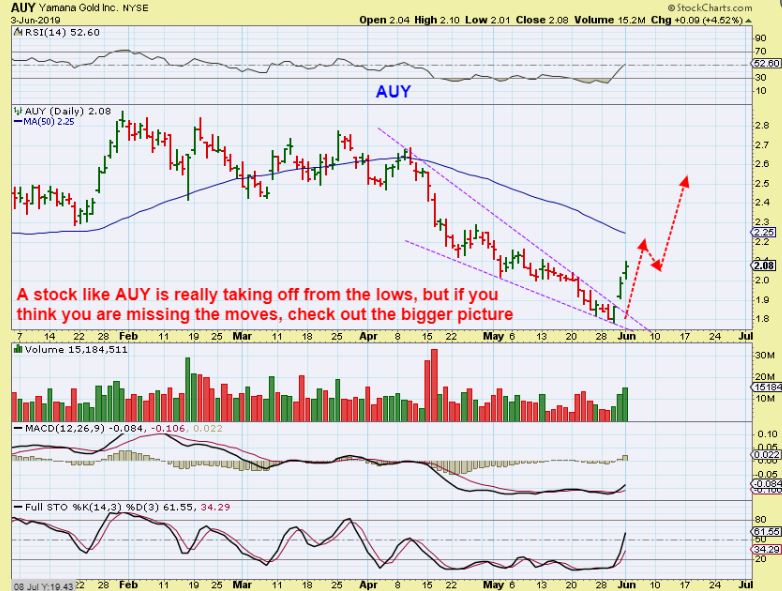
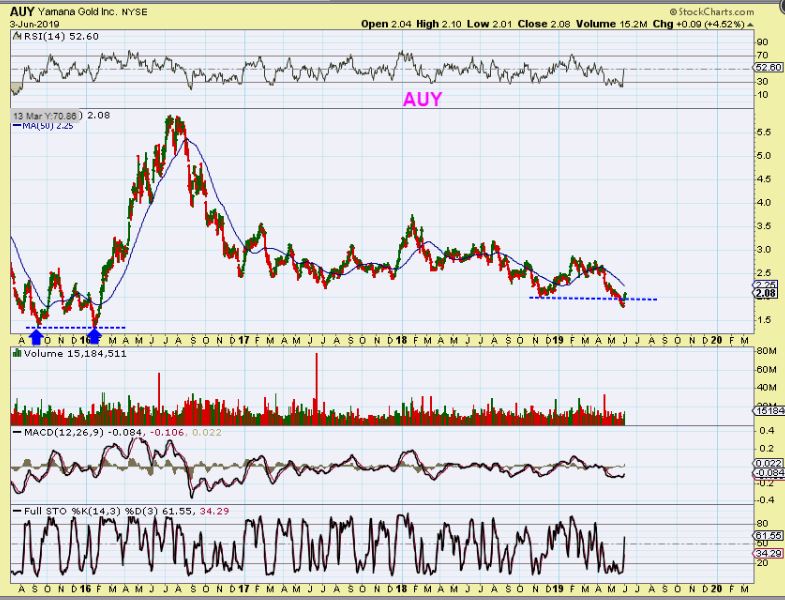
AUY June 3 – On that day I showed the big Picture recovery of a shake out…
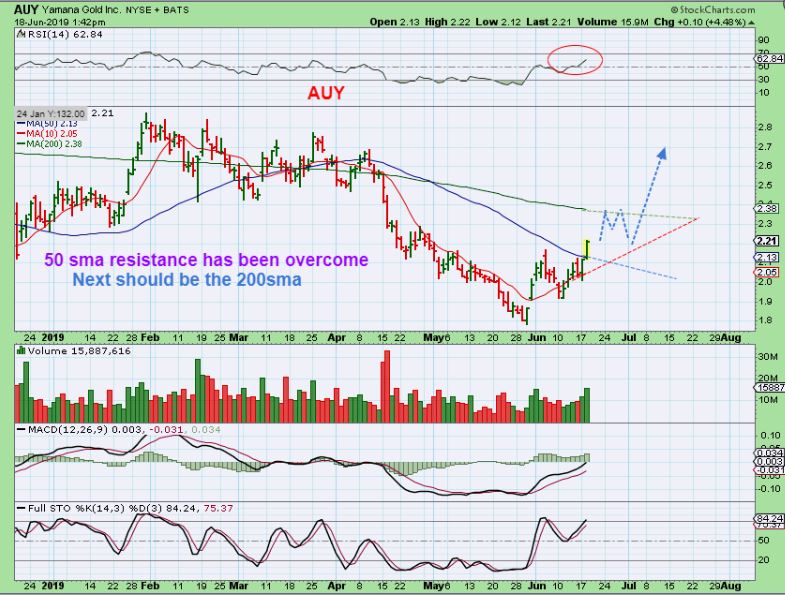
AUY June 18 – This was a Buy for AUY that I posted this week. It is still just getting going, and …
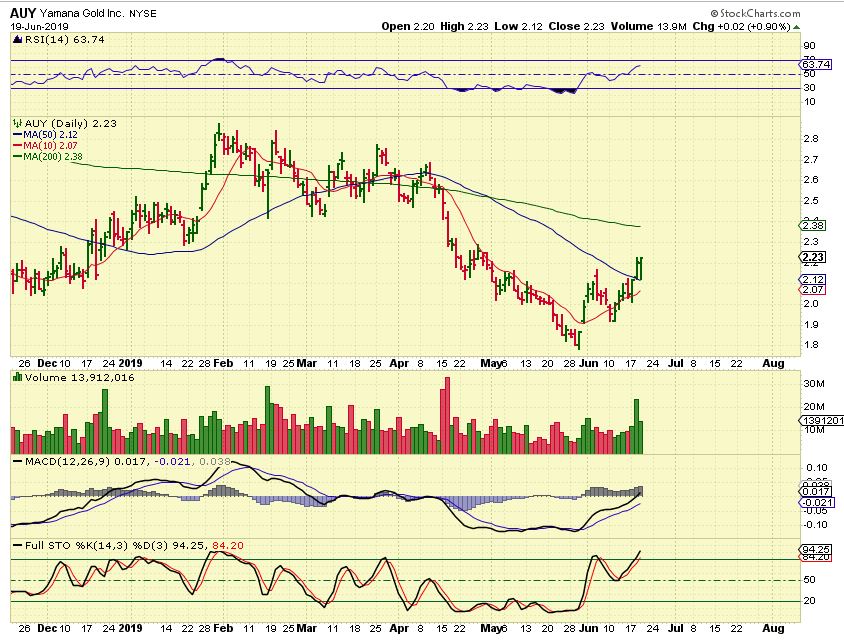
AUY June 19 – On the FED DAY AUY dropped & bounce off of the 50sma and is again moving higher. This still isn’t as extended as others.
.
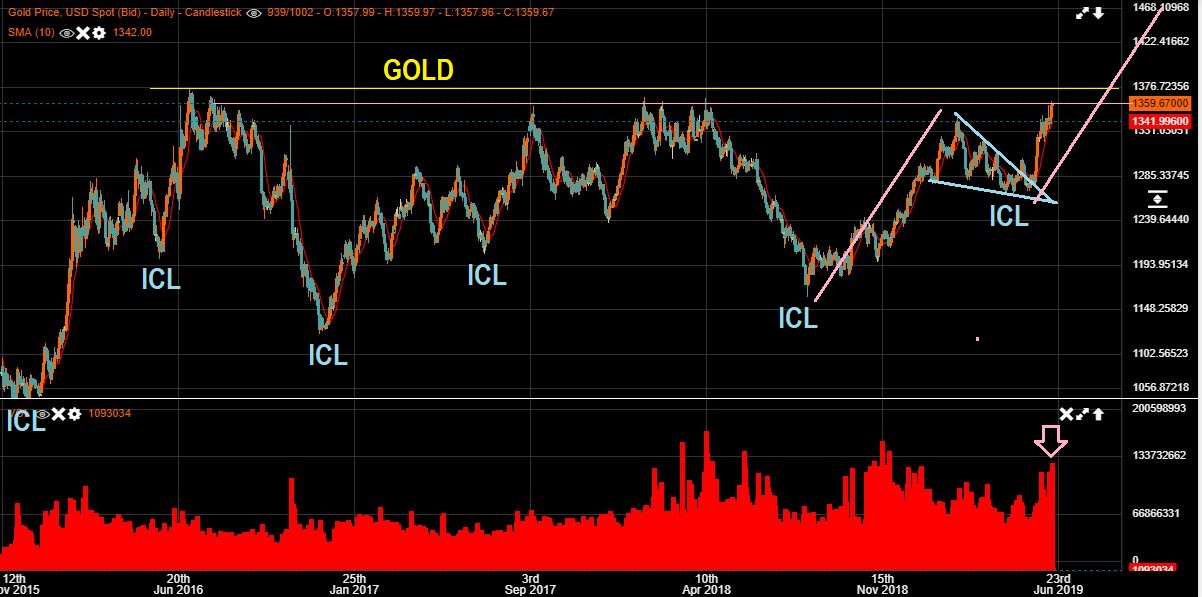
So another Fed Meeting has come and gone, but this one seemed to add to the Bullish outlook of the Precious metals. We now see a strong likelihood of a Rate Cut in July and Gold broke higher after the US markets closed. As I write, Gold is $1356, as shown here, and this looks very bullish. We’ll see if it holds up overnight and gives us a nice short cover rally into the end of the week. Whether that happens or not, this set up looks like a break out & run will take place sooner than later. This MAY ICL is in the earlier stages, I want to keep the Bigger picture in mind.
.
Enjoy your Thursday trading!
.
~ALEX
,
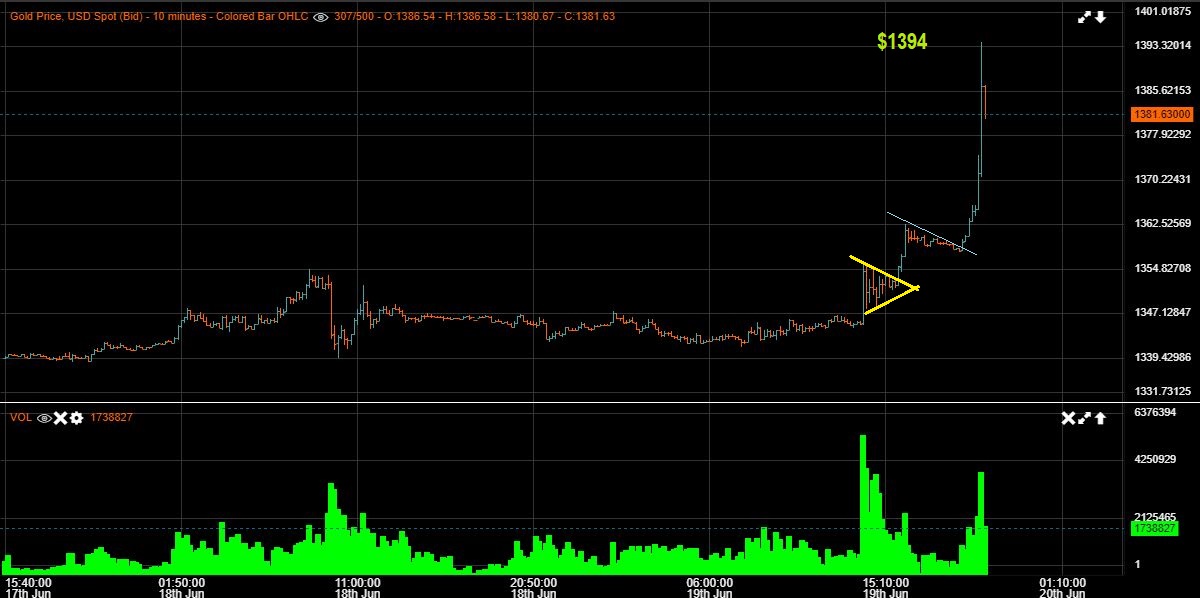
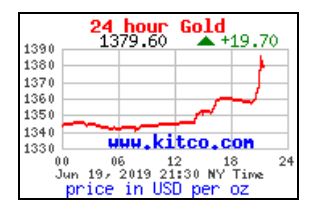
At 9 P.M. – Gold has exploded higher as I finished this report, but unfortunately it looks parabolic and could drop back by the morning. Take a look…
.
THIS WAS THE BULL FLAG AS MARKETS CLOSED…
.
THIS WAS THE EXPLOSION FROM THAT FLAG! A 2nd flag formed and then it shot up to just under $1400. This might drop back over time to back test, but I would think that this warning shot would cause the ‘shorts’ in the Miners to still try to quickly cover.
.
.
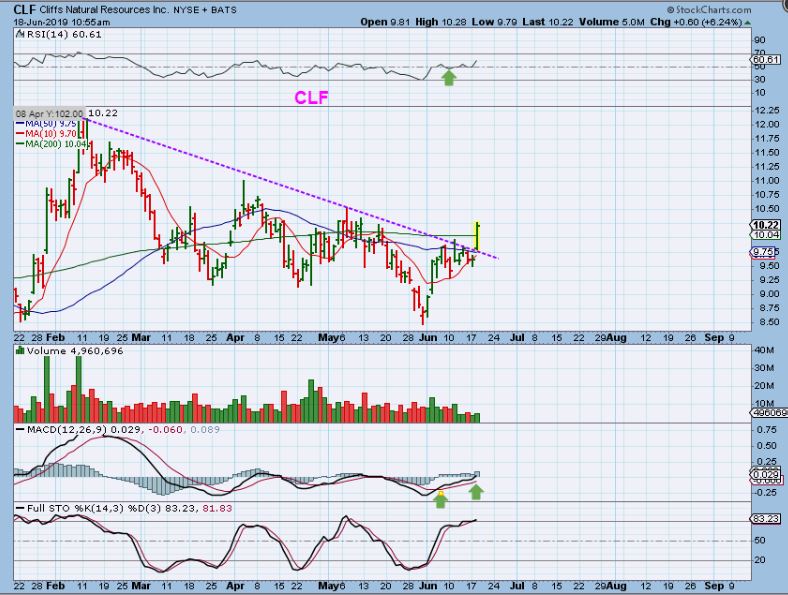
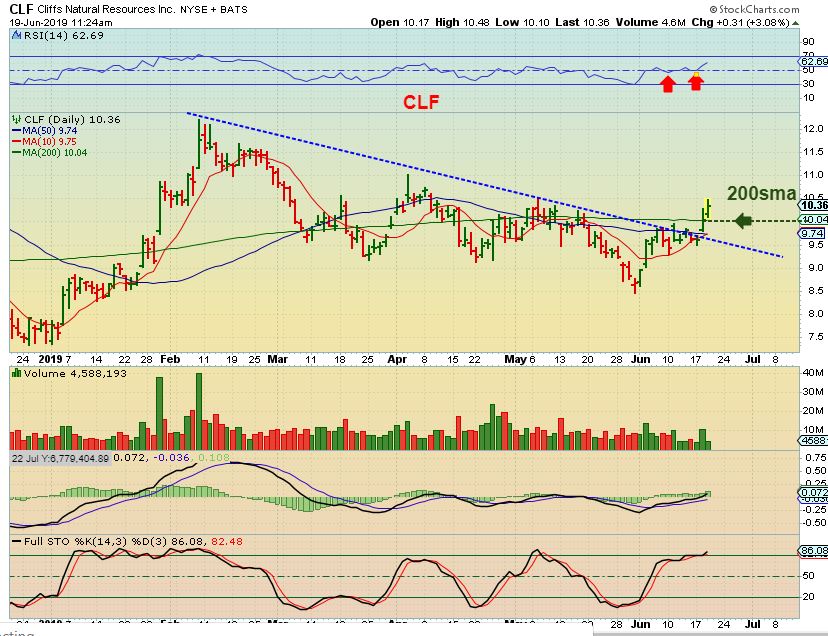
CLF – I pointed out that Steel & Metals stocks also seem to be reacting favorably at this time. This showed that CLF broke above the 50 & 200sma…
.
CLF – There was follow through Wednesday and the weekly charts look good too. This can be bought in this area too. HBM stalled at the 50sma, X closed just above its 50. Others look good too…
.
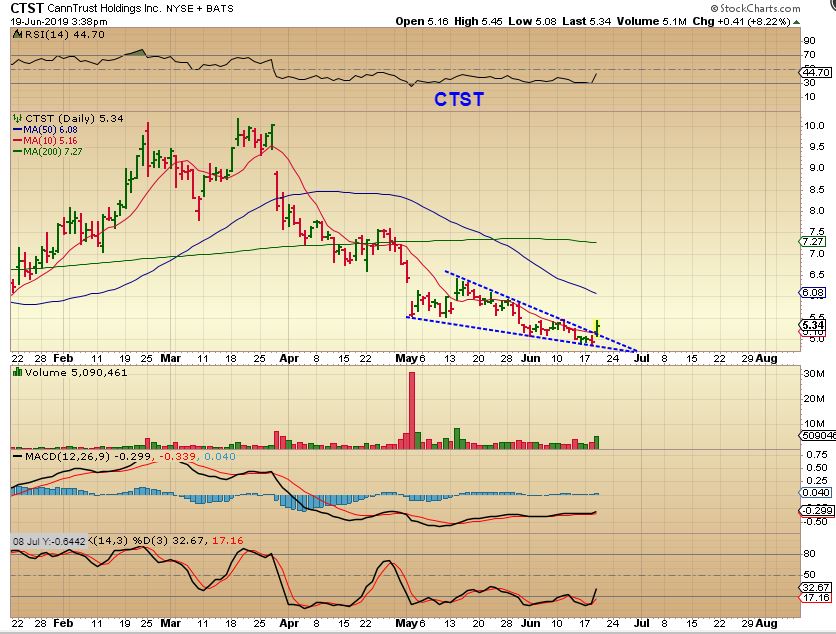
CTST – I also think that MJ Stocks might start moving higher. I am seeing a few acting correctly. CTST broke out Wednesday.
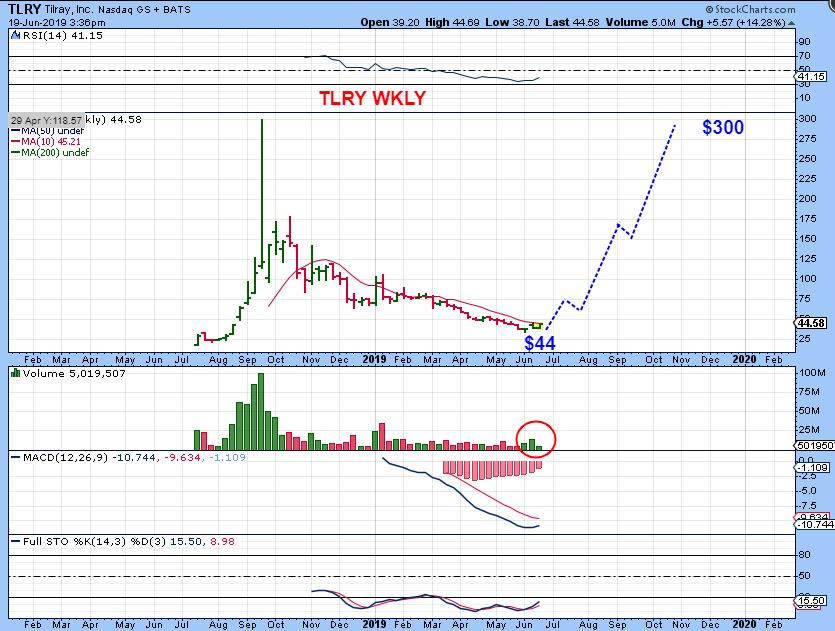
TLRY – I posted this June 17th, and…
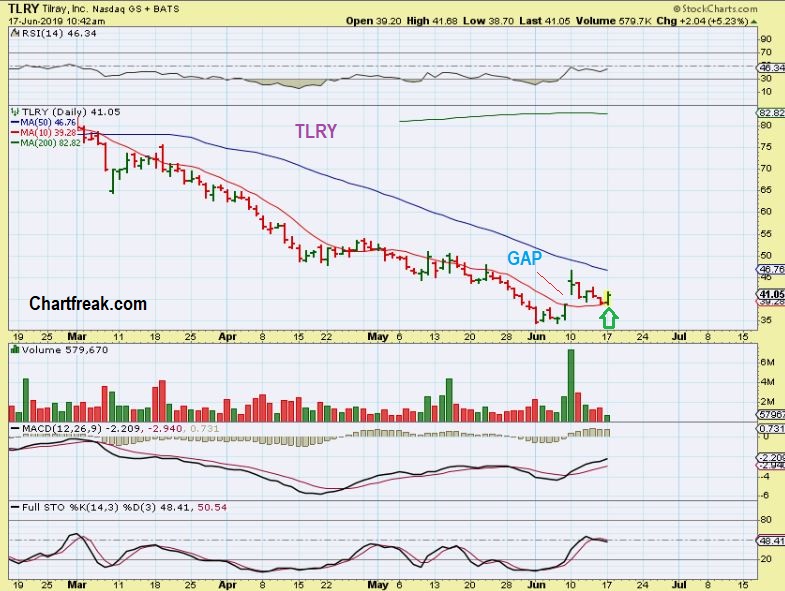
TLRY – Follow through is looking good.
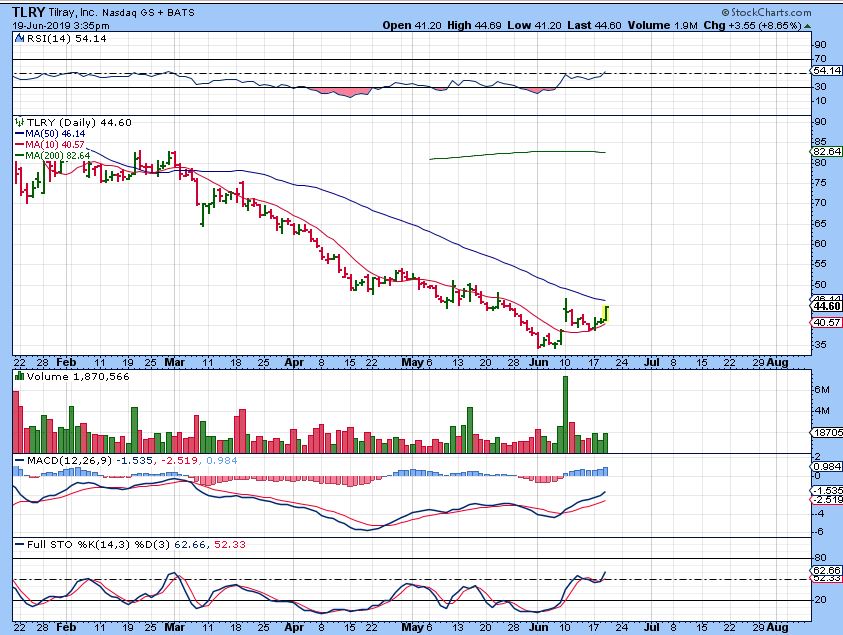
TLRY – It was $300 in the parabolic run of 2018.
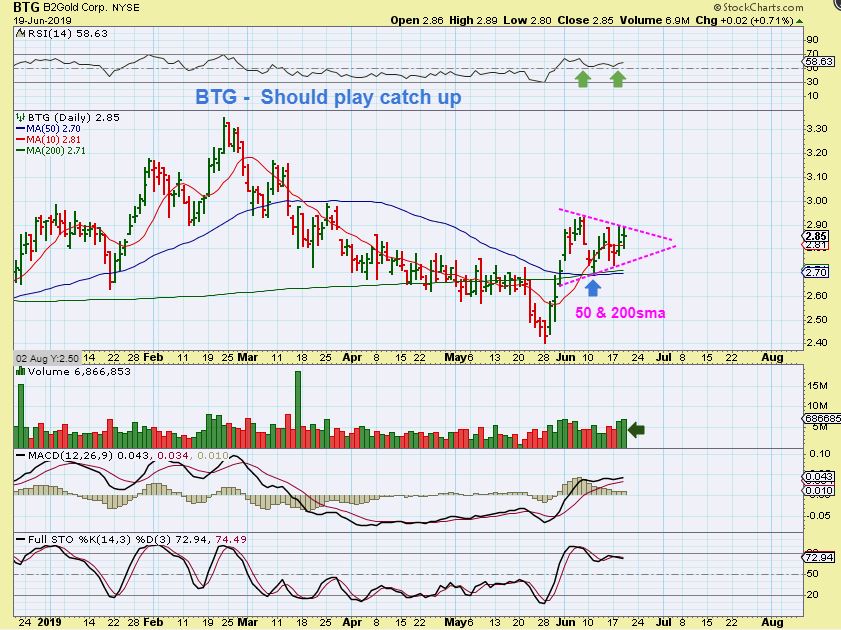
BTG- I DON’T KNOW WHY IT IS A LAGGER , BUT IT HAS A GOOD SET UP