
June 13th – To The Upside
JUST A REMINDER: THURSDAY & FRIDAY ARE WORK AWAY FROM HOME DAYS FOR ME, SO I WILL BE AWAY FROM THE LIVE TRADING AREA FOR MOST OF THOSE DAYS.
.
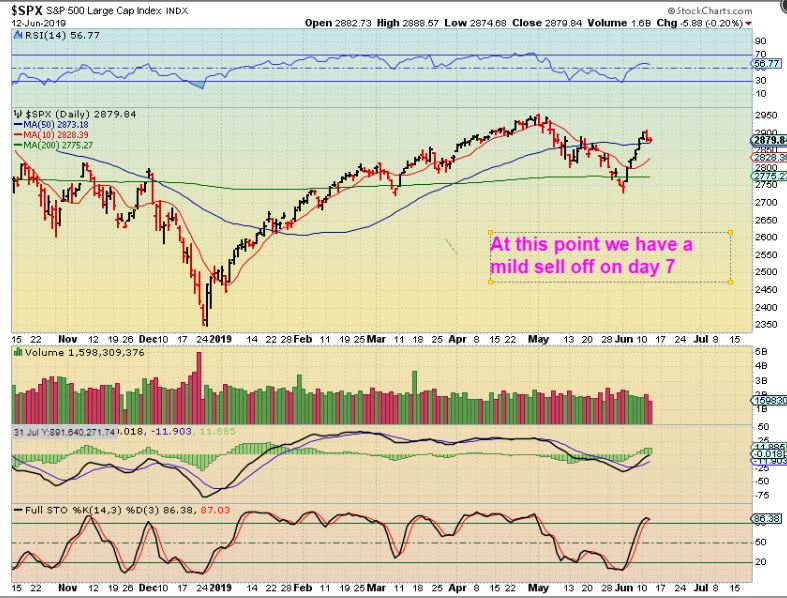
SPX – The General Markets are pulling back, but it is pretty mild so far. It is also early in the daily cycle, with Wednesday being day 7 out of the recent lows.
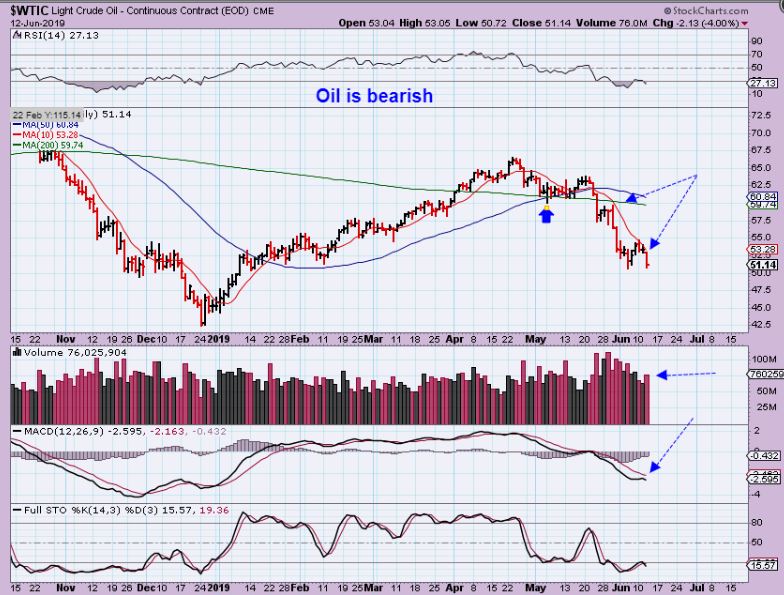
WTIC – Oil on the other hand, is not pretty and was rejected again at that 10sma. This can just continue to sell off and…
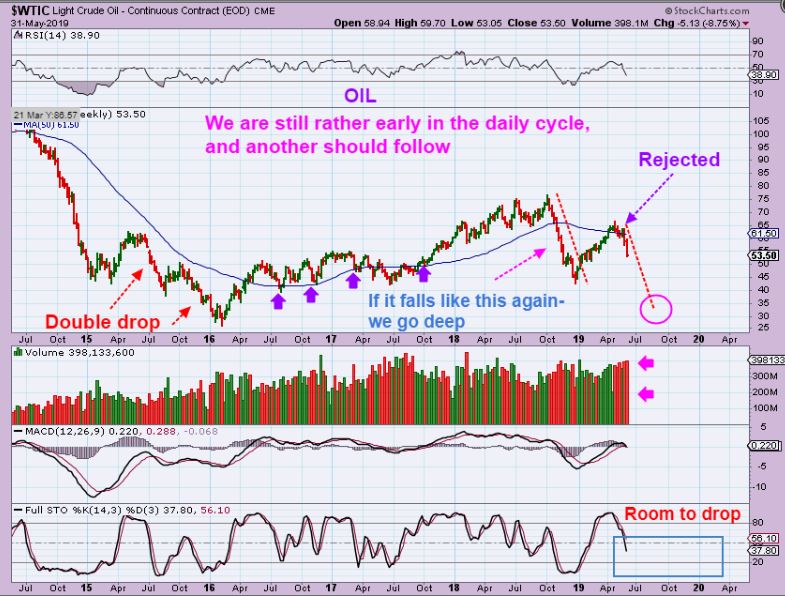
WTIC AT THE END OF MAY – It is starting to look as though this ‘2nd leg down’ could play out, similar to what we saw in 2015.
.
After discussing one of my recent observations in the live area this morning, I’ve decided to discuss the subject here too ( Many work all day and do not have time to read all of the comments in that area).
.
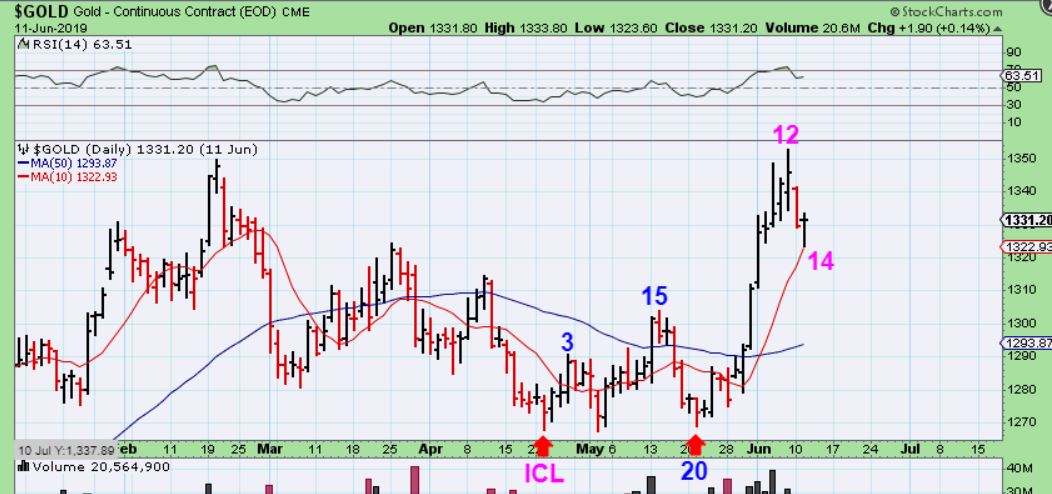
GOLD #1 – SO using cycles, Golds low was 29 days ago. Take a look at where day 14 is, and well go forward with this conversation…
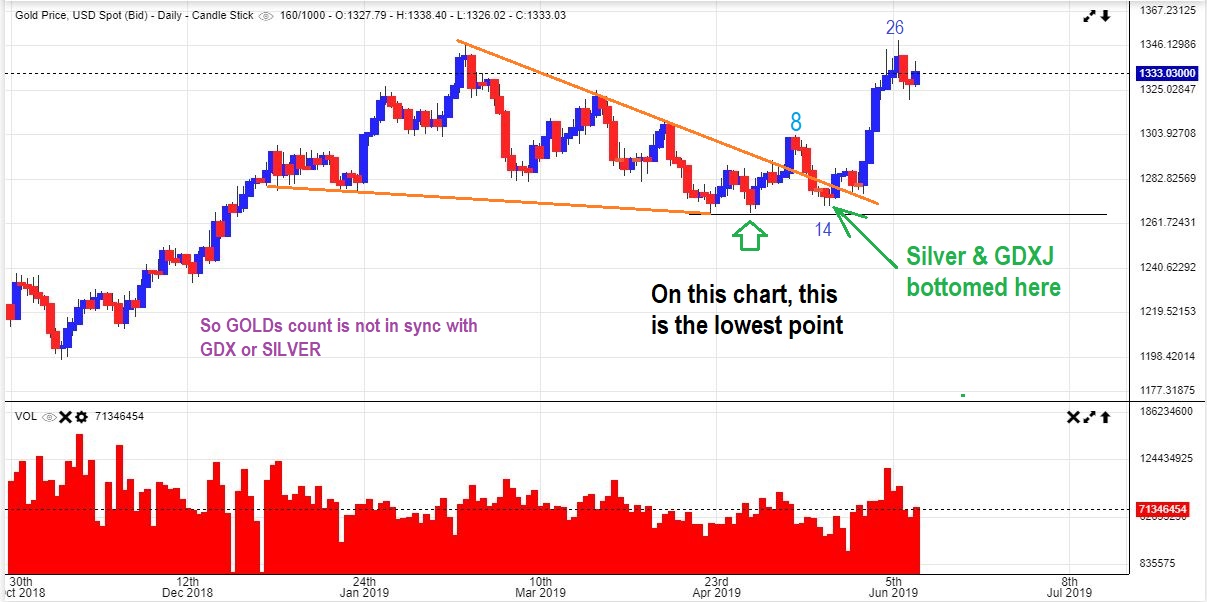
GOLD #2 – Over the weekend, I actually entertained ( but dropped ) the idea that we MIGHT Have had a short first daily cycle , like this with Day 20 as the next DCL. I didn’t like that idea, but why did I entertain that idea to begin with? DUE TO SILVER & GDXJ.
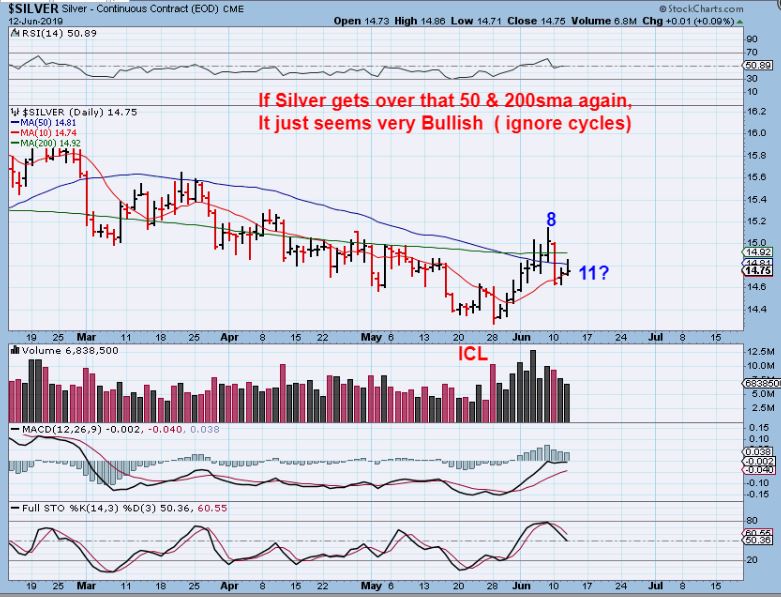
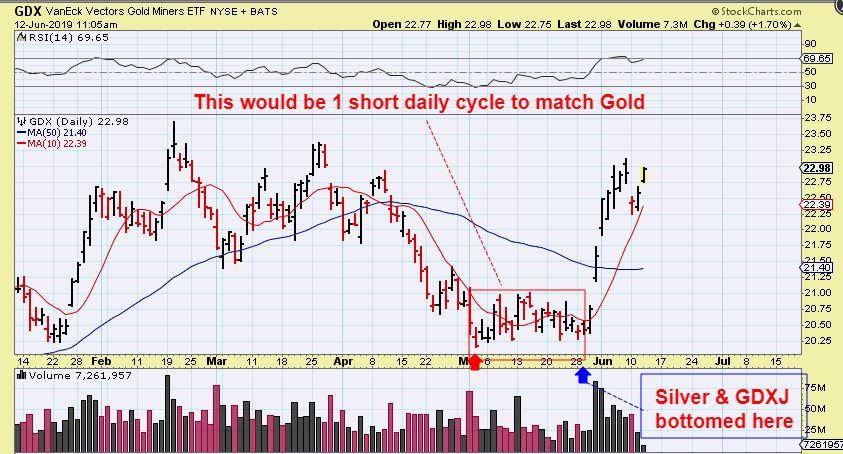
SILVER – Because SILVER did NOT bottom with Gold in early May, IT BOTTOMED ON MAY 28. THIS MEANS THAT SILVER IS ON DAY 11? So this doesn’t match Gold. Now let’s look at GDXJ.
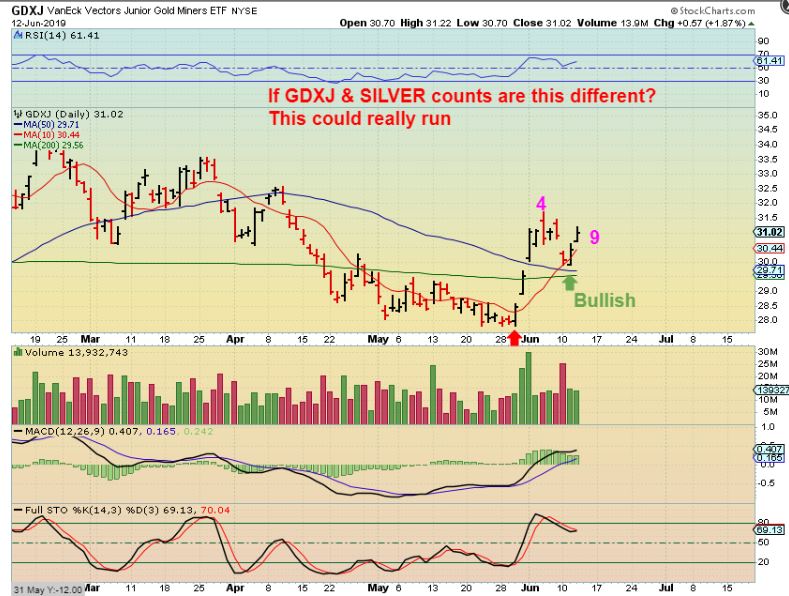
GDXJ – Now looking at GDXJ we see that IT also bottomed near the end of May like Silver. GDXJ does NOT look ready for a drop to a dcl. So if GDXJ doesn’t even match GDX or GOLD, how can I count Juniors using cycles? This would be only day 9 for GDXJ and it bullishly bounced off of the 50 & 200sma area. So to keep it simple in the reports, I have simply used GOLDS COUNT and stated things like ‘Ignore cycle counts, and don’t sell everything if it gets late in a daily cycle- dips could be mild.” I also showed how in 2016, Miners barely dipped in the DCL- they went sideways to break that 10sma.
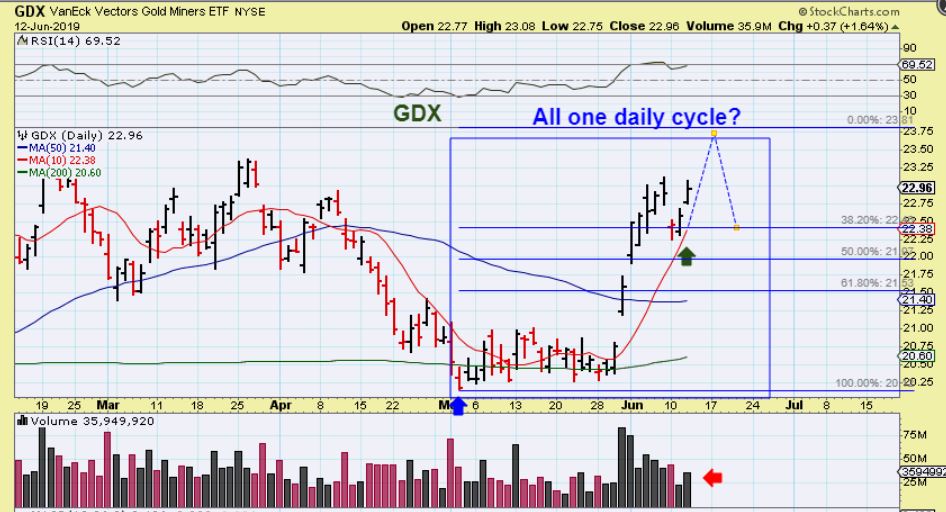
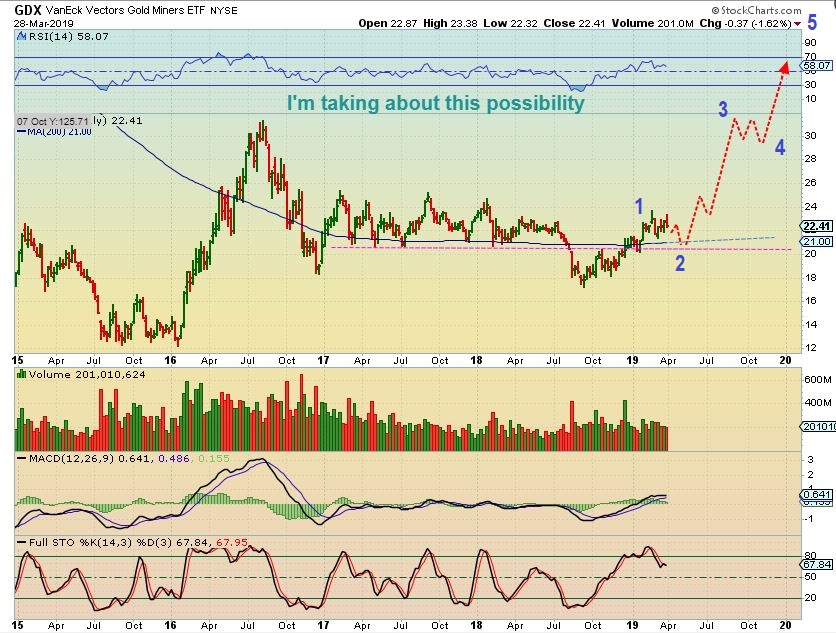
GDX – On June 10th, This is what I was picturing could take place using Gold & GDX cycle counts, but at this point, GDX bounced higher on Wednesday too. If day 20 for GOLD was a dcl, GDX could continue higher. Let’s take a look at GDX now …
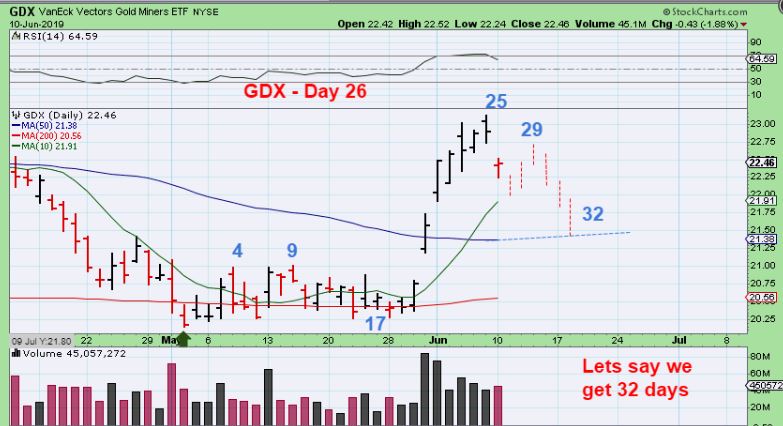
GDX – So we have been counting this as day 28 of one daily cycle ( AND IT MAY BE). I did have another thought about this however…
GDX – So I raised the question in my head this weekend… “Is is possible that in order for GOLD & GDX to align with GDXJ & SILVER, they put in a short daily cycle ( &dcl) when Silver & GDXJ bottomed at the end of May?” HMMM. If so, GDX & GDXJ are now only on day 10 or so. How could that be?…
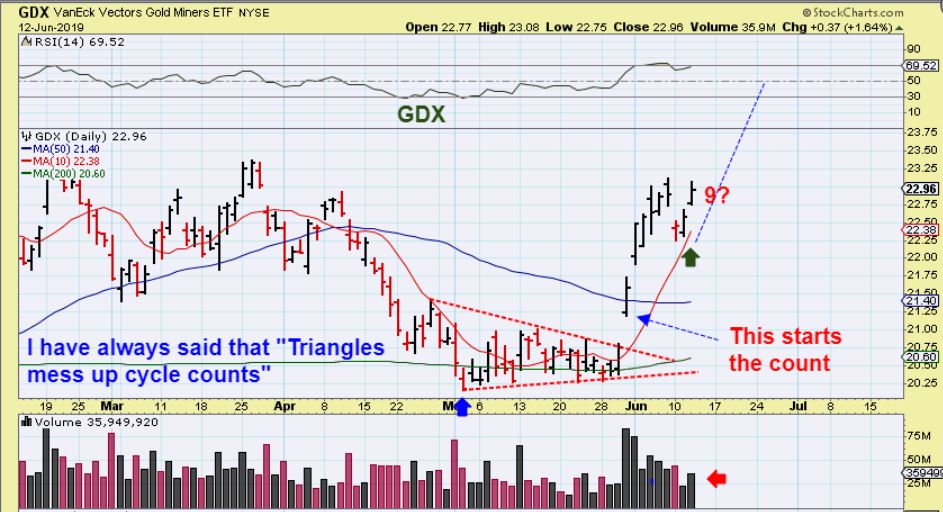
GDX – I have ALWAYS said that whenever triangles appear, Cycle counts can change. I have shown examples of this in the past, and we basically had a triangle into the end of May. With this thought, it will take time to play out, but I repeat- “You want to own Miners in the early stages of this intermediate cycle out of an ICL.” Surprises can come to the upside.
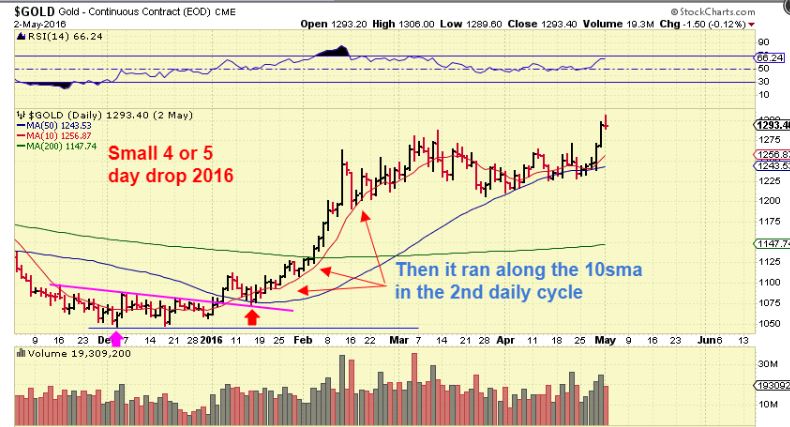
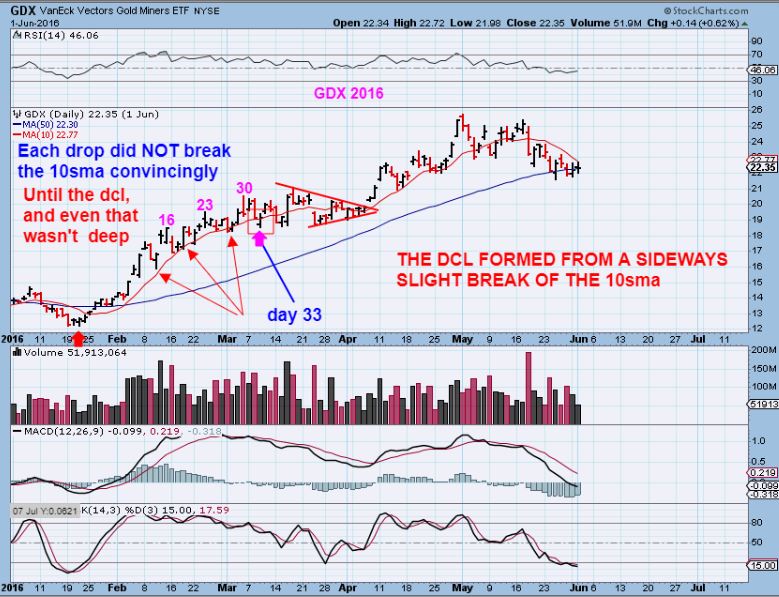
GOLD 2016 – And AS A REMINDER: The pull backs in 2016 were MILD, not deep crashes, and that made them hard to buy. The pull backs were tagging the 10sma and continuing higher for a while.
From Yesterdays report:
GDX 2016 run – All of the dips along the run were Mild here too. They bounced at the 10sma a few times and then only went sideways late in the daily cycle. You couldn’t buy the dips if you sold everything, because even the DCL formed very mildly in a sideways drift or chop. That is Good to know!
So just like GDX & GDXJ bottomed at different times, and therefore are in different areas above their lows, Various Miners are in various levels of their rally. They could perform differently. Take BTG as an example:
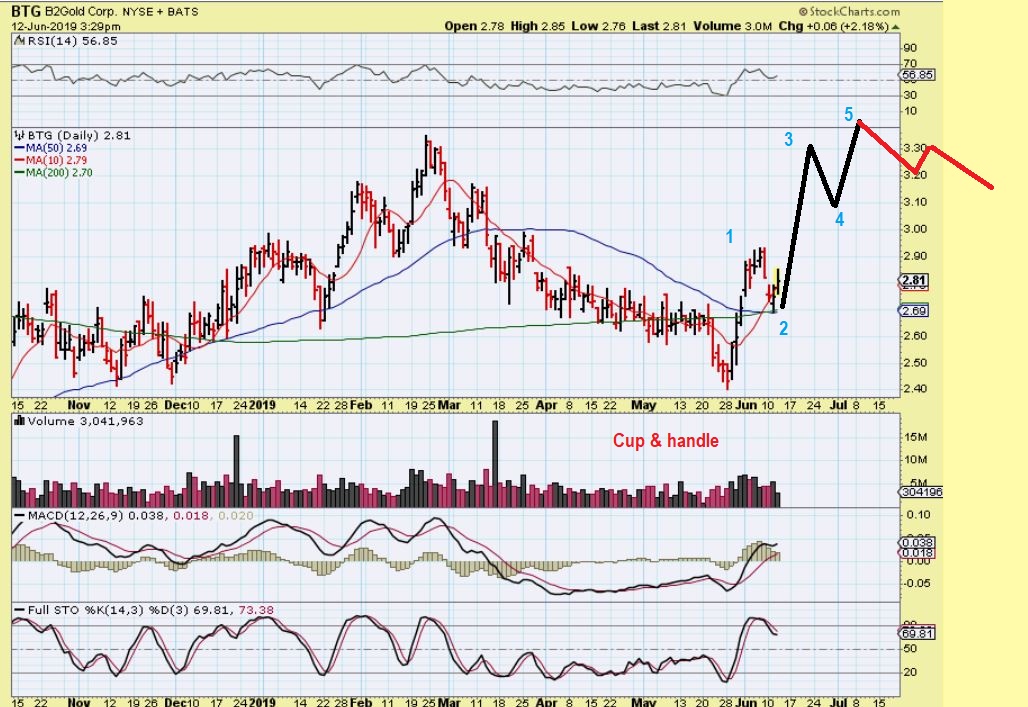
BTG – This doesn’t look like it is ready for a dip to the dcl like GDX. It looks like GDXJ, coming out of the lows at the end of May. So it may perform differently…
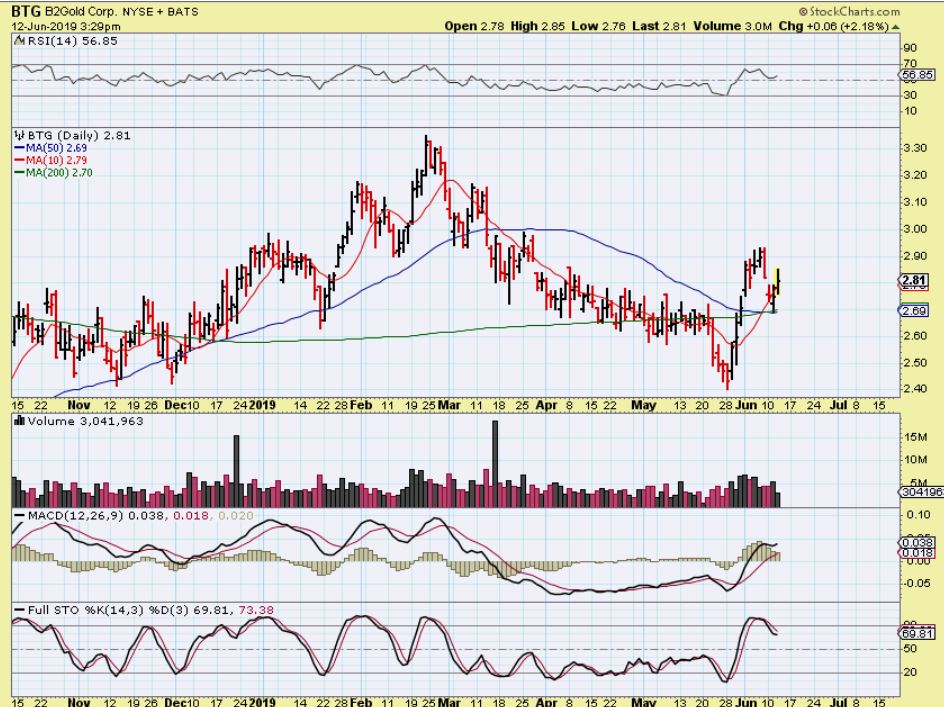
BTG – It may do its own thing to get to recent highs. We’ll just have to see how these play out, but many look Bullish.
.
AND AGAIN GDXJ – It just doesn’t look ready for a dcl, it looks to be on day 9 out of the lows.
Have you ever heard that expression, ” Expect the worst, but hope for the best!”? That works for Miners at this point. We want to be mentally ready if we do get a sell off for a few days into a dcl, but we also need to be mentally prepared if this keeps running higher off of the 10sma. Another thing that I have seen in the past is that individual miners can do their own thing. Gold could be down $15 one day, and KL or even some small junior may be green. That’s why we will try to buy the dips when low risk entries present themselves.
.
I will discuss a few more thoughts below, enjoy your Thursday trading!
.
~ALEX
.
I want to discuss 2016 and the various Miners that ran higher at that time. Looking at that rally can help to prepare us further for various possibilities…
.
Based on what I saw in 2016, different Miners can and may act differently at different times. Is that to be expected? Yes, that is what I expect. Some are already leaders ( KL, GFI, MAG, etc,) and others should eventually play catch up. Some Miners in 2016 did not even dip down at DCLs. THAT is noteworthy.
Let’s look at some charts…
.
I am just using this old chart from a past report to show that GDX BOTTOMED IN MID JAN 2016 after a sharp sell off. A good question would be, ‘Did any Miners resist that sell off ?’
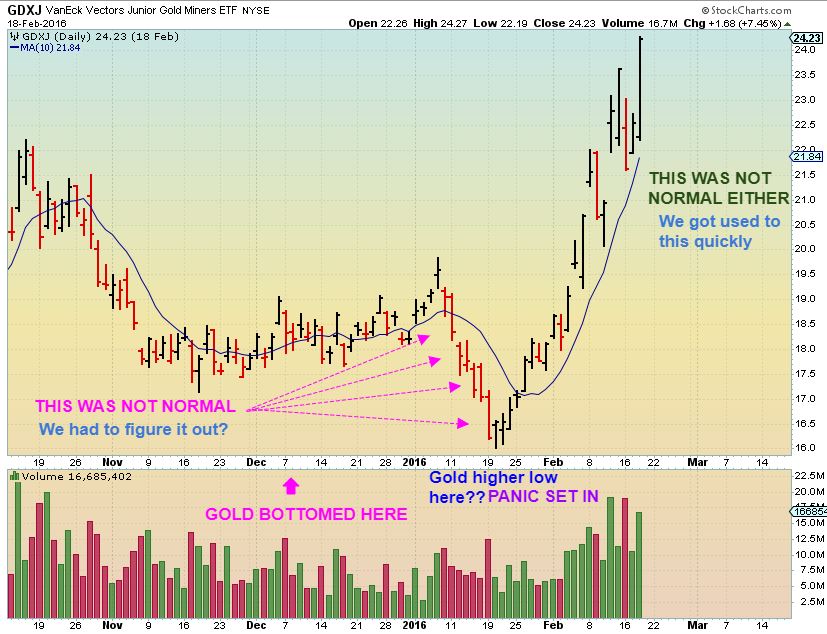
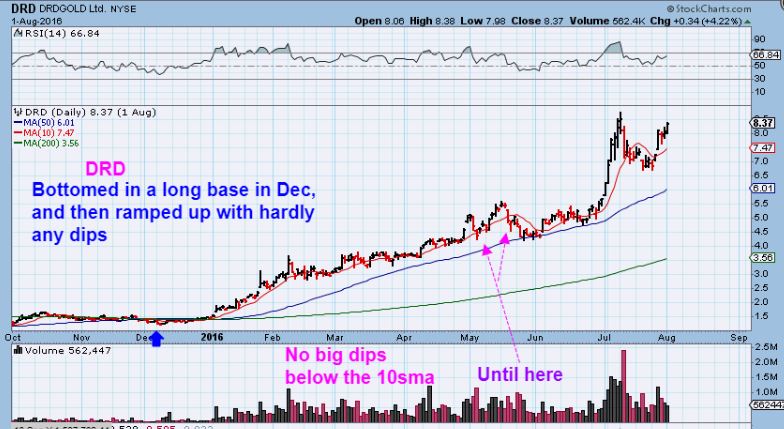
DRD 2016 – DRD was a junior that bottomed in December with Gold and didn’t drop at all in that January slam down. THIS shows us that individual Miners in a BULL RALLY can act on their own. They can resist DCLs. THIS is why I recommend not selling all of your positions…
.
( …cont ) THIS is why I recommend not selling all of your positions. Look at January on this chart. If someone sold during that deep Jan sell off when DRD was at $2, where would they have jumped back in? No dip was there to be bought, It ran straight to $3.50, then $4.00 and higher.
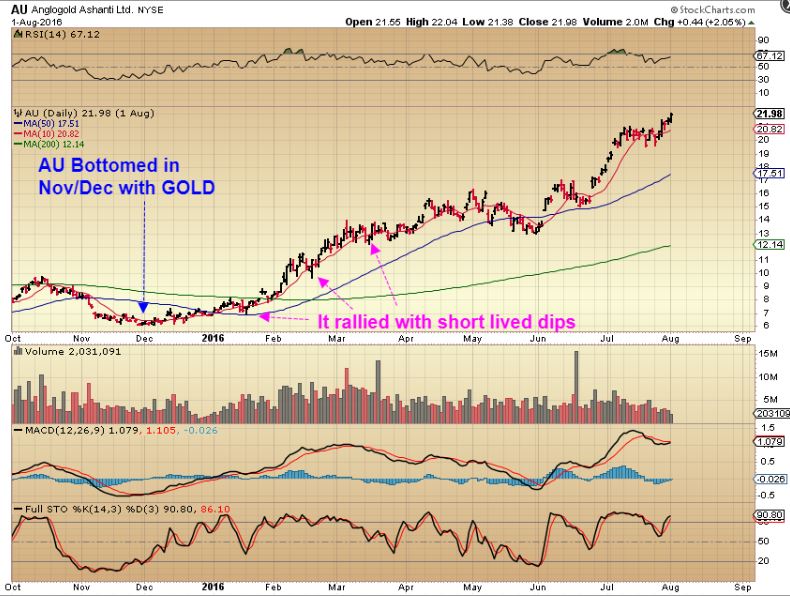
AU 2016 – Notice that AU bottomed in Dec with GOLD and hardly sold off in Mid Jan. It tagged the 50 sma and then broke above the 200sma.
.
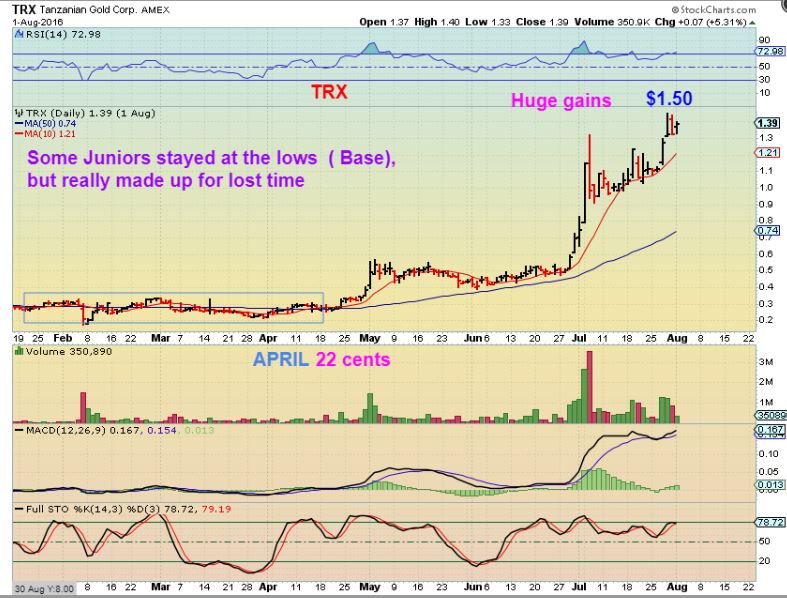
AND THEN THERE WERE THE LAGGERS THAT MADE UP FOR IT OVER TIME…
.
TRX 2016 – TRX crashed in February on high volume. It double bottomed in APRIL. Then it ran 600% higher in about 3 months, so you just never know how these Miners will play out.
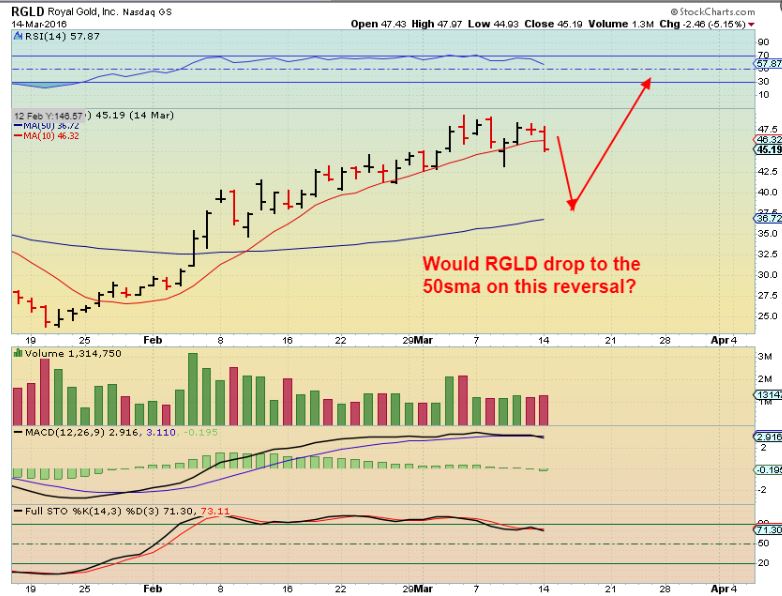
RGLD 2016 #1 – RGLD is an example of buying and not selling too. It looked like a nice easy Bull Run to ride, and many would look at this chart and think that they would just simply ride it higher. Easy to do, right? Well let’s break it down.
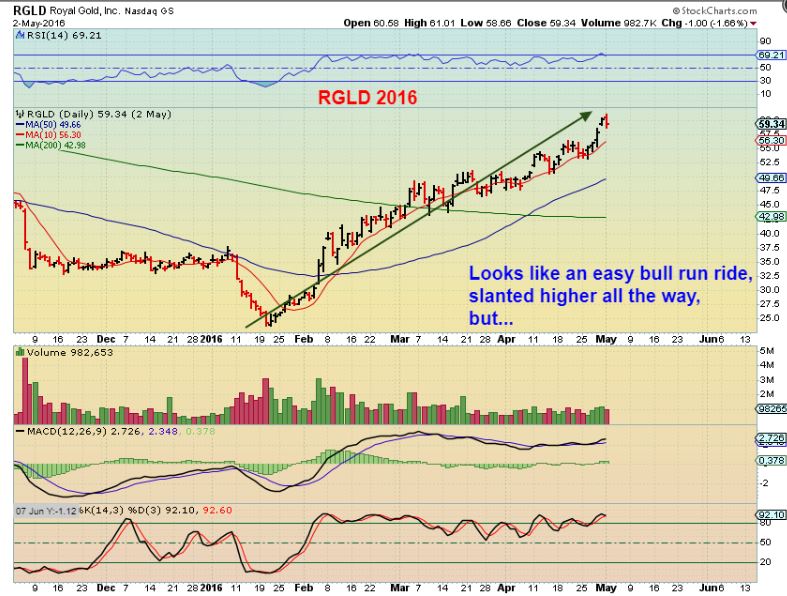
RGLD 2016 #2 – After surging from the lows, it had a few Big Down days. That may cause some to ‘Sell & lock in gains”. It also could drop to that 50sma, right? Some might ‘lock in gains in March & buy that dip”, but…
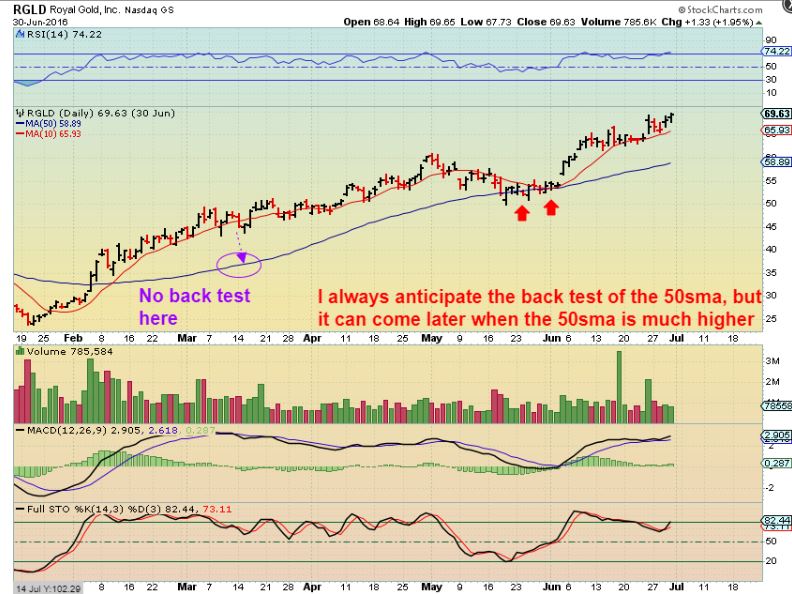
RGLD 2016 #3 – It didn’t drop in March. It climbed higher & higher and eventually tagged the 50sma 2 months later.
.
Again , I’m NOT saying that we are in a Run identical to 2016, but what I am saying is this
1. GOLD & GDX bottomed in Early May ( & SILVER & GDXJ Bottomed in late May)
2. When coming out of an ICL, with this set up, you want to be holding at least Some Miners.
3. And even buy or add on the dips, if we get them.
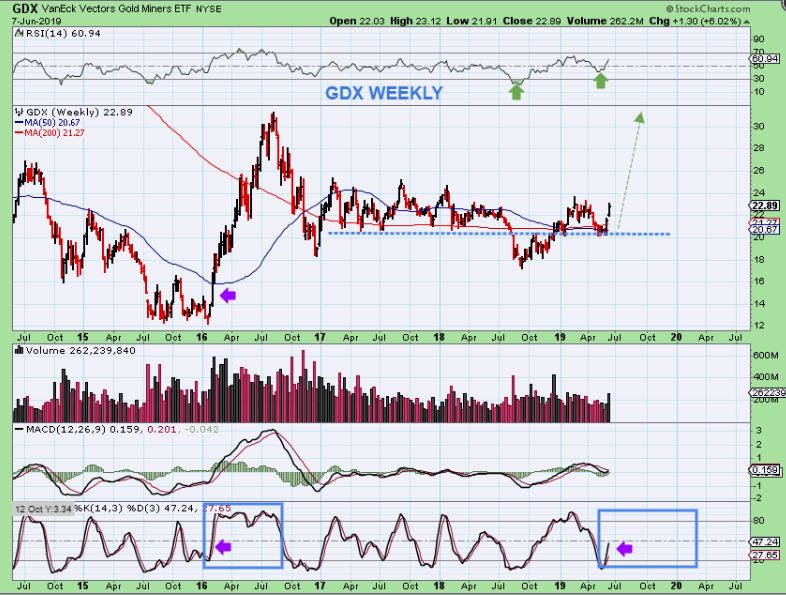
4. The first leg of this run from September to January was pretty choppy, but now look at this recent move. The past 2 weeks on this chart has been straight up so far. The dip to a dcl can still be just ahead, but it may not be all that deep. In a bull move, surprises often come to the upside, so stay invested and add on the dips if we get them.
.
CONGRATS to St Louis – it was a great 7 game battle 
.

