
JUNE 1- Looking Good!
So in this Big Picture Report I am going to just let the charts do the talking. At this point in time, it now looks like things are playing out very much as expected way back last summer. You’ll see what I mean, and it should be good news for those that are sick & tired of this directionless chop! Enjoy…
Last Summer I was thinking that we would eventually see the Markets Top, The USD drop, and Precious Metals rally strongly in 2019. That set up actually now seems to be falling into place very well. Talk a look, I’ll just let the charts speak.
.
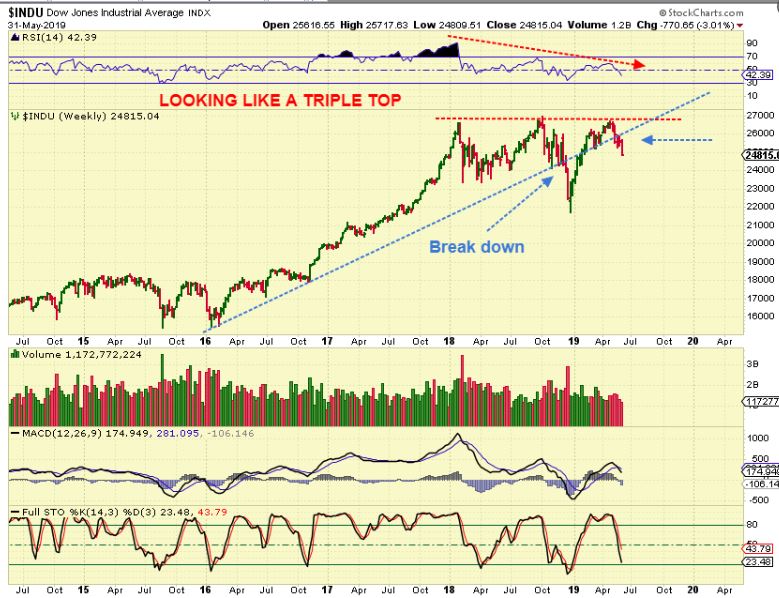
DJIA WEEKLY – Looking like a Triple Top and breaking below the upward trend line again.
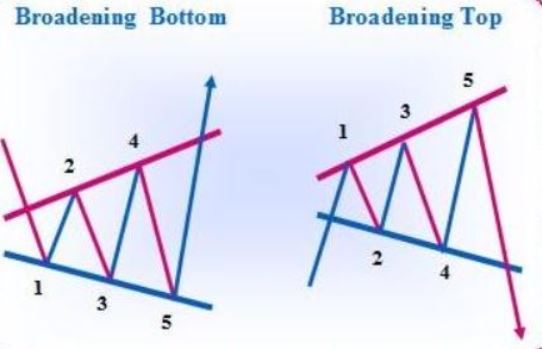
LOOK AT THIS PATTERN – YOU CAN SEE WHAT A BROADENING TOP LOOKS LIKE, RIGHT?
SPX WEEKLY – Does this look familiar?? Look where I put the ** marks for similarities to a recent crash in 2018.
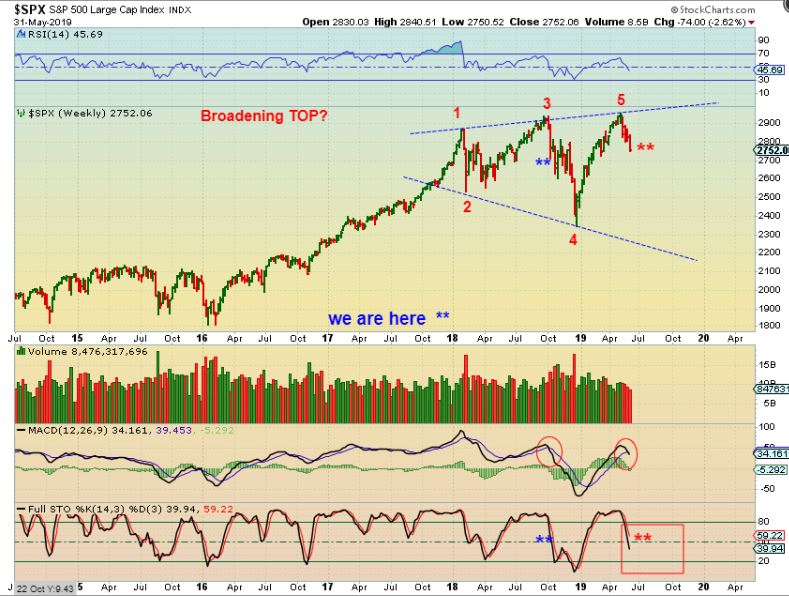
Summary: Starting now ( or a few weeks ago) The 2nd 1/2 of 2019 could see the Markets drop, USD drop, and Gold rally.
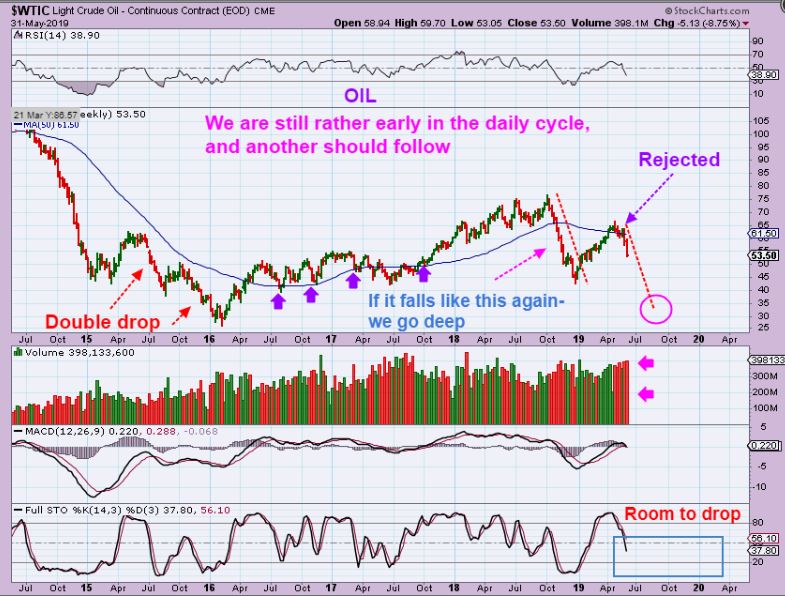
WTIC WEEKLY #1 – Oil crashed down after the Oil Inventory report 2 Wednesdays ago, and hasn’t stopped since. In the Big Picture report , this was rejected at the 50 week MA. To be Honest : I did NOT expect this, because OIL ran higher with Miners in 2016. I thought we could see that again, but Oil is having real issues here.
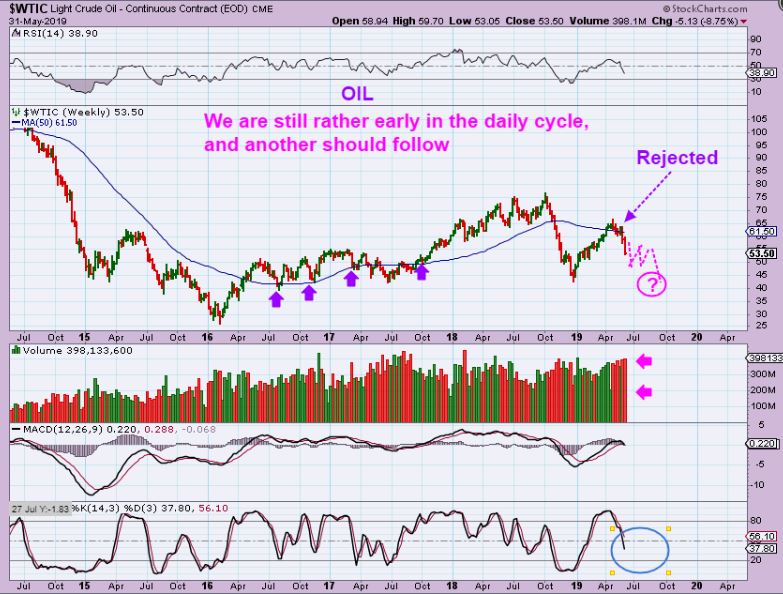
WTIC WEEKLY #2 – The chart above showed a drop & consolidate, this is the answer to “What if the Markets & Oil sell off like it did at the end of 2018?” Oil has a failed daily cycle & likely another one to follow. Oil could get very cheap again.
.
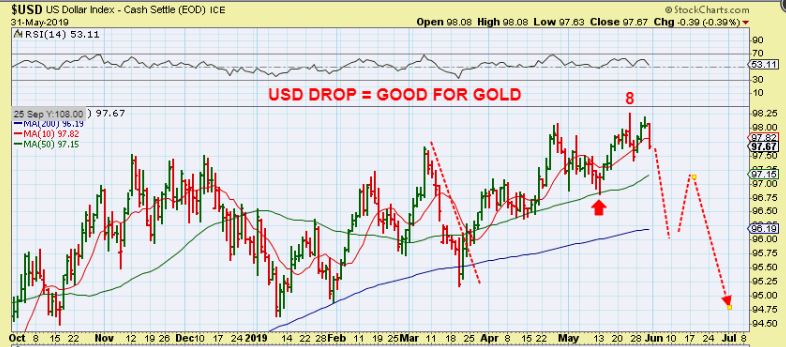
USD DAILY – I think that the USD topped on Day 8, but the BIG PICTURE tells the real story!
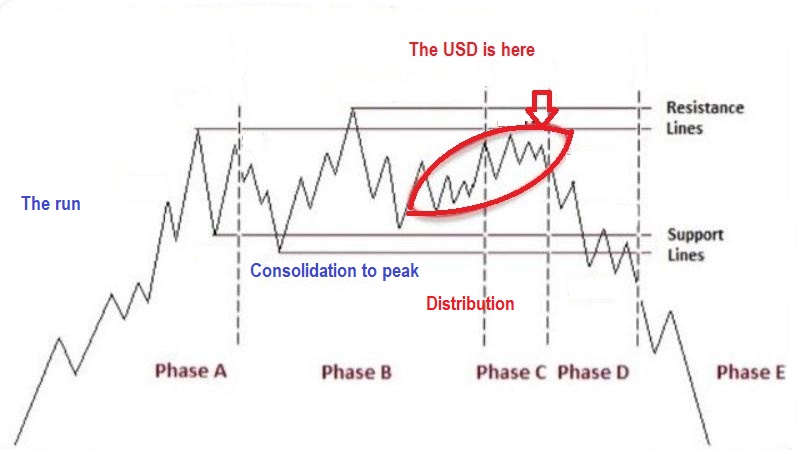
ANOTHER PATTERN OF SIMILARITIES – You will be amazed at how similar this pattern of a topping process looks to the USD. Wth a topping process we see a…
-Run Straight Up
– Choppy consolidation with a final run to a ‘peak‘
– a drop and then a choppy move higher toward the peak (distribution) Red circle.
– A strong drop.
Now SCROLL DOWN TO THE USD, and scroll back up a few times. Uncanny similarities really. What comes after the distribution phase?
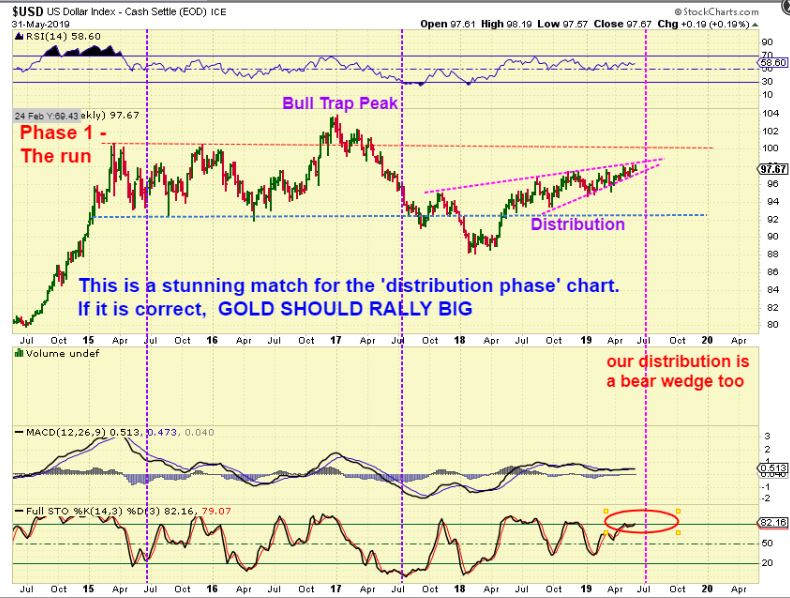
THE BIG PICTURE USD LOOKS TOPPY TOO. THAT SHOULD BE GOOD FOR GOLD.
.
GOLD: LET’s START WITH CLARITY- I WANT TO BE CLEAR HERE…
.
GOLD 2 WEEKS AGO: GOLD WAS CHOPPING SIDEWAYS. I SAID THAT I THOUGHT A MILD ICL COULD BE IN PLACE, BUT THE CHOP MADE IT A BIT UNCLEAR AT THAT TIME, WHAT ABOUT NOW?
GOLD THIS WEEK: IT IS VERY CLEAR THIS WEEK THAT THE BULL OVERTOOK THE BEARS. TO BE CLEAR, THIS IS BULLISH! A HIGH MILD ICL IN PLACE.
![]()
.
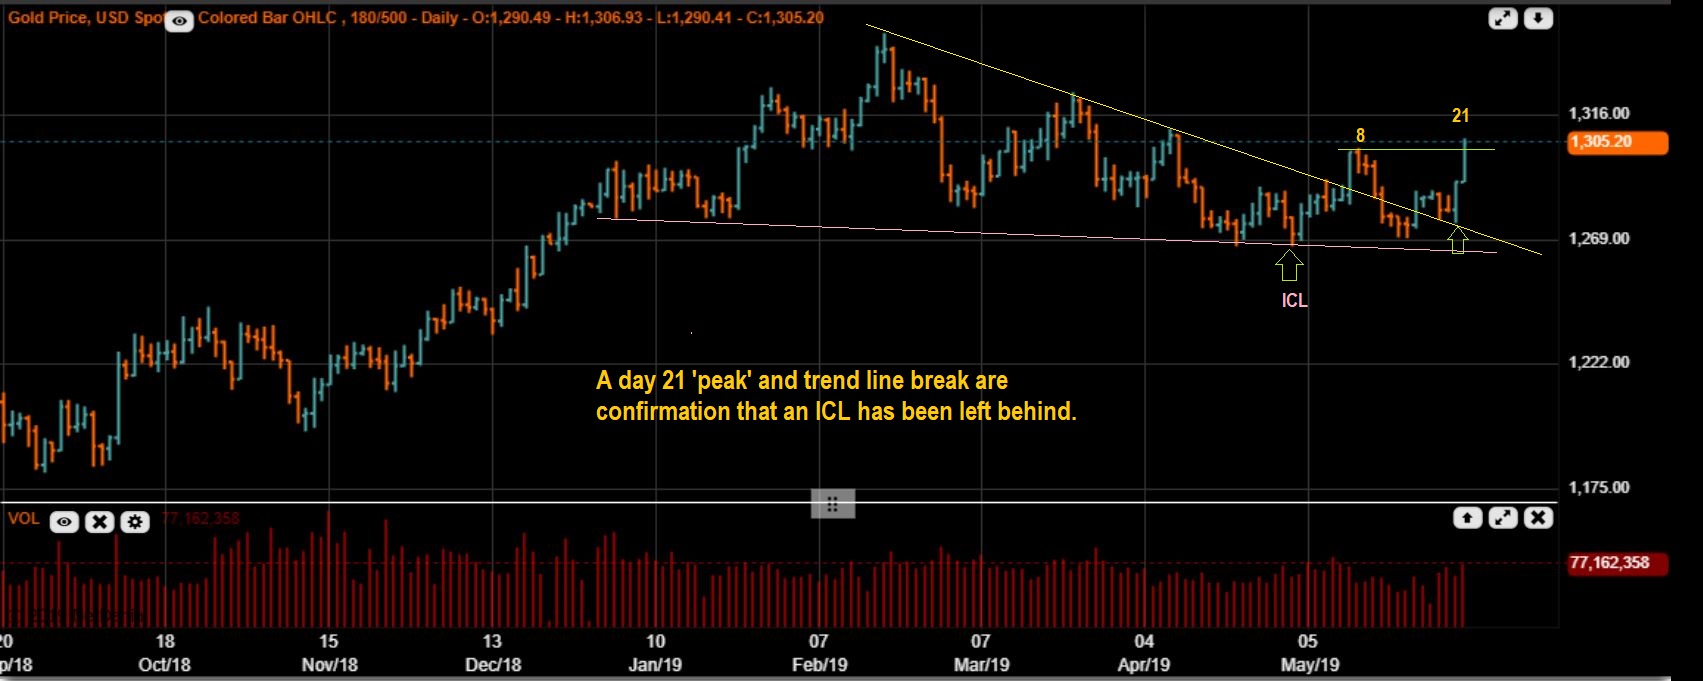
GOLD DAILY – Click to enlarge charts- We got a ‘peak to new highs’ so far on day 21 of this daily cycle. THIS usually means that this will be a right translated daily cycle. Those don’t come on the 4th or 5th daily cycle- THIS NEW PEAK & TREND LINE BREAK ARE LIKELY THE FIRST DAILY CYCLE.
.
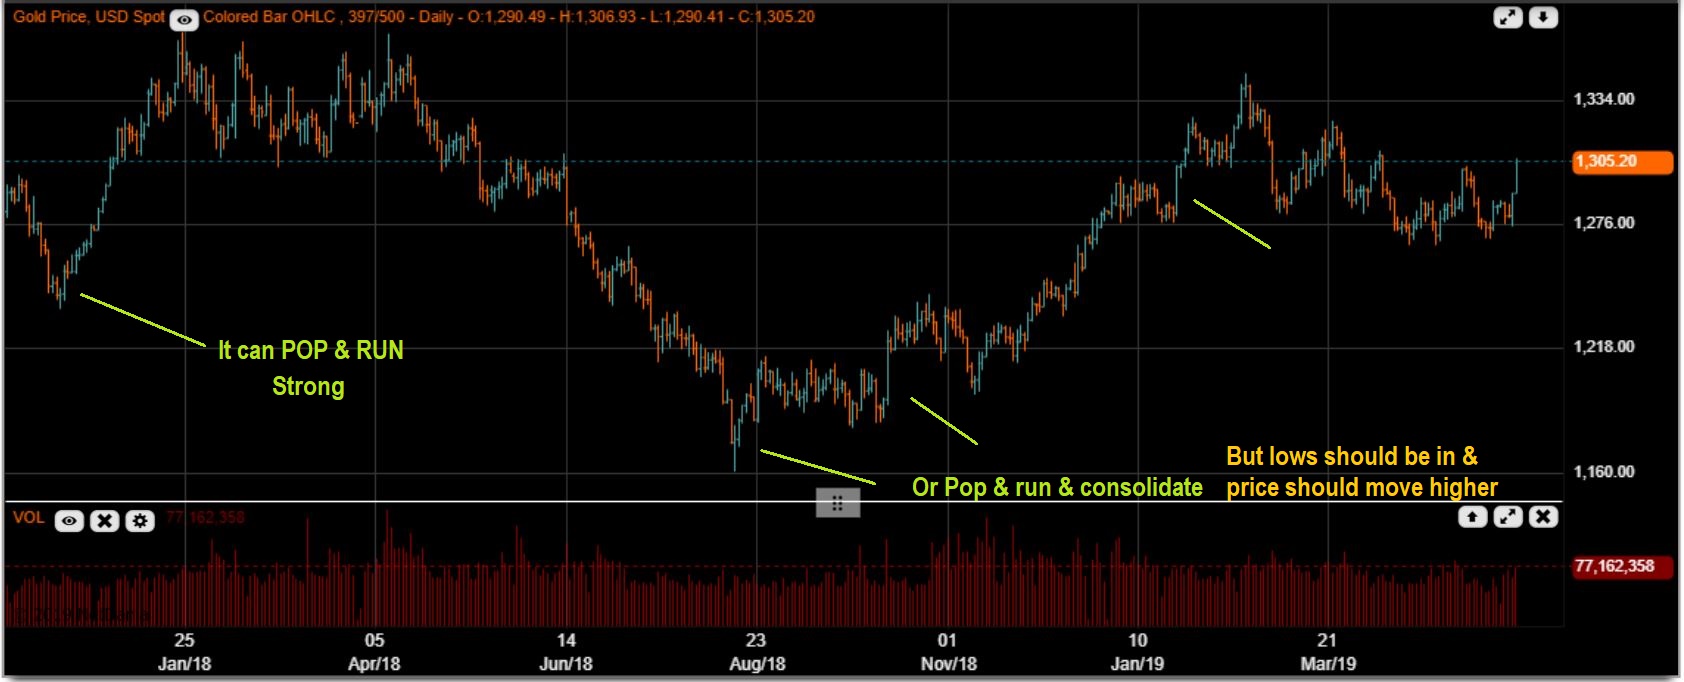
GOLD DAILY – Here I just wanted to show you that A Big Pop can just take off and run, like we see on the left, or we can POP, churn and then rally. If this pauses, don’t be alarmed. IN fact…
.
GOLD DAILY – Even 2016 broke out on day 21, peaked on day 24, and back tested the break out with a dcl on day 28, before seriously ramping up higher in the second daily cycle.

.
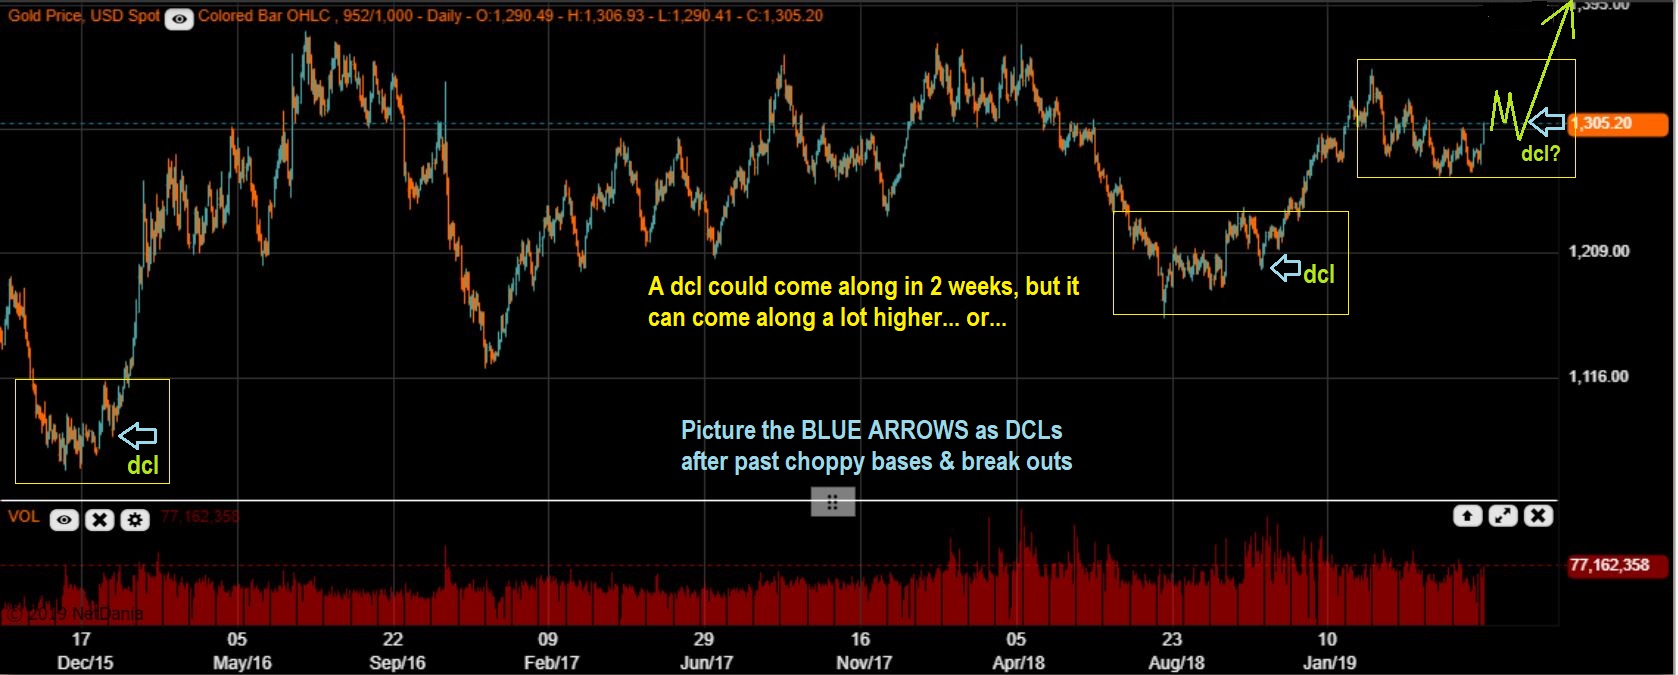
GOLD DAILY – We are on day 21, and a daily cycle can come on day 30-40. Notice that a dip was seen in 2016 and also the last Aug ICL had a dip, so I drew a dip in here. IT IS A BULLISH SET UP even if we see a dip.
.
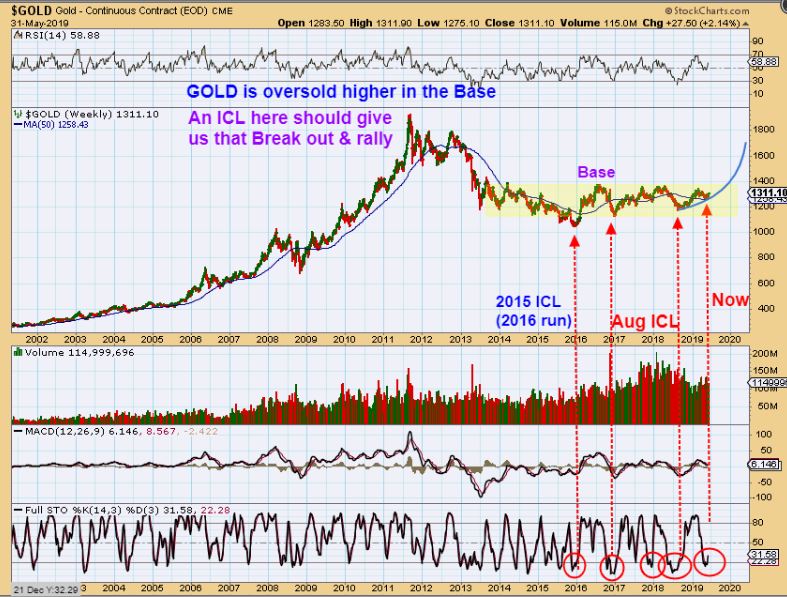
GOLD DAILY – This is the Bullish set up. We are forming an ICL higher up in the base, so an ICL here can lead to much higher price over the next few months. MUCH HIGHER. Gold is ICL Level Oversold.
.
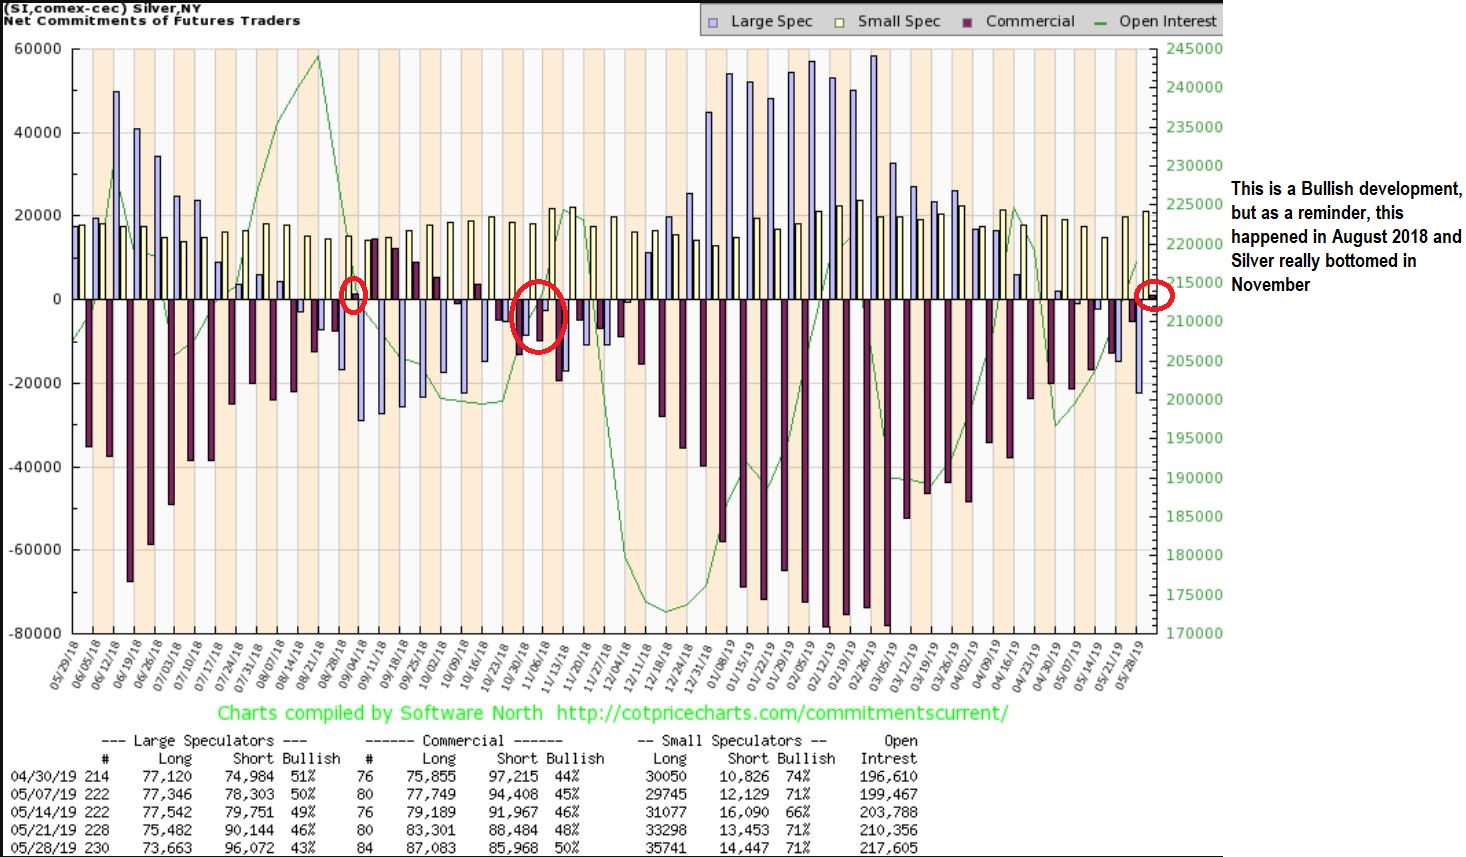
SILVERS COT – Silver did move to a very bullish position . Let’s take a look at Silver…
.
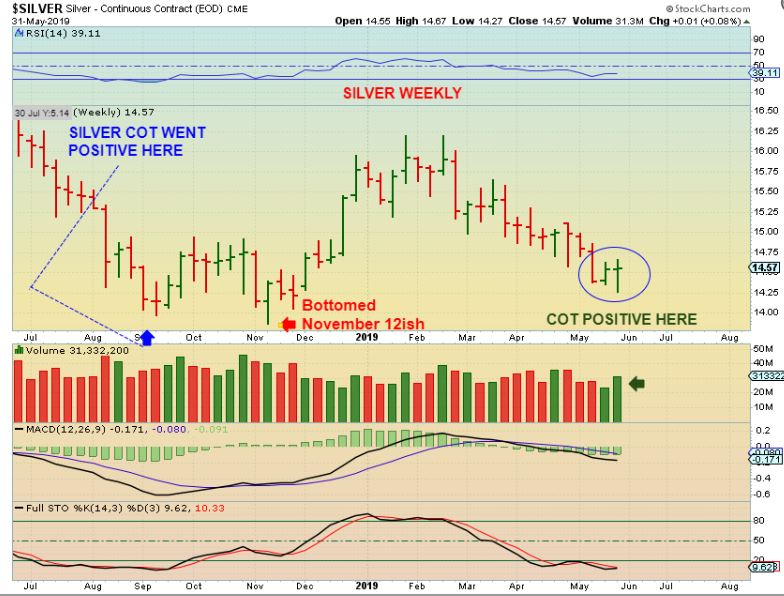
SILVERS – The COT went positive in August 2018 and Silver bounced, yet Silver really bottomed later in November. Currently Silver reversed this week and looks bullish with a matching COT.
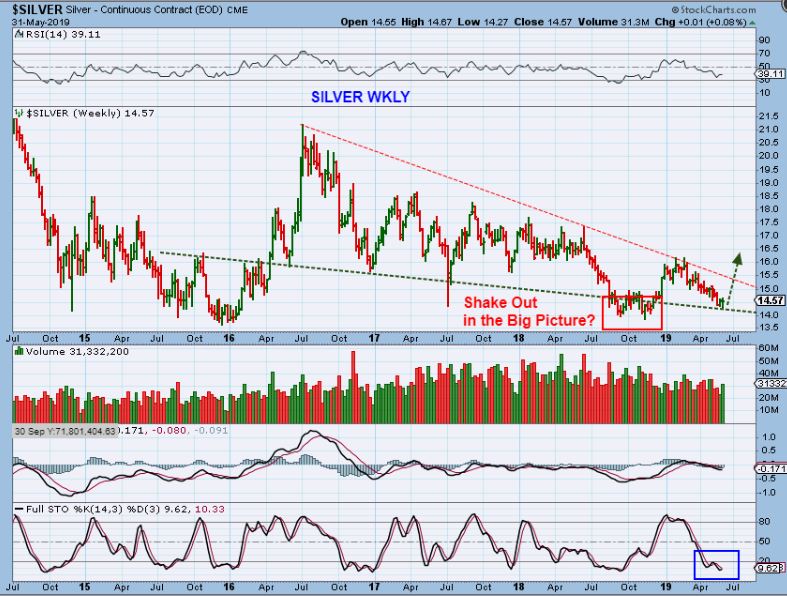
SILVERS – Last August & November lows actually look like a shake out and this could be the real launch pad. Silver is very oversold and could really run strongly from here.
.
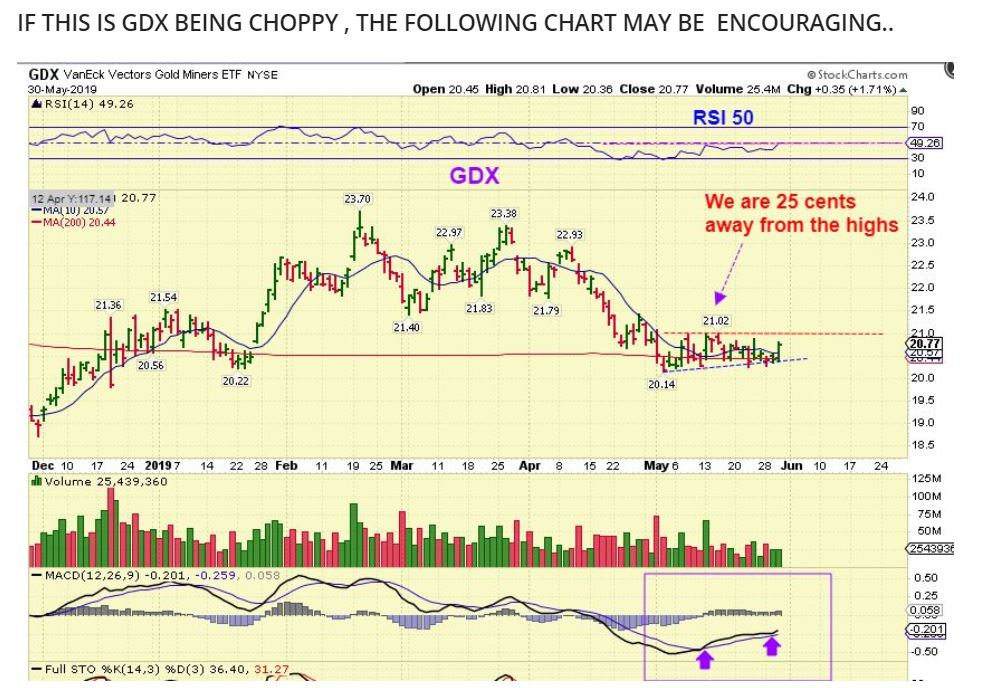
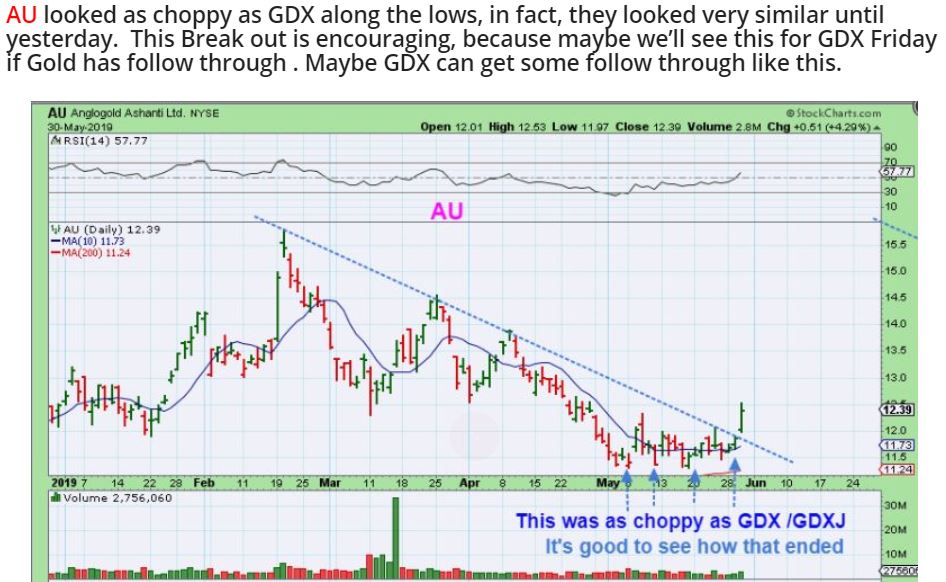
This is GDX from Friday Mornings Report – I mentioned that a similar looking set up in The AU Chart was encouraging…
.
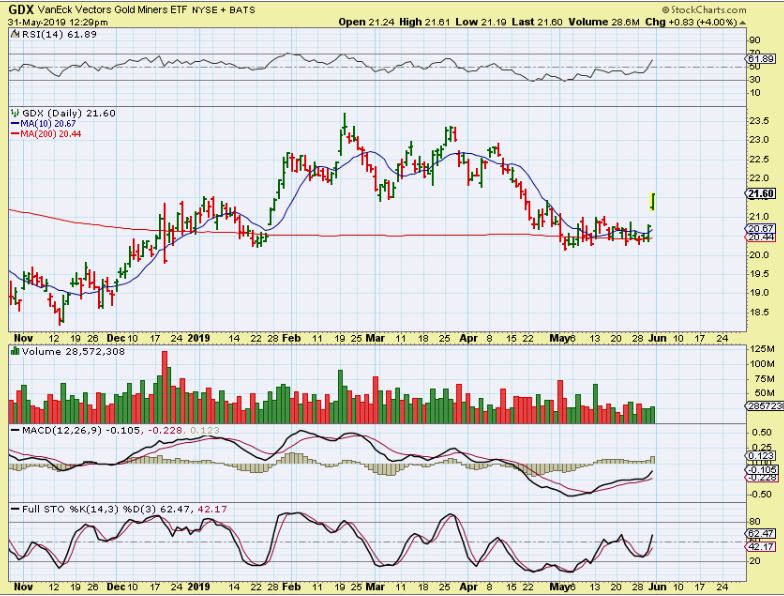
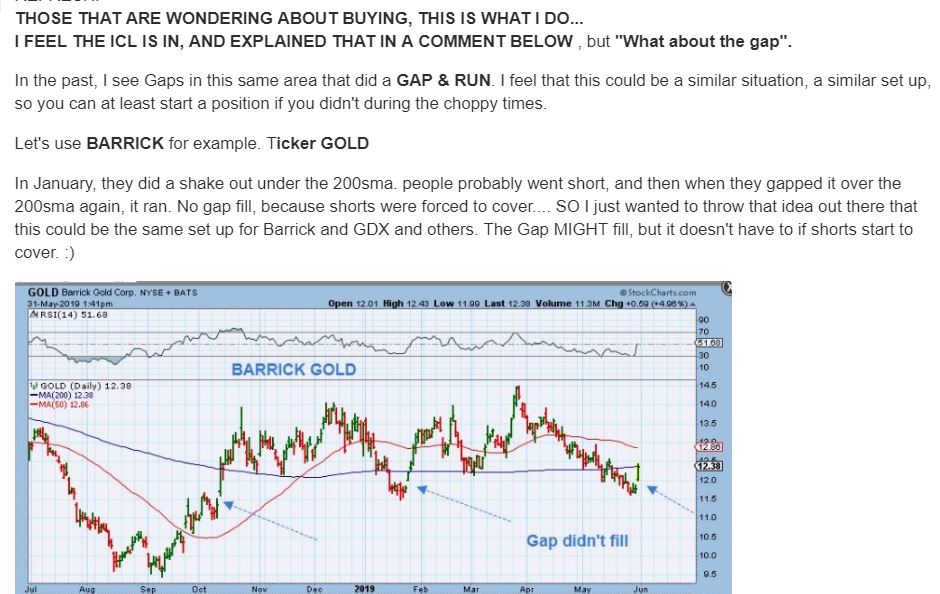
GDX DAILY – Now GDX does look like AU did with that POP out of the triangle. This is very encouraging, because it is a new peak on day 21. In the live trading area, I mentioned that even though the gap COULD fill, this power gap does NOT have to fill. With that in mind, I recommended buying a small position and just add if it dips later. Look at the GAP OPEN in January- It didn’t fill right away. I then added an example with Barrick Gold…
.
BARRICK GOLDS GAPS – I wrote this advice in that live area- click to enlarge
.
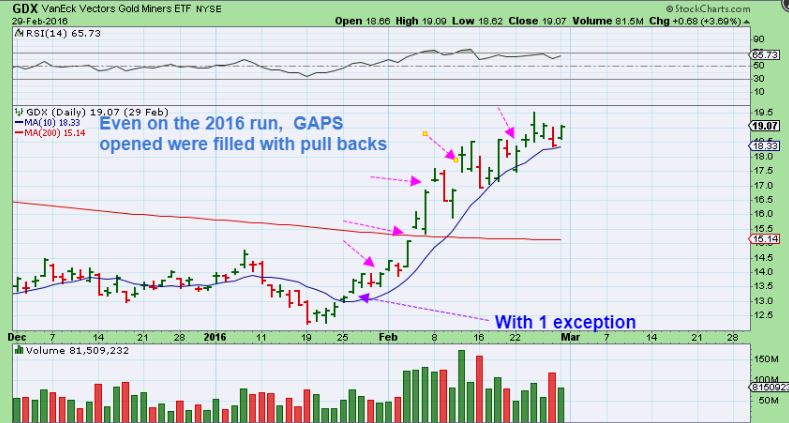
GDX DAILY – Very interesting that even in the strong 2016 run, ALL gaps filled except for that initial break away gap higher. So this one may or may not fill too.
.
GDX WEEKLY – We now have a Beautiful Weekly break higher here, and what looks to be the next higher ICL in place. Read the chart.
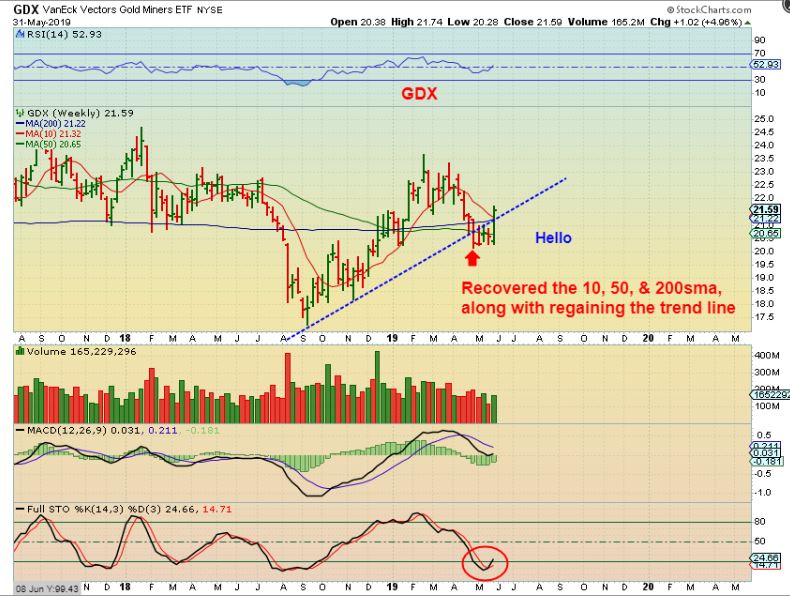
GDX WEEKLY – This Big Picture is what we have been waiting for, right? And trust me, You haven’t missed the big move that is expected to follow. 🙂
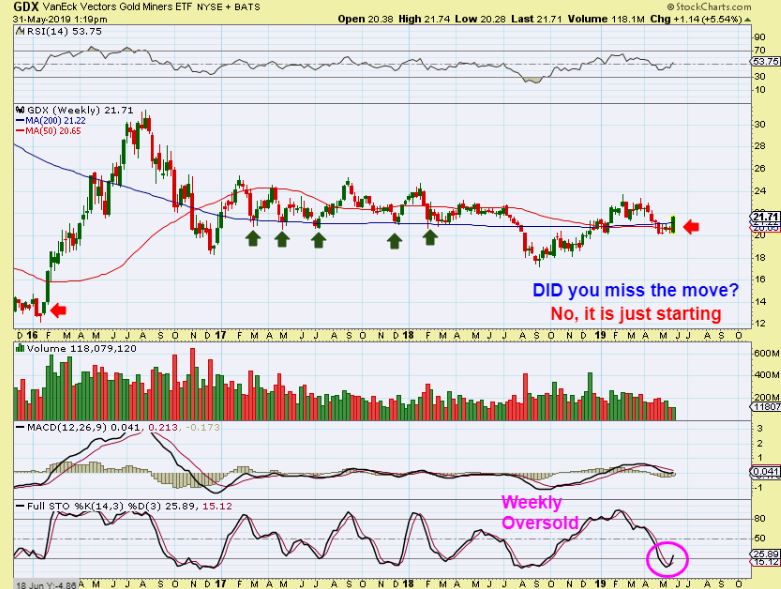
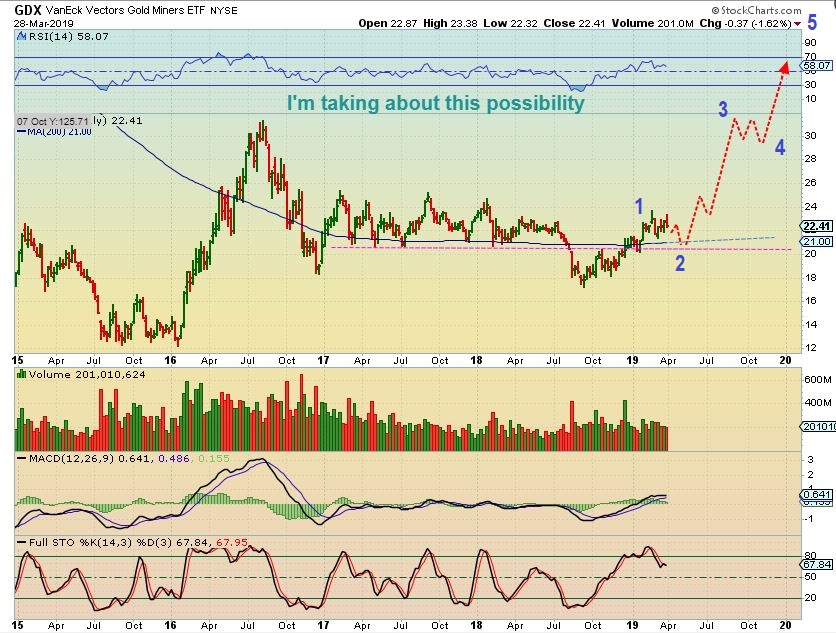
I’ve been discussing a move like this for a long time. The move in the ABOVE chart could be just the start of the move in this chart.
.
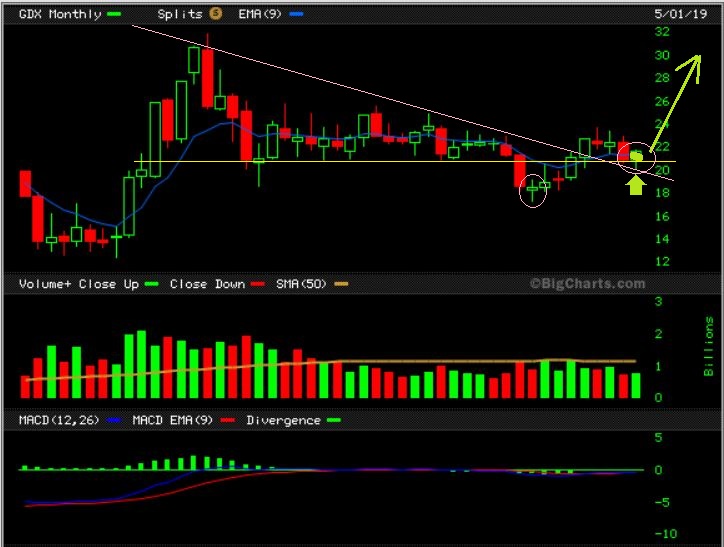
GDX MONTHLY: MAY IS OVER. It ended with a bullish reversal that back tested the pink trend line. This low formed as a much higher low than Septembers. If an ICL is forming this high in the pattern, I believe that Miners can rush to the former highs in a run similar to the 2016 Run.
.
Big Picture Conclusion: The General Markets look to have topped, the USD looks to be topping, and Precious metals looks to be putting in a much higher ICL from the AUGUST/ SEPTEMBER ICL. That is how up trends start and this sector looks like it is the one to be in. I am going to be focusing on Miners going forward and I expect many great set ups to form and upside gains to be excellent. THIS IS WHAT WE HAVE BEEN WAITING FOR, and the signs point to an ICL being in place and a trending move higher starting. After an ICL, we have 2 – 3 Bullish daily cycles that last a month each, so that should lead to many weeks of gains. As usual, I will discuss this regularly as things play out.
I’ll discuss a little more about some Miners below, knowing that we should now be able to start enjoying the trading a lot more! Low risk Set ups & entry points should form in various Miners, giving us much better conditions to trade in than the choppy sloppy movement that we’ve been seeing lately. That choppiness is just how bases form, but they then build energy to give us the upside run that we are looking for. Things are now looking very good for the weeks ahead. Enjoy your weekend!
.
~ALEX
.
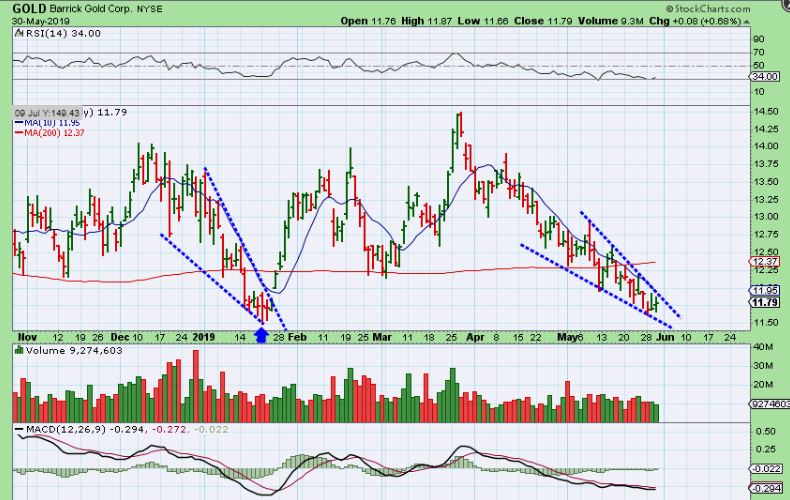
BARRICK GOLD – I posted this chart and mentioned that these choppy sell offs leading into wedges are good Bullish set ups to enter. We are at the lows. The last one Gapped open here & ran.
.
BARRICK GOLD – And those Gaps did not have to fill, so this was a buy.

.
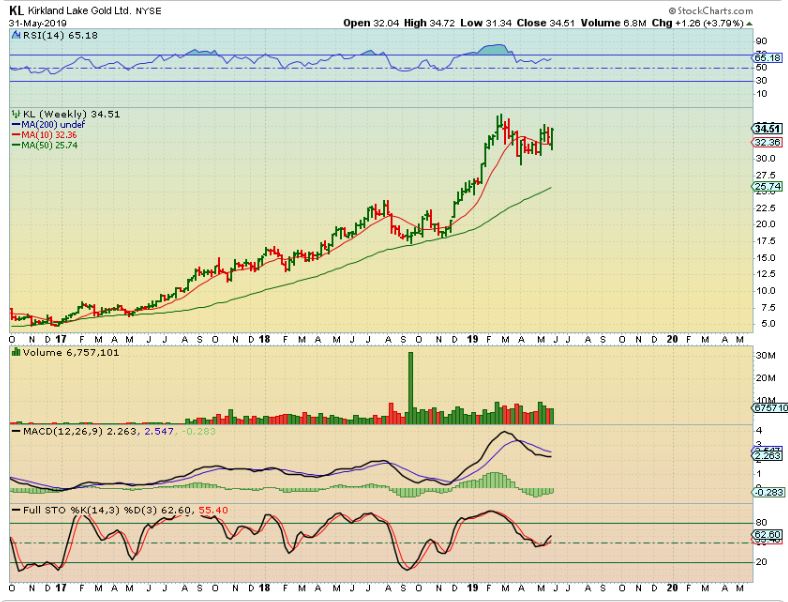
KL WKLY – Not only is this a strong run from $5 to $35 over 2 years, it has also consolidated and could now be ready to go again. KL doubled from the AUG ICL, it could double from here. ( $30-$60).
.
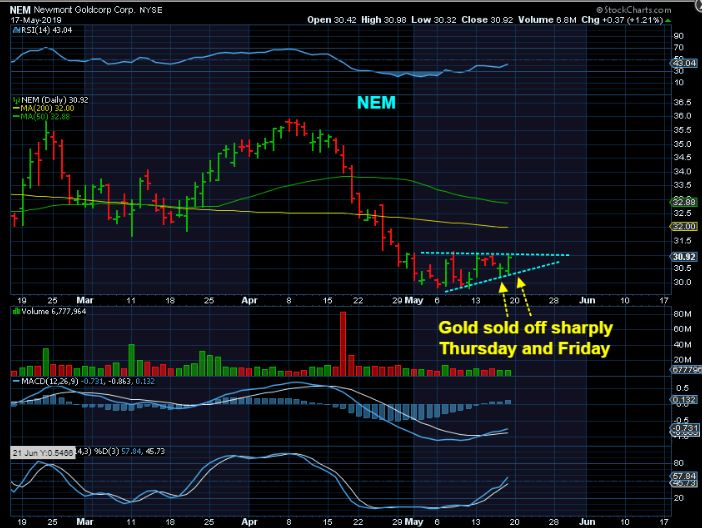
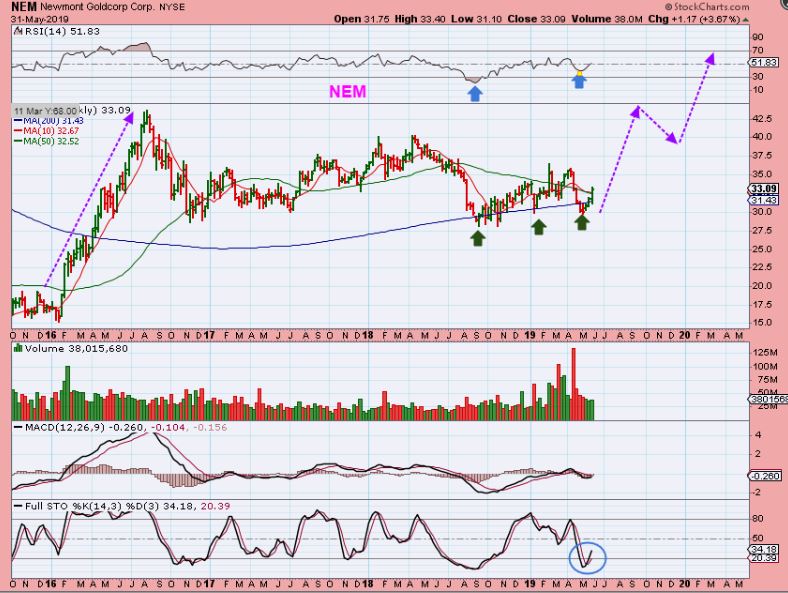
NEM – I posted this as a bullish set up when the Gold ICL seemed to be in place. Trading had been choppy, but NEM looked set to break out.
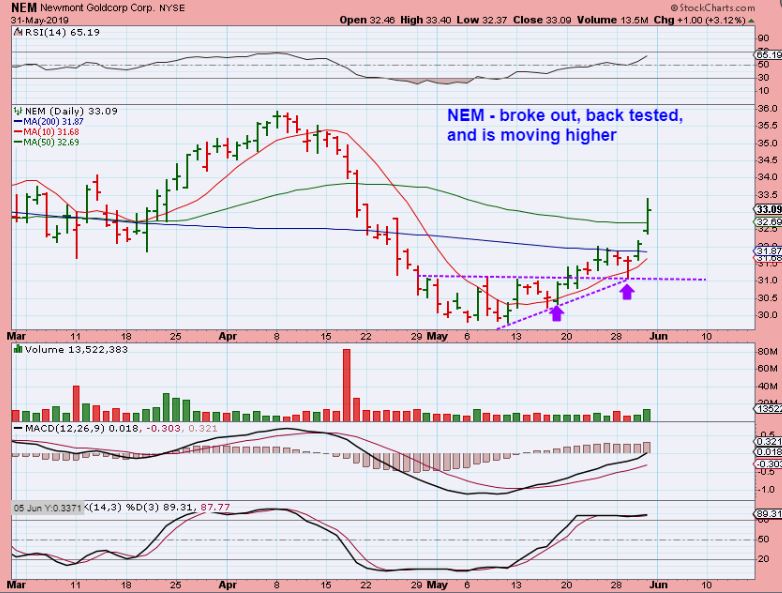
NEM – NEM actually broke out, back tested, and is now moving higher. So things are looking Bullish again…
NEM WEEKLY – This looks like a Multi-year consolidation of the 2016 gains, and even though it looks choppy, that could be about to change in a big way when FUNDS start buying again.
.
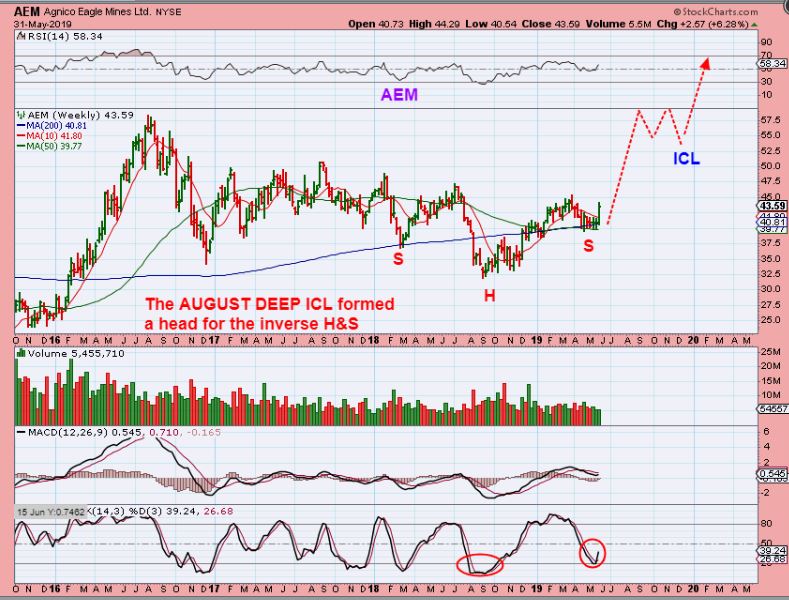
AEM WKLY BIG PICTURE – These could all start forming those big CUPS and the gains should be very good.
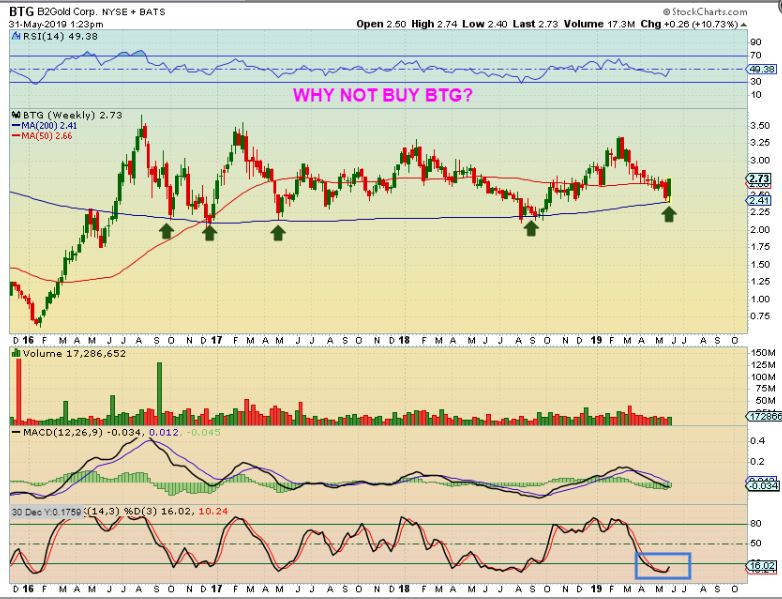
BTG WEEKLY – At a glance it looks like just choppy trading, but a stock like BTG has actually been doing a very constructive consolidation. If we are getting that Big Move for Gold above $1300, and $1400, and higher- This could easily double or triple or more under the current conditions.
 .
.THIS CHOPPY SIDEWAYS PRICE ACTION THAT HAS BORED US TO TEARS MAY BE ABOUT TO PAY OFF IN A GOOD WAY. LET ME SHOW YOU SOMETHING…
.
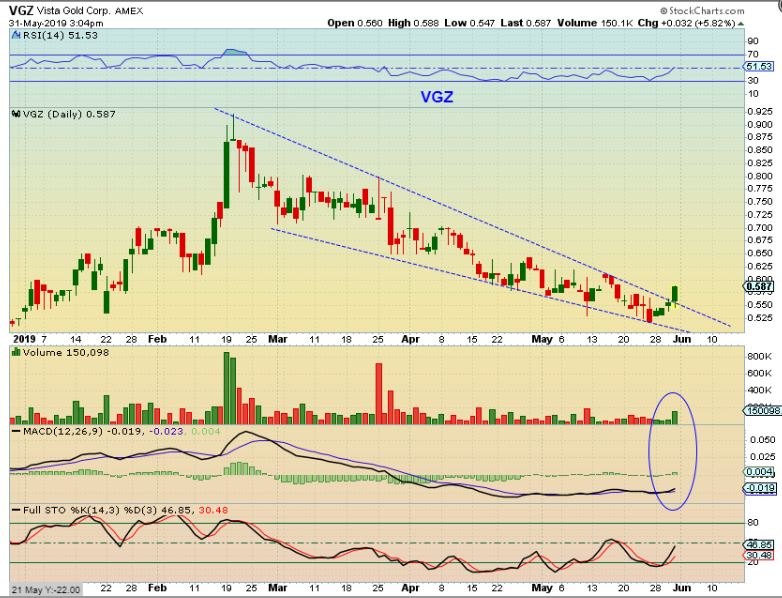
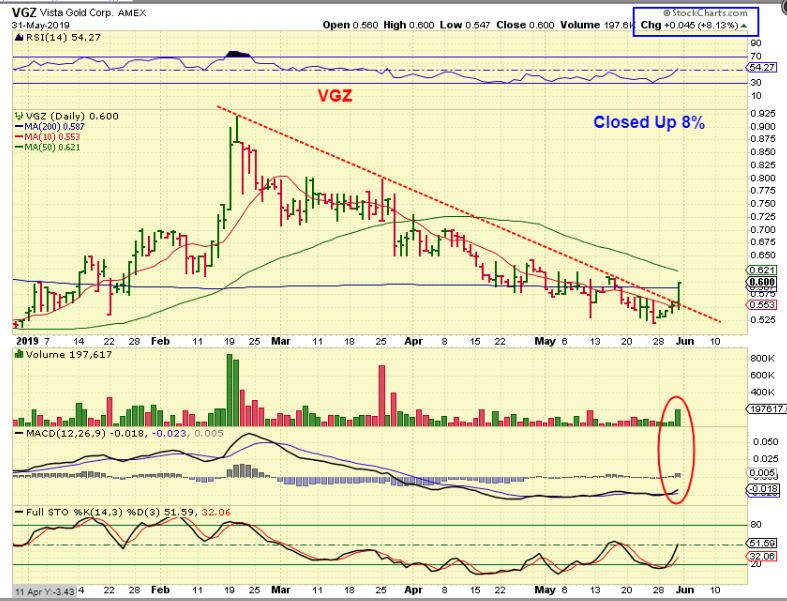
VGZ – I posted VGZ Friday with 1 hr left in trading. It was actually RED Friday morning with Gold breaking out and then it slowly pushed higher, so theres no gap to fill. This is a bullish break out and…
.
VGZ – VGZ kept climbing and broke above the 300sma with ease. It closed up 8% after being RED that morning. It broke a downtrend. Volume is increasing. A MOVE TO FEB HIGHS should be easily attainable, and that is almost 100% from the Monday lows. AND…
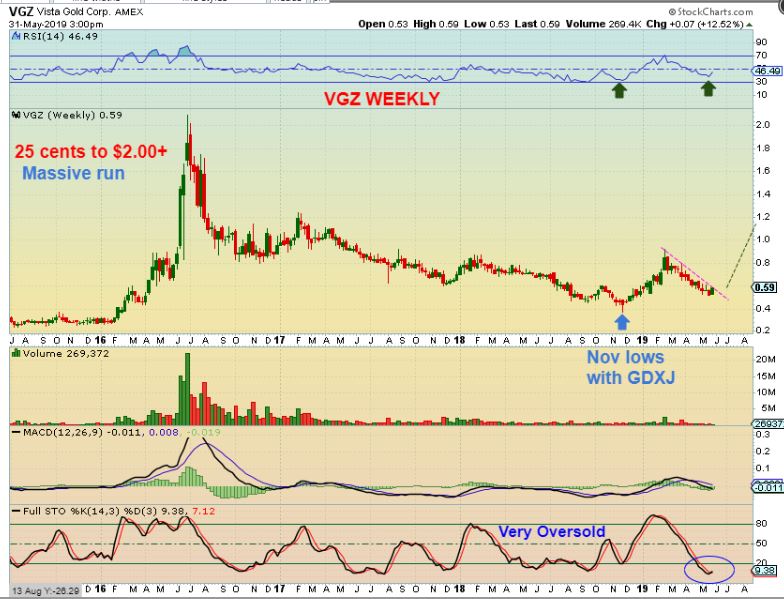
VGZ – Have you seen the Big Picture View of VGZ? In 2016 VGZ ran from 25 cents to $2.00 and if this is a big base, it can run back to those former highs over time. It may take time, but those are Big Gains.
.
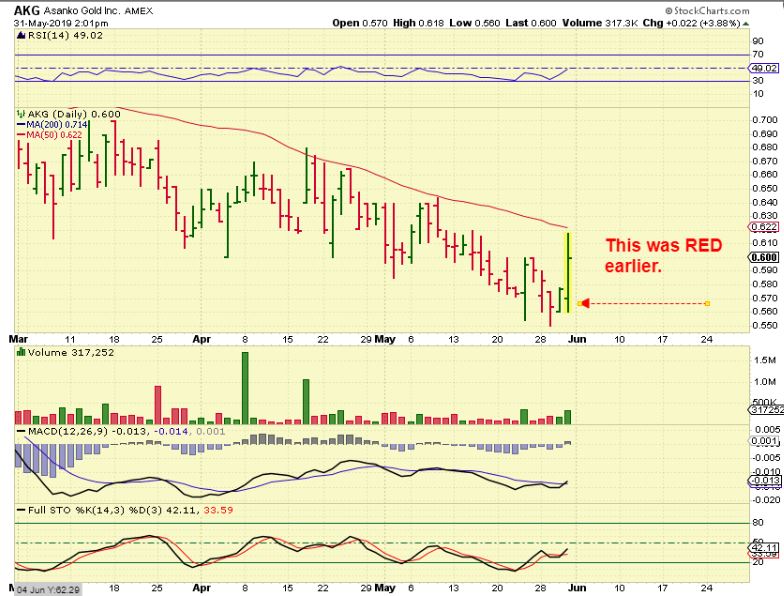
AKG – AKG was another one of those RED MINERS with GOLD breaking out to new daily cycle highs. Suddenly it turned higher, so I posted this chart 2 hrs before the close. Volume reached over 500,000 by the close. This was a $4.50 stock in 2016, so the potential in these beaten down Miners is big (over time).
Obviously I am going to focus on good set ups in this Mining sector, and having been through this many times before, I will continue to mention important reminders like:
-
Do not put all of your eggs in one basket, Own a basket of 4 or 5 for safety
-
Be aware of the time that your Miners release earnings
-
Miners can drop quickly on bad news too, use stops if you are not in front of the screen, etc

