Tuesday May 14th – Puzzle Pieces
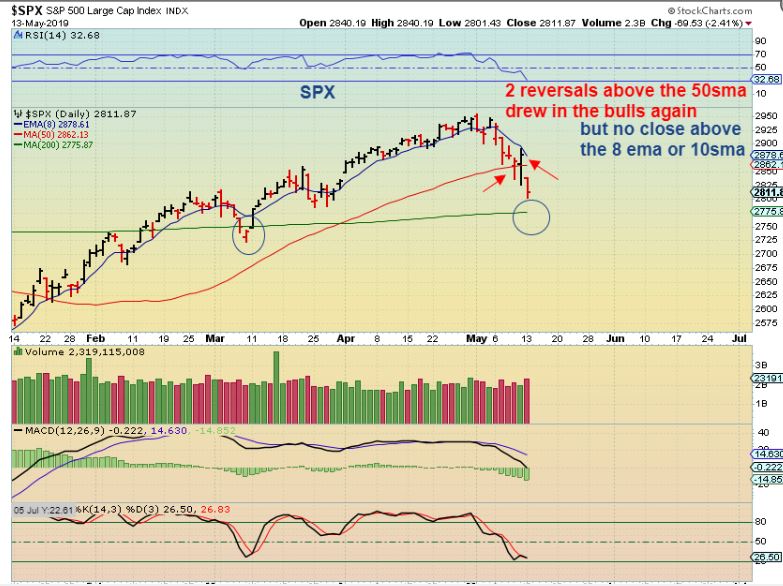
SPX – Well, it looks like the Thursday & Friday reversals at the 50sma likely drew in the Bulls for another round of slaughter. This reversal was not a confirmed swing low because price didn’t close over the 8 ema or 10sma, so it was not as safe of an entry. Cycle count is getting late, and look at the 200sma & the last dcl.
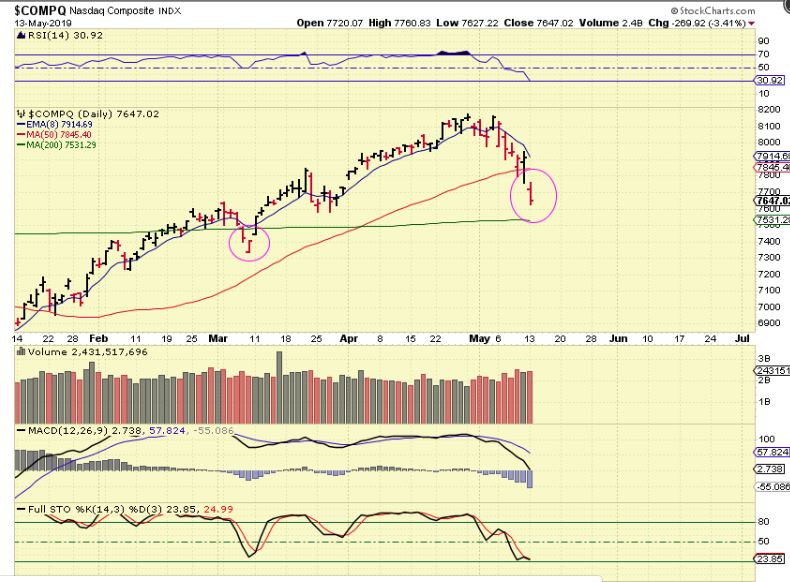
NASDAQ – Notice price at the last dcl and the 200sma. We may see another shake out. Waiting for a close above the 10sma is a safer buy area.
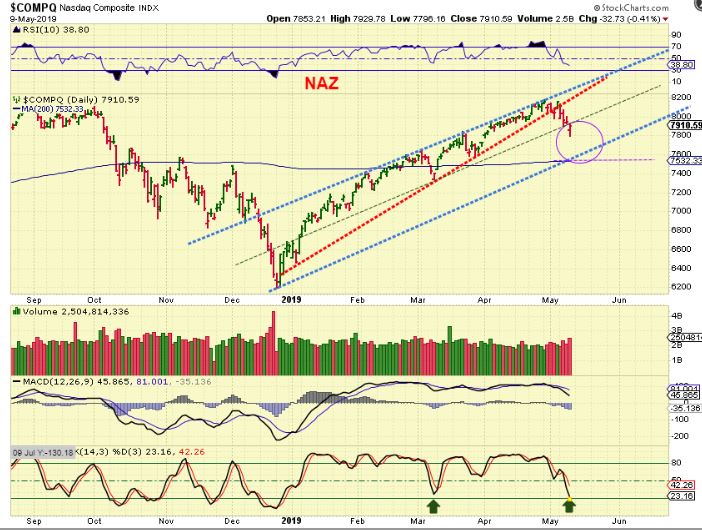
NASDAQ MAY 9th – After the bearish wedge broke down, I drew this as one possibility for price to drop to that 200 sma. It would allow a channel to form.
If the general markets drop Tuesday, they’ll probably be at the 200sma, so we’ll see how price acts in that area.
.
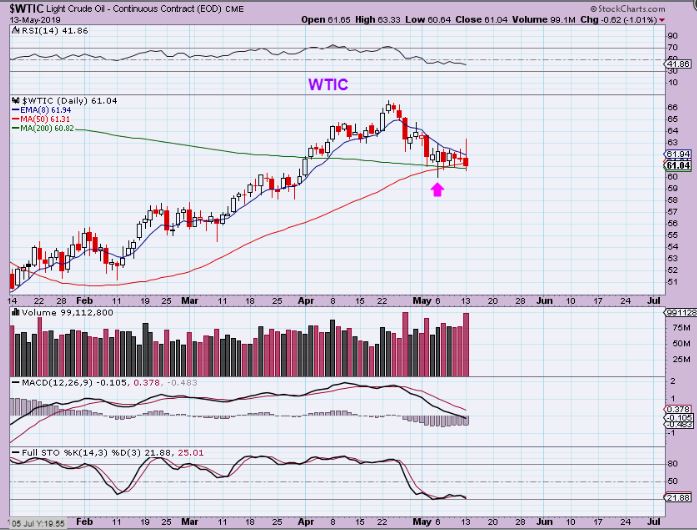
WTIC – Oil is riding along the 200sma, but it did not continue to sell down with the general markets. A DCL is due, and I actually think that it may be in place. A close above the 10sma ( or 8 ema) should be the buy, however…
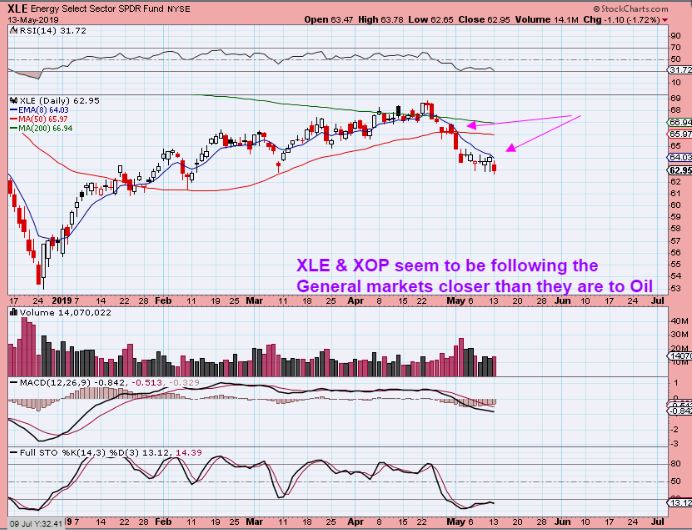
XLE – The Oil / Energy Stocks have followed the markets down, and not Oil. We do not have a close above the 10sma on the XLE, XOP, or OIH, and the OIH is ugly. If you are looking at the Energy area, you may need to wait until the price closes above the 10sma .
.
PRECIOUS METALS
.’
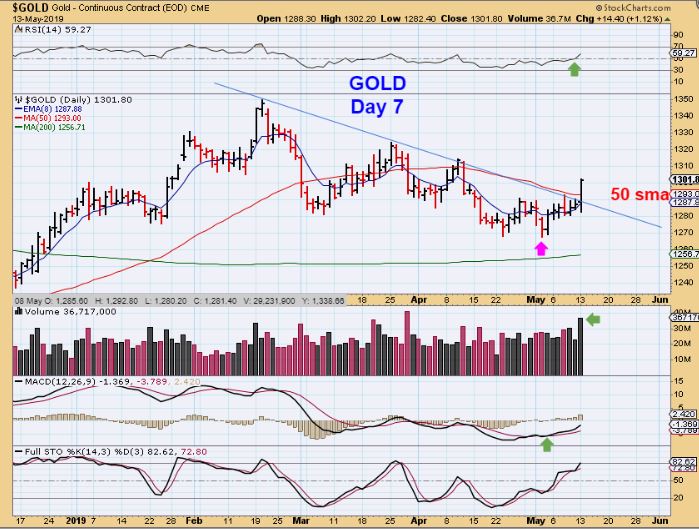
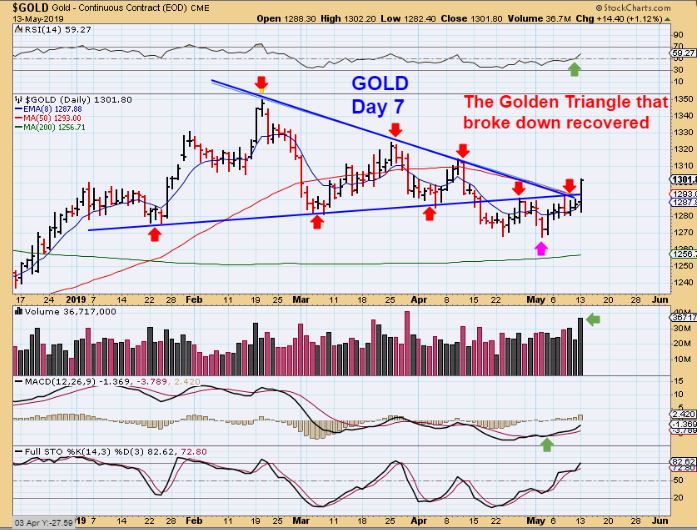
GOLD – Gold had a swing low in place and has held the 10sma, while pushing on the 50sma. There was a chance that it would just drop quickly, but instead it surged higher on day 7, breaking the 50sma and down trend line. WHEN A DOWN TREND LINE IS BROKEN this late in an Intermediate Cycle, it usually indicates that an ICL is in place. Great volume too.
GOLD APRIL 11 – You may recall back in April that GOLD was forming a triangle, pointed out here. They can have a false break out, but you can’t really tell until time passes. Well, this triangle obviously broke down, but…
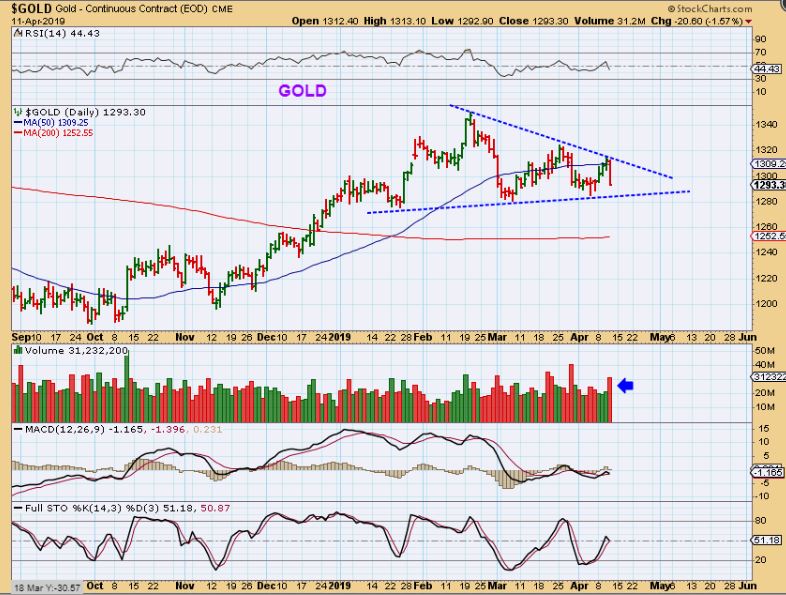
GOLD TRIANGLE – Golds triangle broke down, back tested the triangle, and NOW has recovered. THAT is a low risk buy, because your stop can be placed below the Apex and it should not be broken.
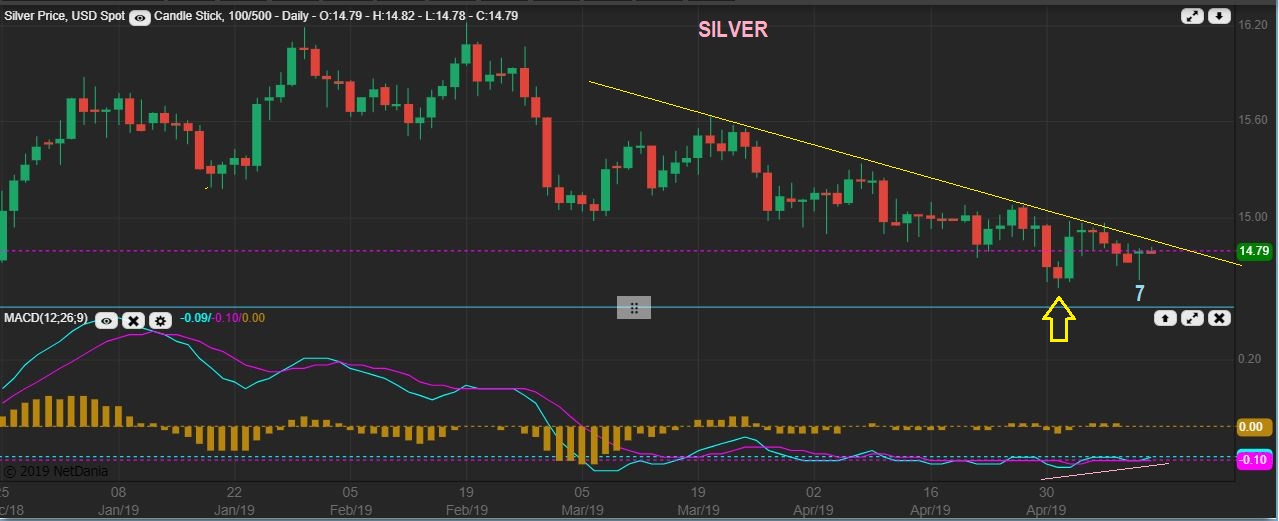
SILVER – Silver is lagging and this is causing many concern. When Gold acts bullishly and Silver or the Miners lag behind, many do not believe that the move can be trustworthy. Miners usually do lead Gold, so I do get emails asking me to address Silvers lack luster day. I will address this later in the report.
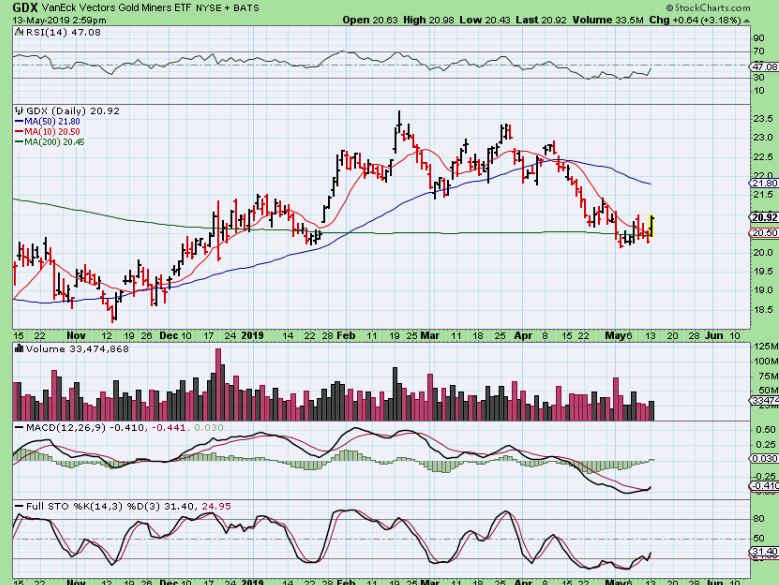
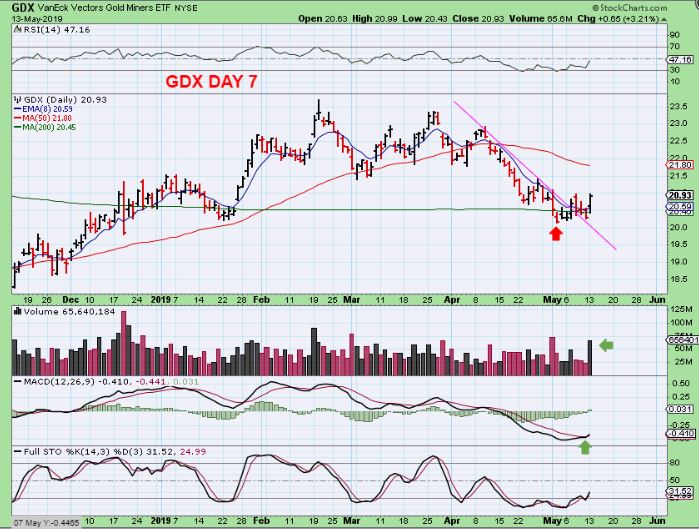
GDX – This is GDX on day 7 and this is a very encouraging follow through day, closing above the 10sma. I wanted to see this on Monday , because…
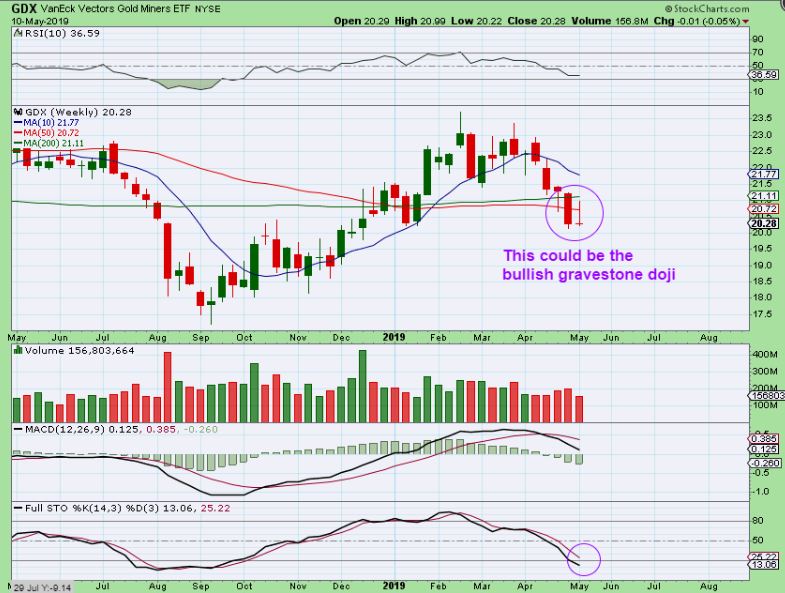
I HAD THIS IN THE WEEKEND REPORT : A GRAVESTONE DOJI – The 2 candles on the right are 2 that I have pointed out many times, and it is often a ‘bearish looking candle’. It often is NOT bearish. After a sell down, it closes at the lows, but it is quite often actually bullish.
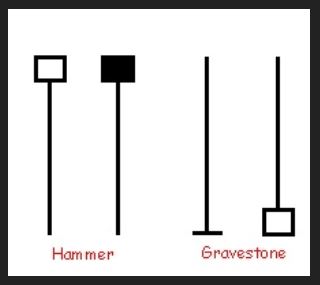
FROM THE WEEKEND REPORT : GDX WEEKLY – Fridays sell off caused a Gravestone Doji. So this makes things a bit more interesting heading into next week, right?
GDX – So Mondays day 7 follow through out of this swing low is encouraging. GDX recovered the 200sma, broke the down trend, and had a solid day of gains with volume. We now have a bullish MACD cross too, and this is still oversold. This confirms the Buy.
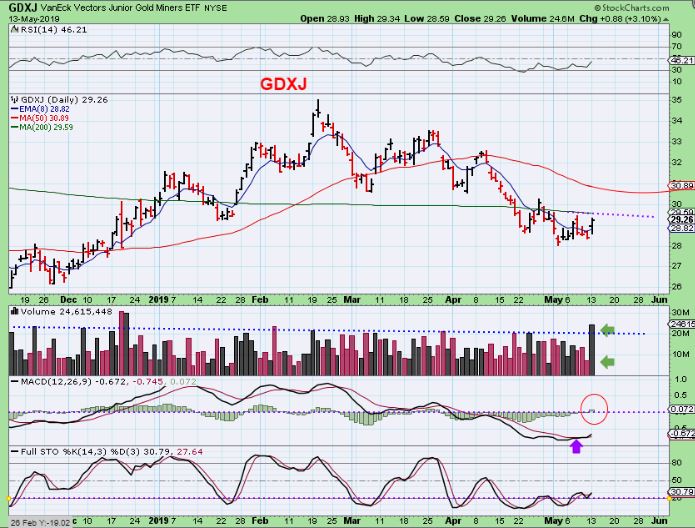
GDXJ – GDXJ is progressing too, but it does still need to push higher to regain the 200sma. Volume was the highest it has been in 5 months as it recovered the 10sma.
.
The start of the week has been encouraging for the Precious Metals and Bitcoin ( and our Blockchain trades), but the markets continued to sell down sharply. I do not expect the selling to last very much longer, but it is easy to see why patience pays off. Waiting for a confirmed swing low usually invites follow through buyers to jump in and shorts to cover. A close above the 10sma and a break of the down trend line is the best form of confirmation.
.
Below the report, I want to discuss the lag in Silver vs Golds surge higher, and I will also post some charts of Miners to discuss various things to look for. It would be nice to get some follow through again with the miners, but if we get a nice low volume pull back, it may offer some lower price entries too.
.
Enjoy your Tuesday trading!
.
~ALEX
.
I have pointed this out in past reports, but it is worth repeating.
.
GOLD DEC 2015 ICL – Please notice that-
1. GOLD PUT IN AN ICL on DEC 3. Also notice that
2. Gold started to really run higher in early January and mid January.
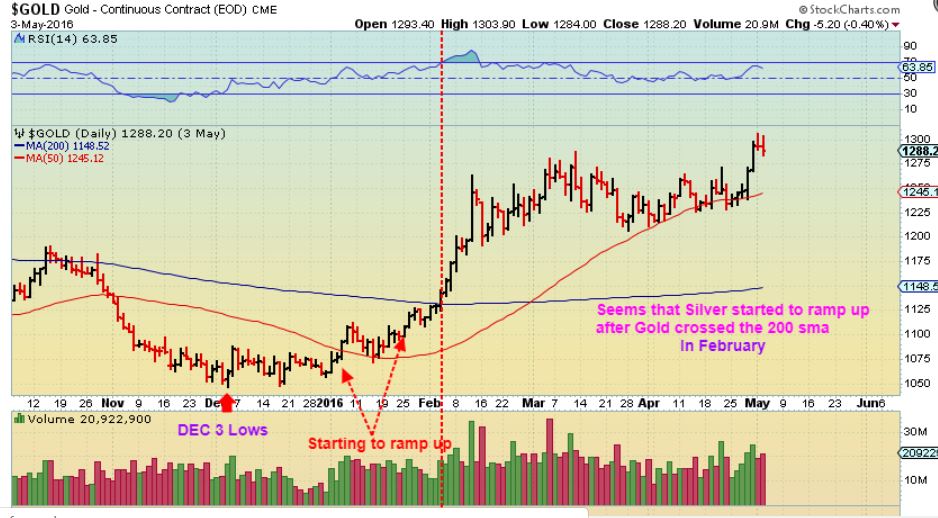
SILVER DEC 2015 ICL – Notice that…
1. Silver put in an ICL on Dec 14 ( that is 2 weeks after Golds Dec 3 ICL).
2. Silver didn’t start to ramp up higher until February (Weeks after Gold did).
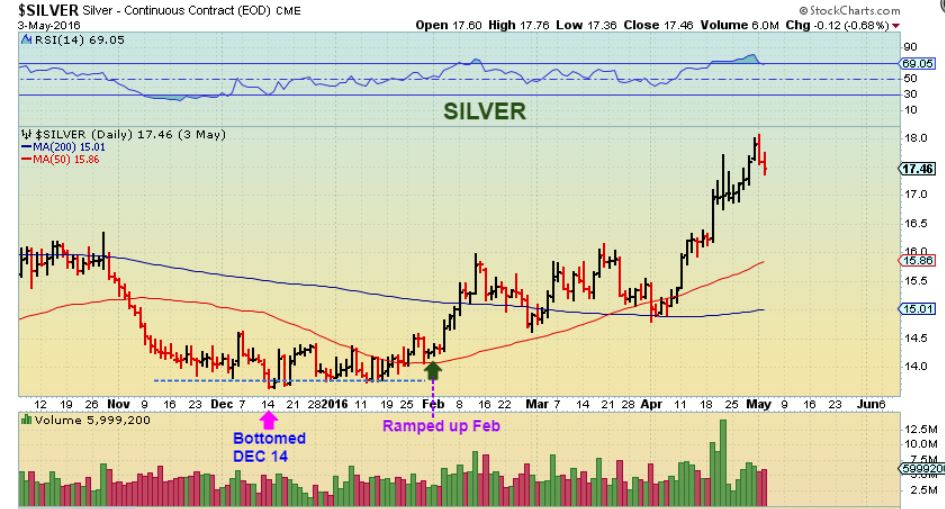
SO THIS SHOWS THAT GOLD CAN BOTTOM FIRST, AND START TO RUN HIGHER BEFORE SILVER CATCHES UP. IN OTHER WORDS, SILVER CAN LAG GOLD AND THE ICL CAN STILL BE IN PLACE.
.
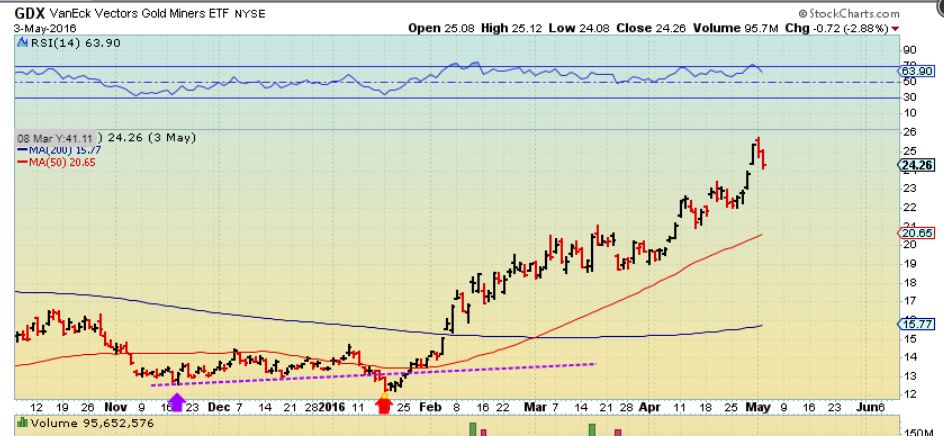
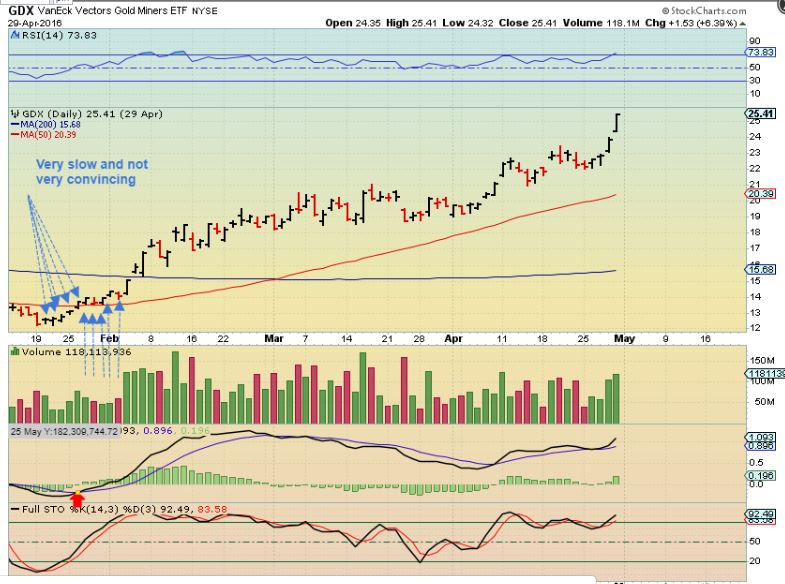
GDX JAN 2016 ICL – As for Miners in 2016? We all know that Miners did a shake out before the massive run higher, but it was a quick slam down and recovery. At Chartfreak, we rode this run higher, and the one that is coming up could be as strong as this one.
GDX MARCH 28_ I have been posting this chart and others like it for weeks. I am thinking that the run out of these lows could do what that 2016 Run in Miners did, when many of them doubled, tripled, and ran up 100’s of %-Points. We could be at those lows now.

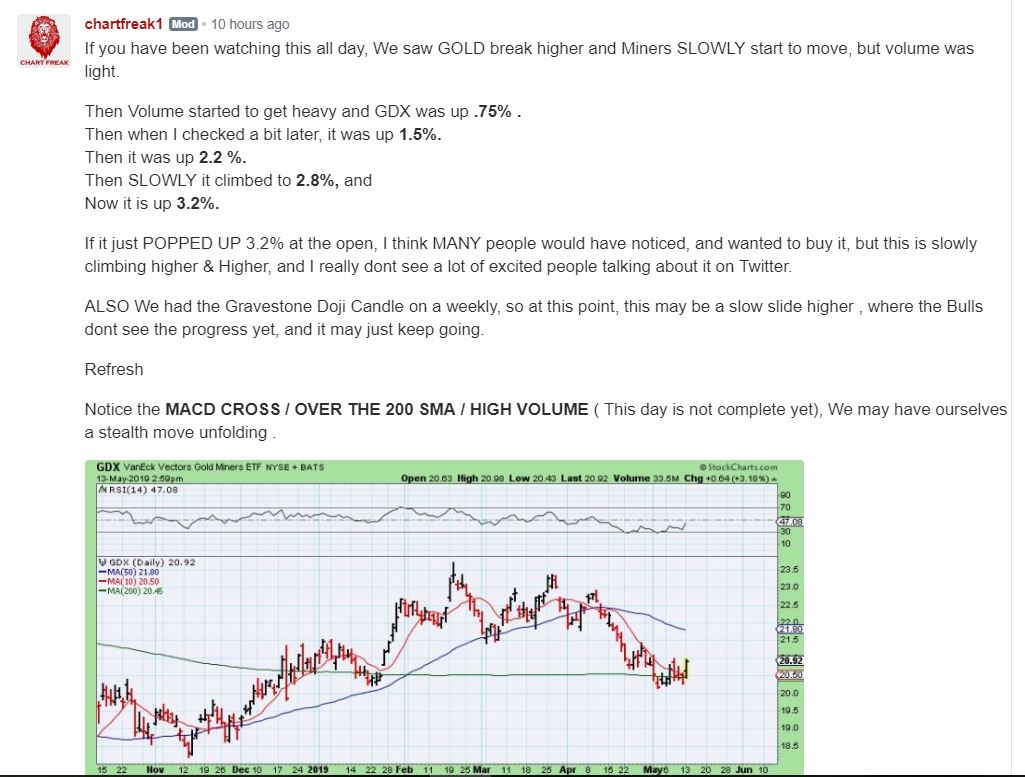
( Click to enlarge if necessary) As the final hr of trading started on Monday, I wrote this in the live trading chat section. People were discussing that Miners seemed to be slow moving, but it ended up being a steady climb higher…
GDX JAN 2016 ICL – Look how slow that 2016 climb started. many of us remember how solid the gains were, so we feel that it just ran straight up, but this started slow and steady and left MANY behind because of that.
.
We have been discussing Miners over the past couple of weeks, but let’s take a look at a few more charts, since we are seeing signs of a bottoming process here.
.
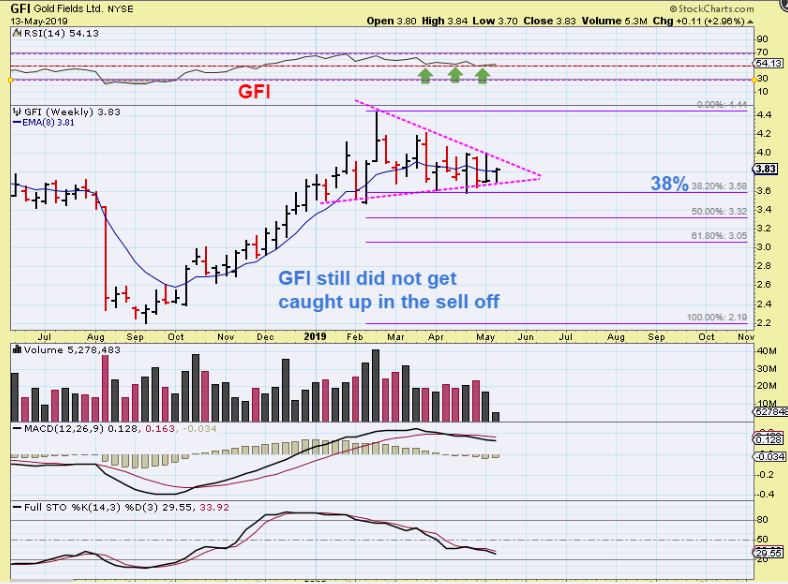
GFI WEEKLY – A few weeks ago I pointed out that GFI was strong and not breaking down with Gold. It was even forming a triangle. Did it eventually break down?

GFI WEEKLY – It is still forming that triangle, it did not break down, and it only pulled back 38% of the last run. THAT is a strong stock .
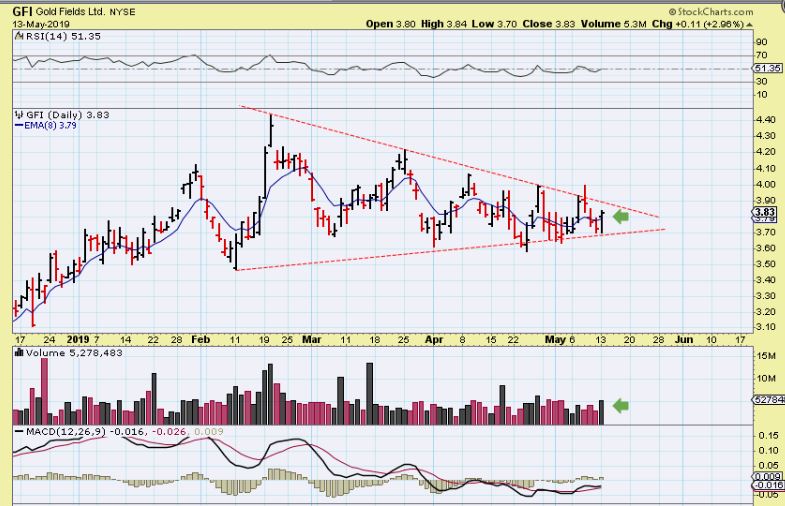
GFI DAILY – The daily is inside of a triangle and could break out if this is the ICL, so you may want to buy this with a tight stop, or buy a break out.
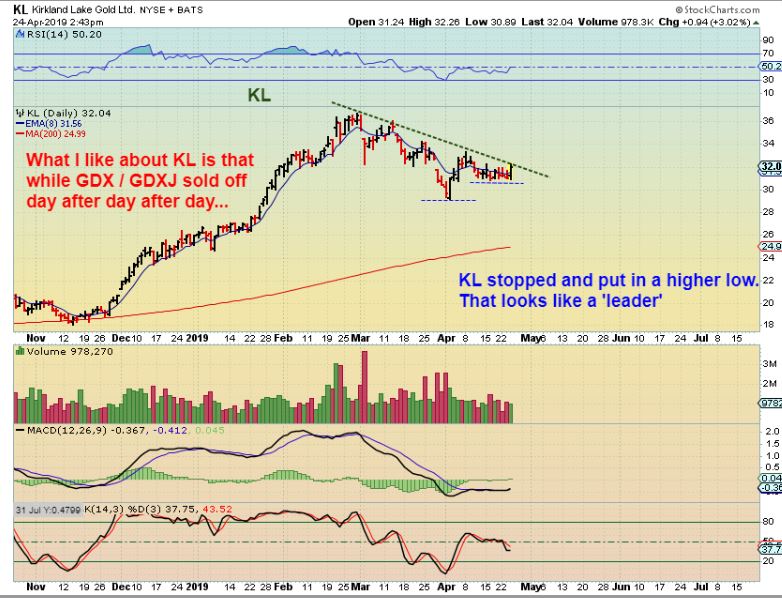
KL APRIL 24 – I was pointing out that KL was a leader. As gold, SIlver, and GDX sold off to new lows – KL put in a higher low. A break above this line is a buy.
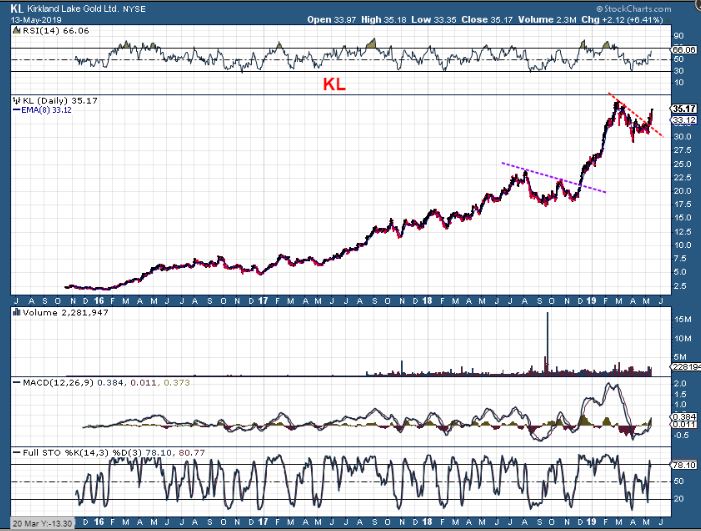
KL – What a strong Miner. It has only had a couple of Big sell offs, but those are buying opportunities in a stock like this.
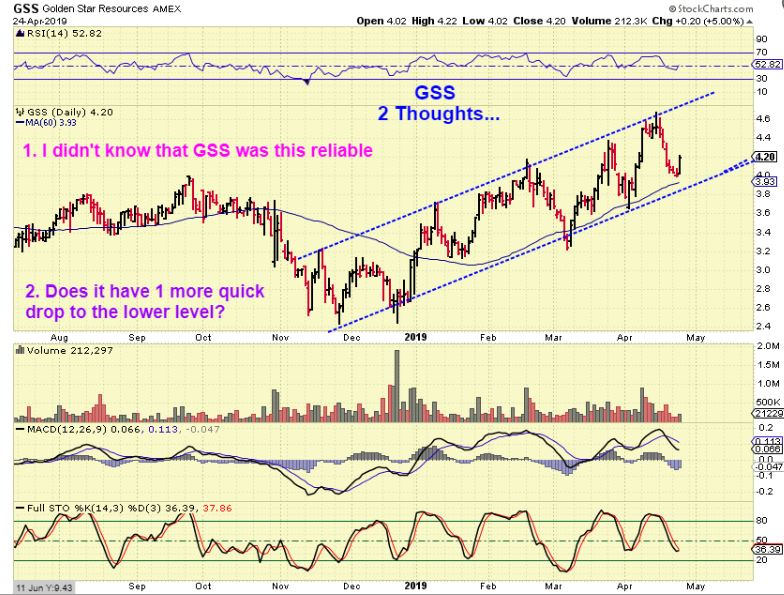
GSS ON APRIL 24 – Here I pointed out how strong GSS has been, I did say that it may have 1 more drop to the 50sma & maybe even a bit Lower to this lower trend line.
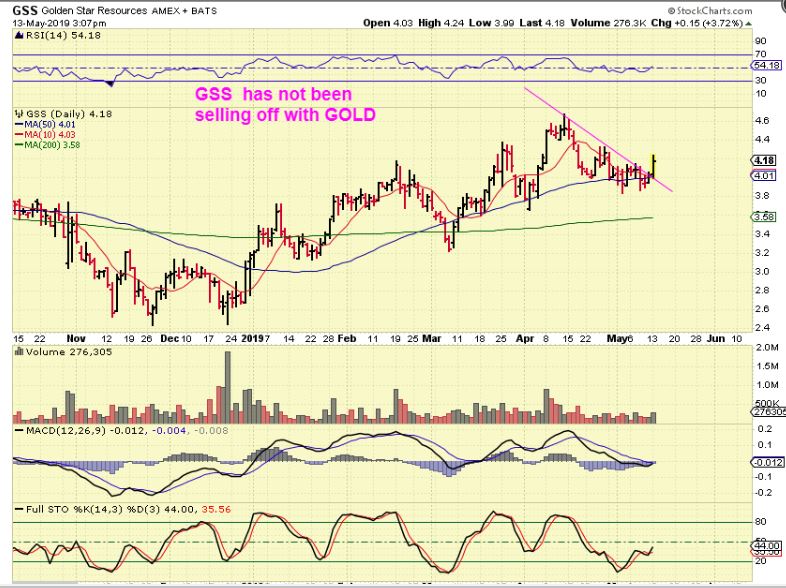
GSS – It just made that 1 quick drop just below the 50sma and has now turned higher and broke above the down trend line. I feel that GSS is a buy.
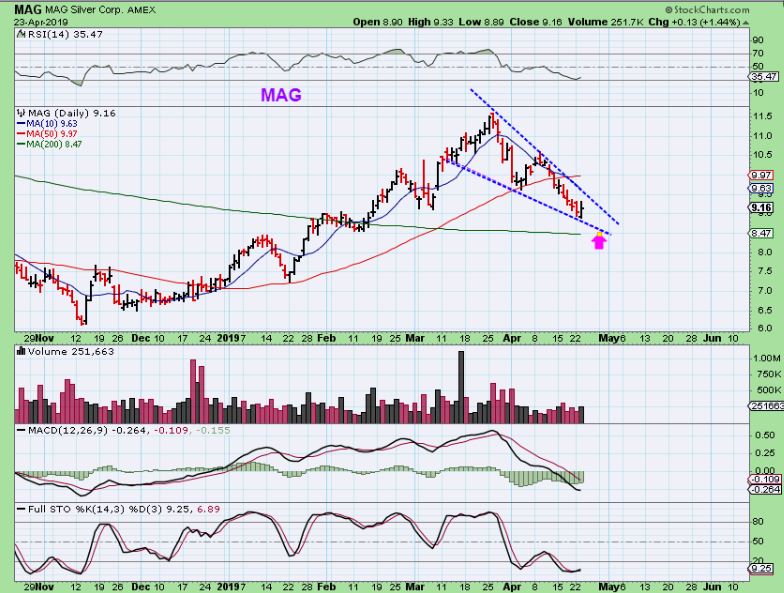
MAG – MAG has been a strong Silver stock and on April 23rd I pointed out the Bullish ascending wedge that it was forming. MAG was $9.16
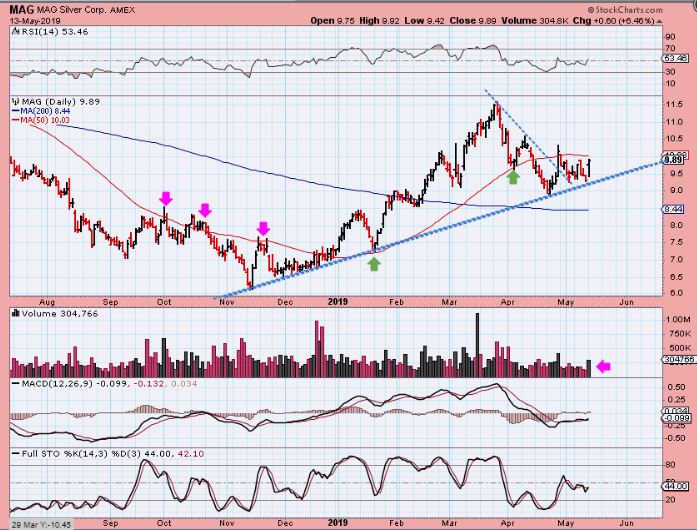
MAG – The downtrend is broken and MAG is now at $9.89. It has held up above the lower trend line in Blue. This is a buy with a stop under that blue line. I would have thought that it could tag the 200sma, but it held up so far.
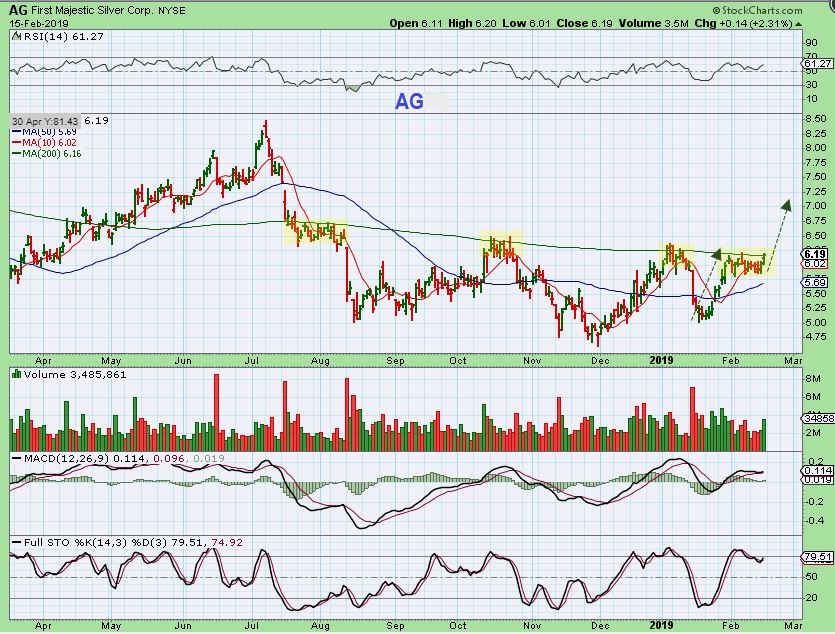
AG – Way back in February AG was pushing on resistance and could be bought here.
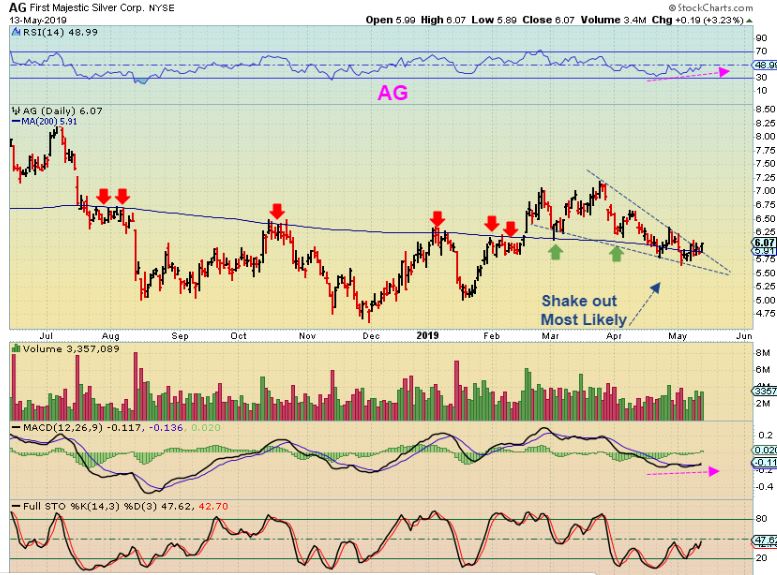
AG – Since that point, it rallied, but then broke down under that 200 sma again. It is still holding up well and has now formed a bullish wedge and on Monday it broke out and also moved back up over that 200sma. I think AG will do very well once things get running higher.
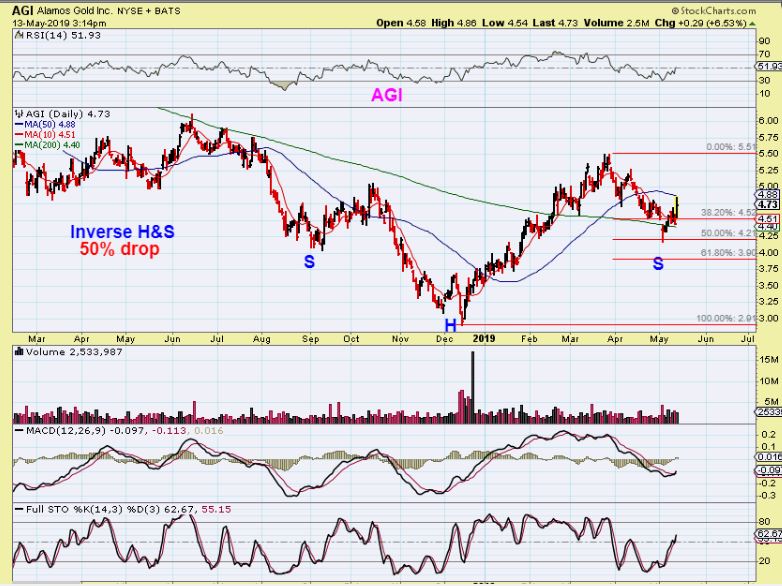
AGI – Notice that AGI only pulled back about 50% of the last run. That is considered Bullish coming out of an ICL. It has also found support around the 200sma. This could be bought in this area with a stop under recent lows.
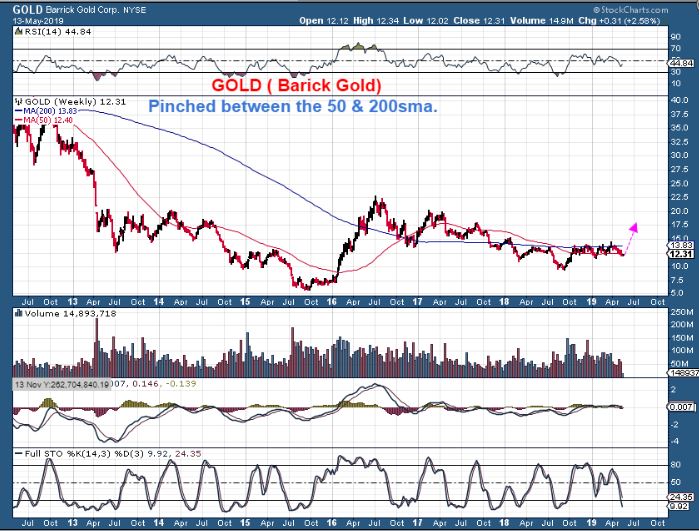
BARRICK GOLD WEEKLY – The weekly chart of Barrick is pinched between the 50 & 200 ma. When the next run in Miners takes place, Barrick has a lot of potential and you would think that Funds would be interested in this one. Someday we will look back and probably wish we bought it at $12.
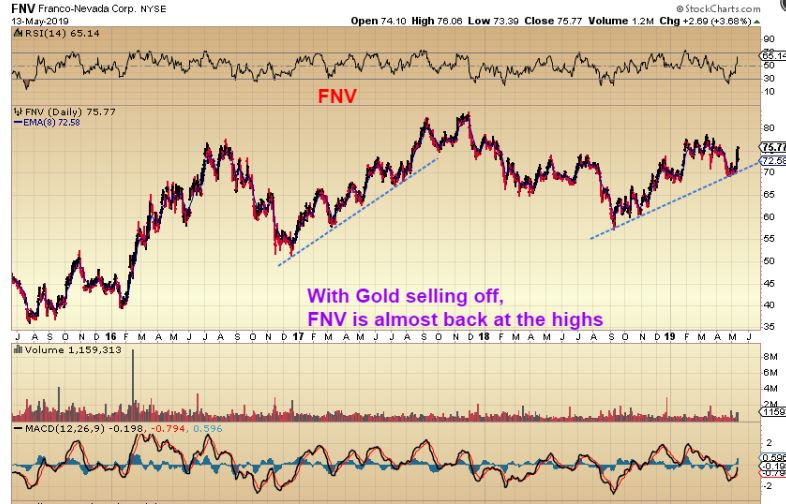
FNV – FNV has been another solid performer. With the run out of the last ICL (Lows), it has almost reach all time highs and once it breaks from all time highs, it should run freely. Also this pull back since the highs has been fairly tame.
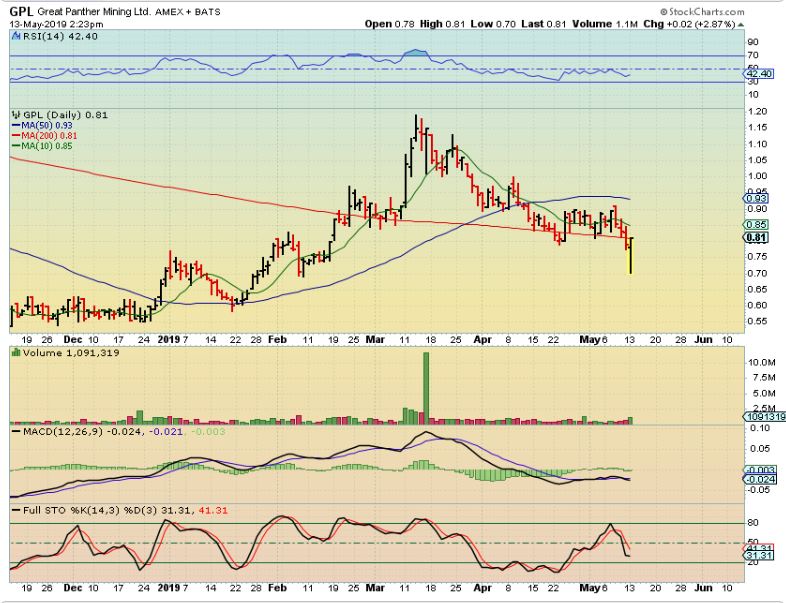
GPL – GPL sold off yesterday after losing the 200sma, but it then put in a solid reversal. This looks like a pretty convincing shake out and recovery. I captured this chart Midday, and it actually closed even higher at 83 cents.
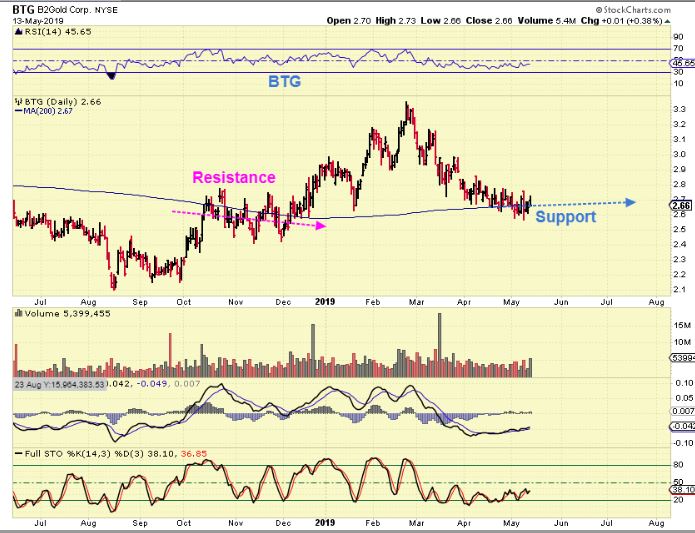
BTG – BTG has been VERY CHOPPY, but it also reached support and has been struggling to hold on during the recent sell off. This could break higher & run too, if the Precious Metals sector has put in an ICL.
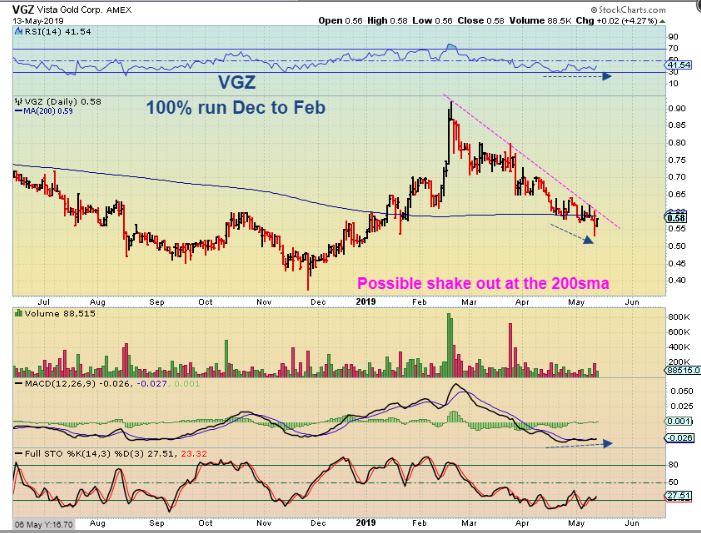
VGZ – VGZ actually made a 100% run since the November lows, and has dropped back to the support of the 200sma. A break of the down trend could be bough with a stop too.