Jan 19th Big Picture – Is That Etched In Stone?
The Big Picture Outlook is based on current information and the formation of current set ups and what they seem to indicate going forward, but they cannot be considered ‘Etched In Stone’. They give us a solid idea of what we may expect in the upcoming weeks or even months, and that helps us to move forward with our trade ideas. We have currently taken some trades at Major bottoms (ICLs) in the Equity and Energy Sectors, and we have used the Big Picture set up to have confidence in those trades.
So far, everything is right on track for what that Big Picture outlook here at Chartfreak has been for the past few months. The current trades are playing out well, but as time goes on, we need to stay alert to those big Picture set ups too. Things can gradually change over time, and adjustments are also made if necessary. For example, some may raise stops, others may decide to cut leverage, or even add to current positions , depending on how things are playing out. My admonition remains that as time goes forward, we need to stay current, stay flexible or adaptable, and Stay Frosty! Yes, we want to continue to examine the markets as we watch and see how things unfold.
.
That said, Let’s examine our current Big Picture Market set ups. I am noting one change in the Precious Metals sector that needs to be mentioned and monitored going forward.
.
I said this in Friday Mornings report:
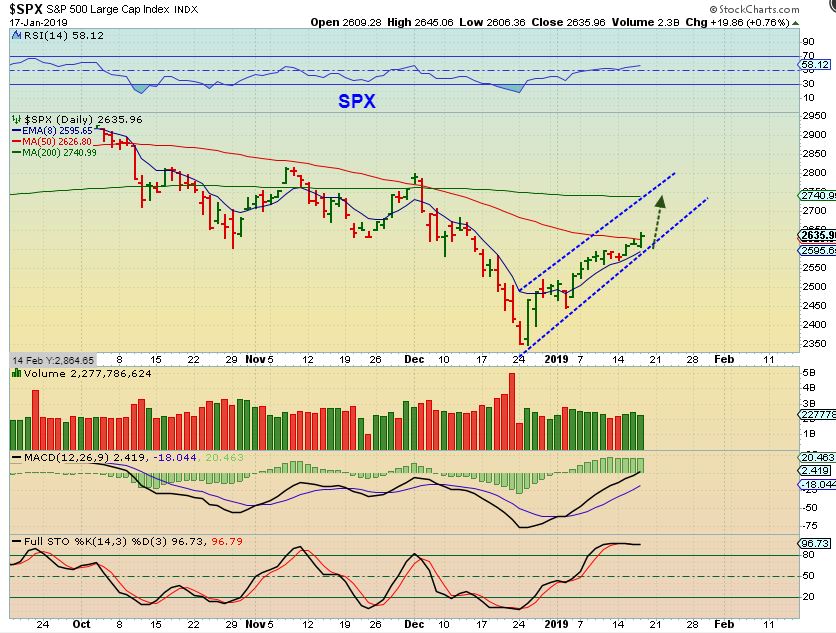
SPX – After about only 4 days sideways, The SPX , DJIA , NASDAQ , etc are slowly pushing above the 50sma. It does look like the SPX held the 8 ema, and wants higher price, so that may become the lower trend line. The 200 sma is the next likely target.
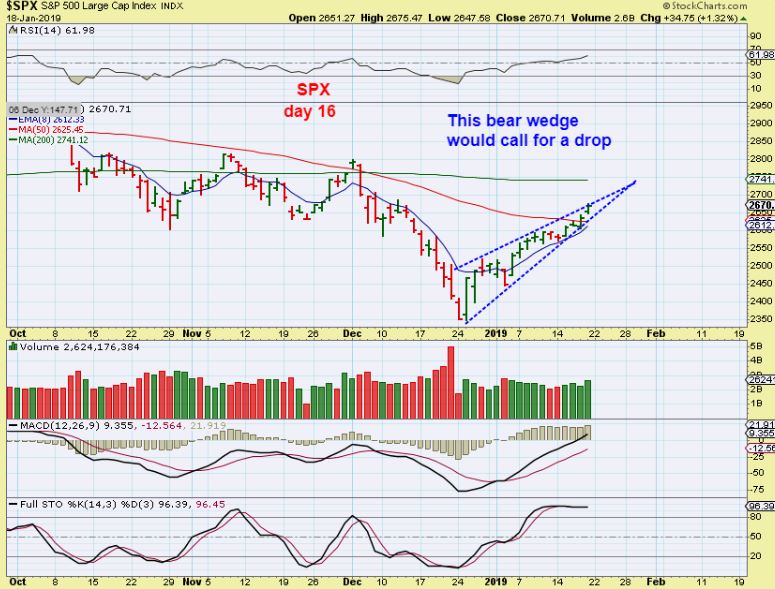
SPX Daily 1 – I also noted a rising wedge that might cause a pull back at the 50sma, but here we see here that on Friday it did break above the 50sma, and a run to the 200sma is possible …
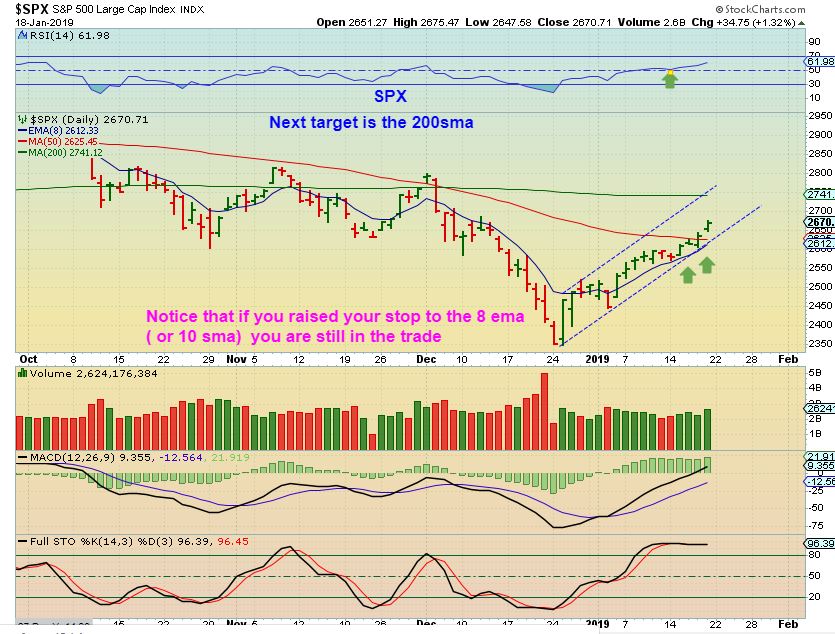
SPX Daily 2 – Since Friday saw the markets push higher, that wedge may become a channel higher. Read the chart.
SPX – The BIG PICTURE has been drawn this way for months now. As time pushes forward, I am thinking of a possible back test of the trend line break down & then Markets roll over. EVEN THIS IS NOT ETCHED IN STONE, but so far seems most likely to me.
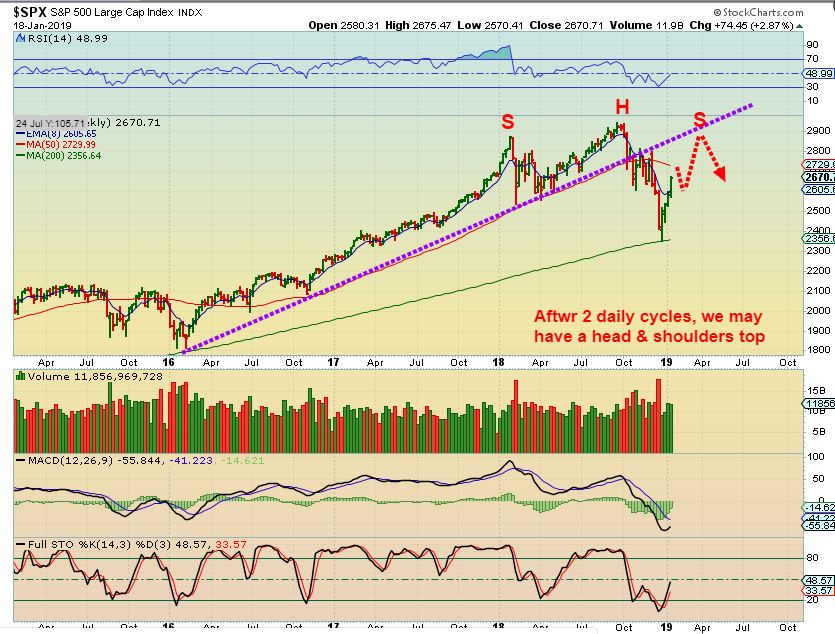
The above ‘peak’ would be after a 2nd daily cycle peak. So all along I have said that we should get a bullish move out of the ICL in the first daily cycle, and the 2nd daily cycle is the one that will give us clues as to whether we top & drop , or has the Bull been corrected and continues upward. I feel that a renewed Bull is least likely, But I have heard that the FED may not raise interest rates for a while. Could that prop up the markets? Possibly. We will see. Stay Frosty in the 2nd daily cycle. so…
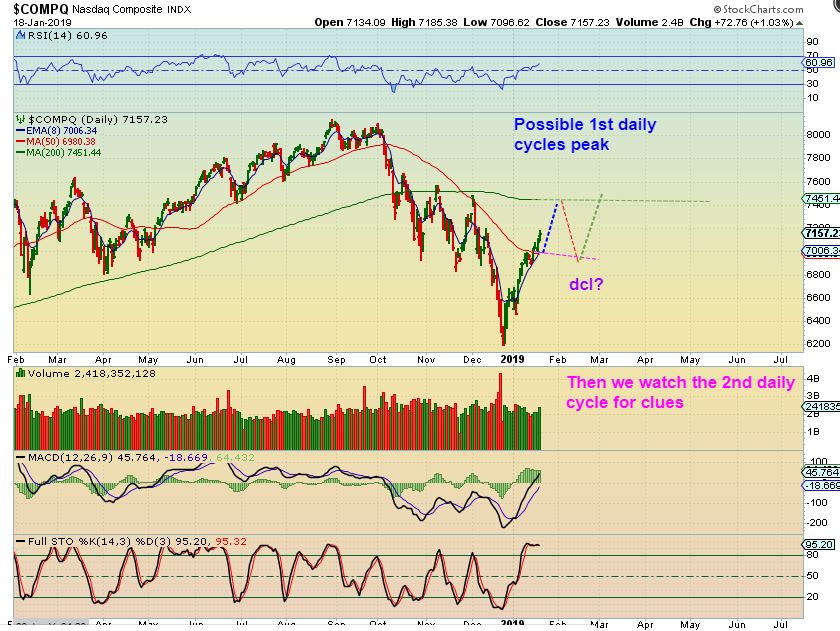
NASDAQ DAILY – This can be the path of the first daily cycle. Then the 2nd will be able to tell the story of weakness or strength.
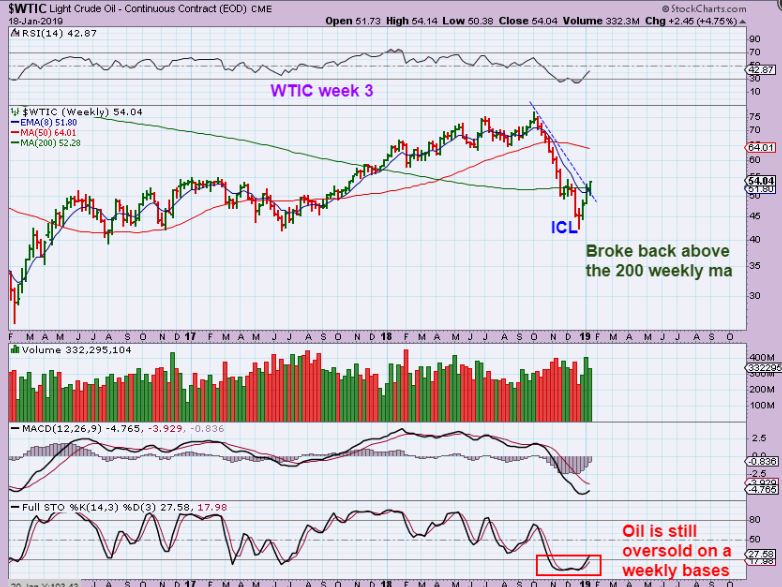
WTIC WEEKLY – 3 straight weeks higher. It closed above the 200 week ma., and…
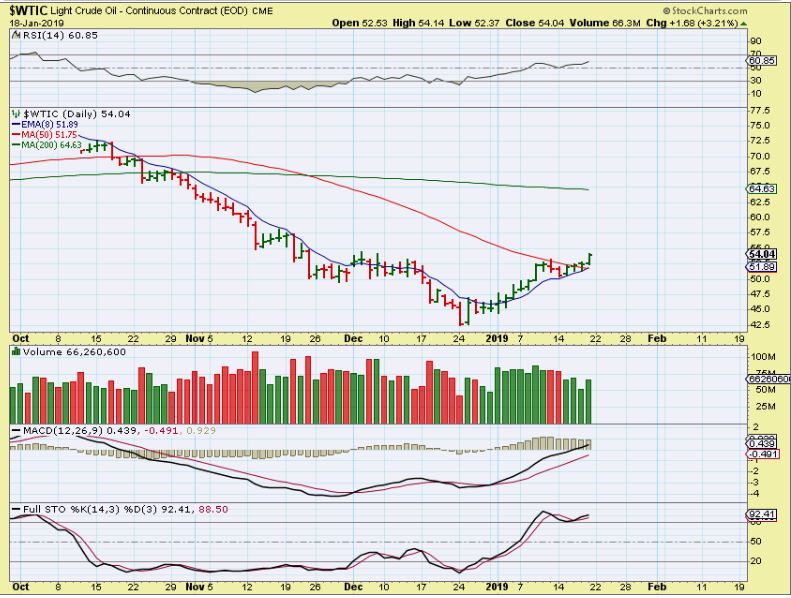
WTIC DAILY – And that is a close above the 50sma daily, so Oil looks like it wants higher prices, and stops can be raised to the 50sma. OIL held the 8 ema.
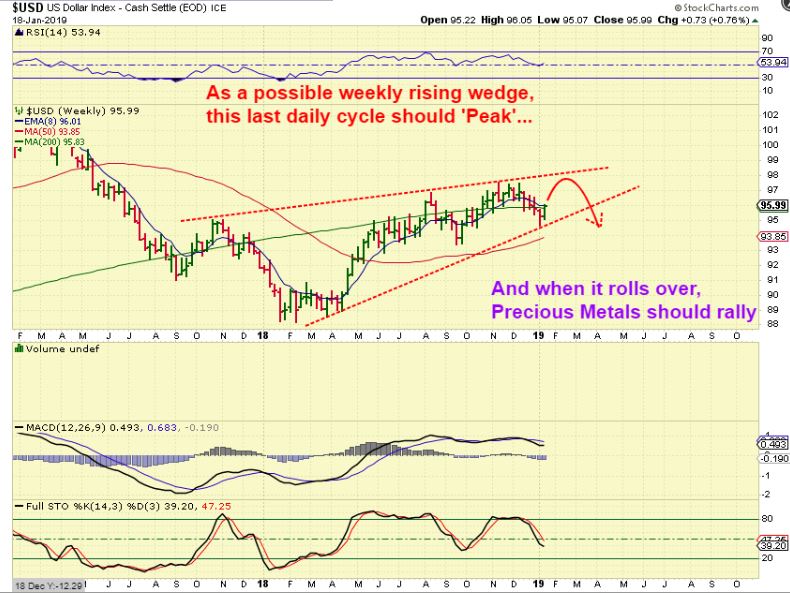
USD – The USD has a weekly swing low, it is moving higher in this daily cycle and Gold and Miners are rolling over. Watch for the USD to roll over again as shown here ( or not). Read the chart.
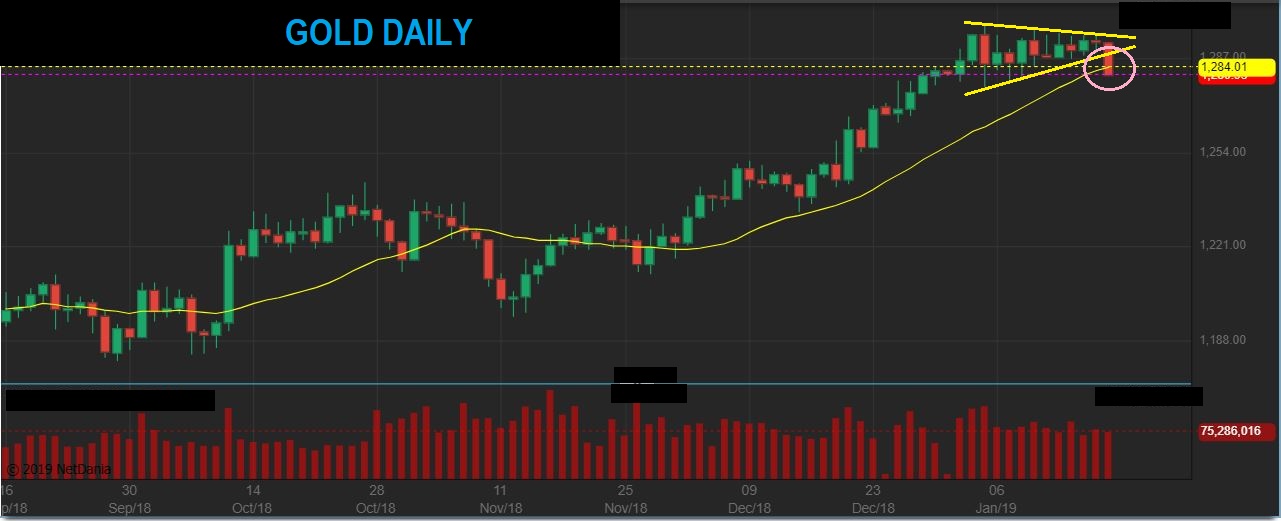
GOLD DAILY – The USD popped and Gold FINALLY dropped. It looked strong and formed a Bull Flag, but it is time for a dcl, maybe ICL now.
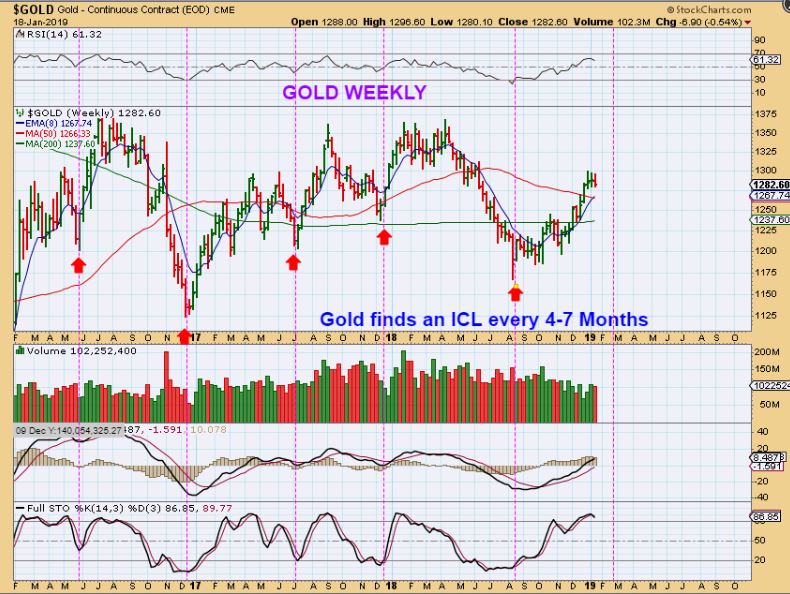
GOLD WEEKLY #1– ICLs come due USUALLY 5 or 6 months apart, but we have also seen them at 4 & 7 months. Let’s just say “Roughly every 6 months or 1/2 year to make it easy. The last one for Gold was August, which is 5 months ago. Gold could drop into the 6th month.
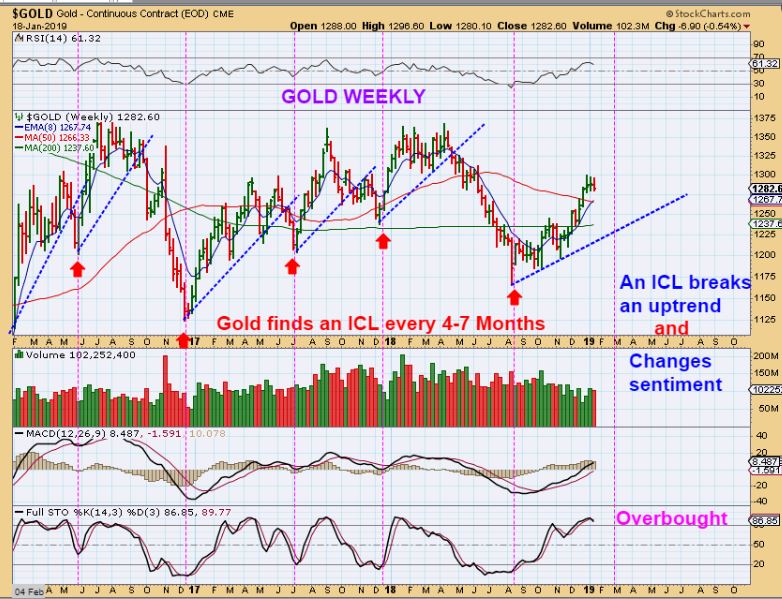
GOLD WEEKLY #2– Usually an ICL breaks the blue trend line and gets everyone bearish again. You can see that that kind of a drop would be very unexpected after holding up this well, but we have also seen this before.
GOLD WEEKLY #3– I just want you to Look at past drops into ICLs that broke the blue trend line.
1. Each followed a strong run higher
2. Each seems deeper than many expected.
3. Each sell off lasted a few weeks in time.
4. That means that this is ‘week 1’ of a possible multiple week sold off.
5. We need to let this play out and be patient.
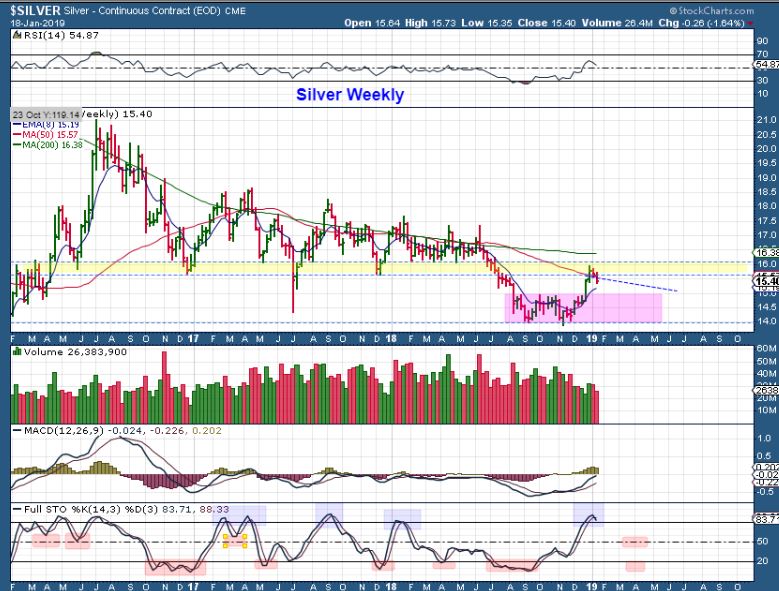
SILVER WEEKLY – Silver Lagged Gold, then Silver shot up quickly. The USD is rising now and Silver is dropping and the weekly chart got very overbought. We need to let it play out, and be patient.
Let me take a minute to say this: As you know, some Miners have really moved bullishly out of the lows. AU, AEM, KL, Etc. I want to watch how THESE pull back now, and I suspect that that will say a lot. Why? Well, to be honest, when I looked at GDX & GDXJ WEEKLY charts this week I was a bit dissapointed…
.
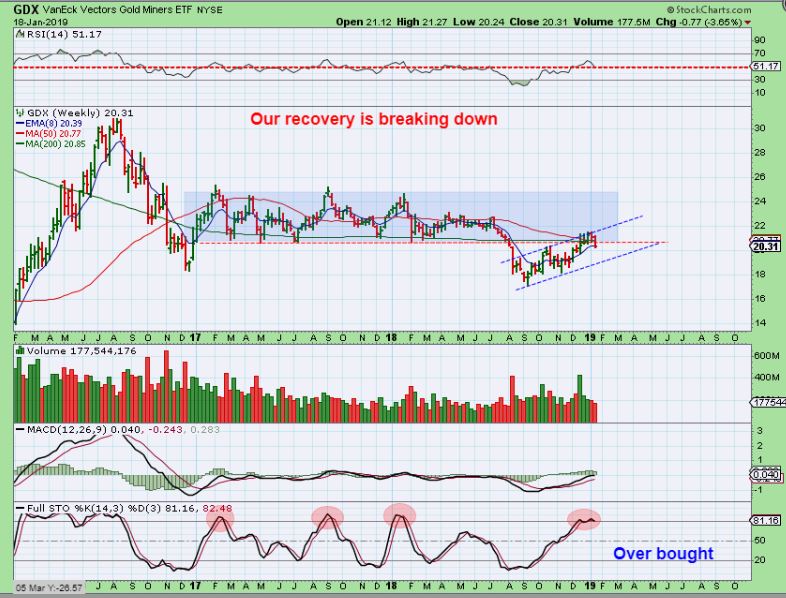
GDX WEEKLY – We recovered from the break down for a couple of weeks and I really wanted to see that recovery hold up. GDX rolled over this week and closed under the weekly moving averages. That is a weekly swing high, and take a look at the weekly stochastics .
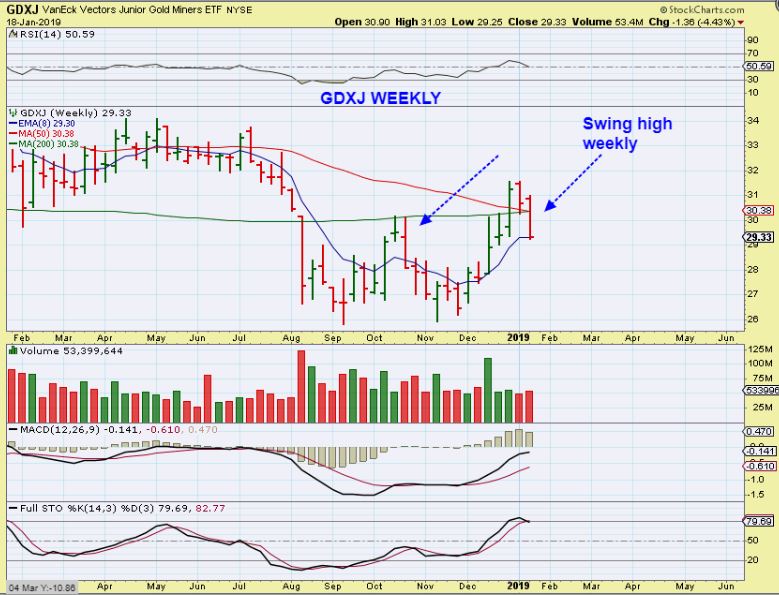
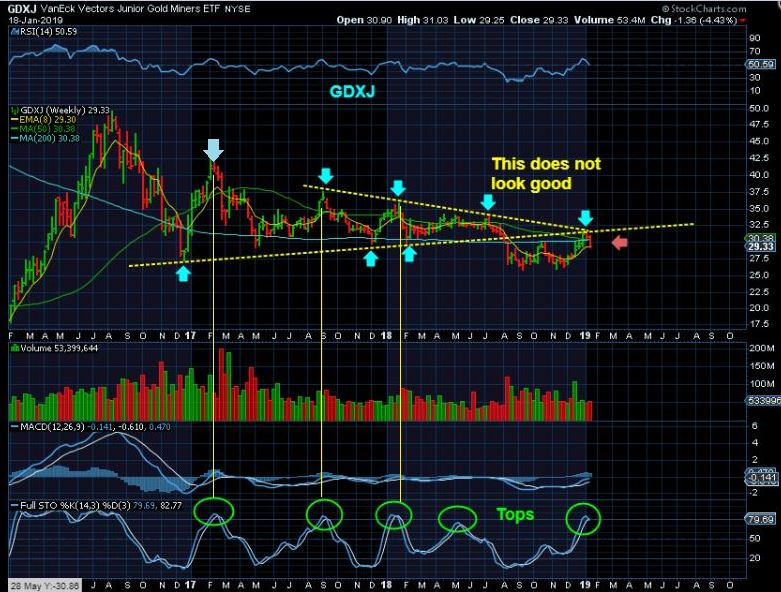
GDXJ WEEKLY CLOSE UP – This week saw the Juniors drop over 4%. We all know how quickly Miners can sell down if they get going too. Let’s look at Big Picture weekly charts…
.
GDXJ WEEKLY #1 of 3 – I don’t like the looks of this chart, because I see a big red candle rejection at the apex. That looks like
1. A break down last July and
2. A back test right now. It may be a temporary rejection, but a rejection none the less.
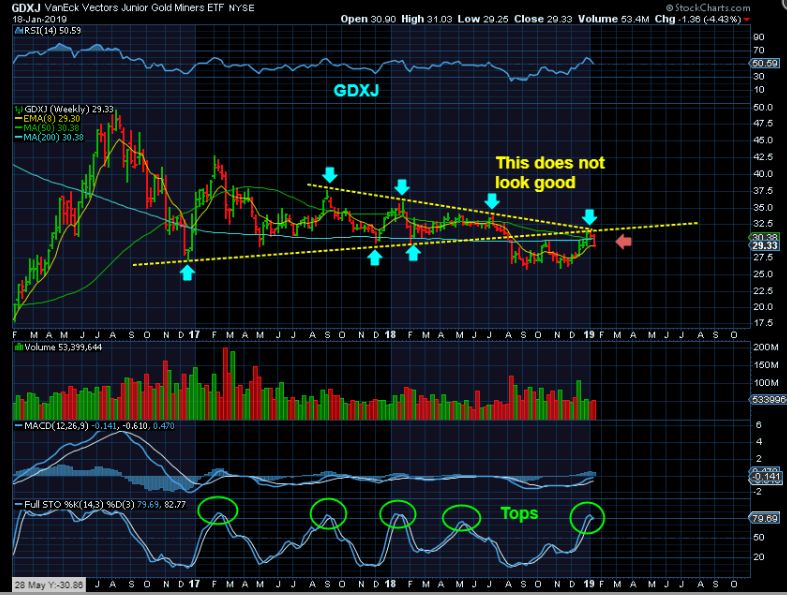
GDXJ WEEKLY #2 of 3 – Look at the stochastics and the alignment of prior tops. In the past, what I see here leads to multi week drops. I WILL NOT BUY THE DIP until we see a sign of strength / reversal.
GDXJ WEEKLY #3 of 3 – The only way to see a bullish view is to look at a Bull run ( like 2016 here). The pull backs were sideways & shallow (and that could happen) and the stochastics just stayed overbought. You can see why we need to watch this play out. 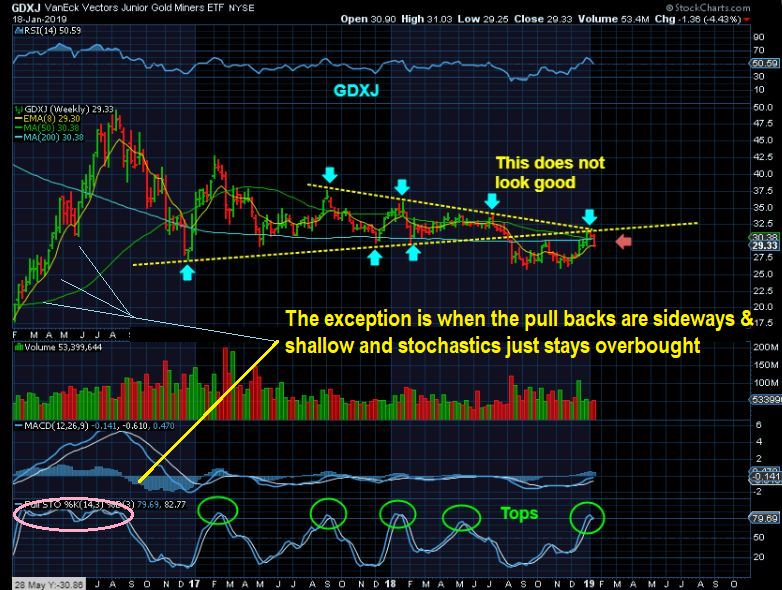
.
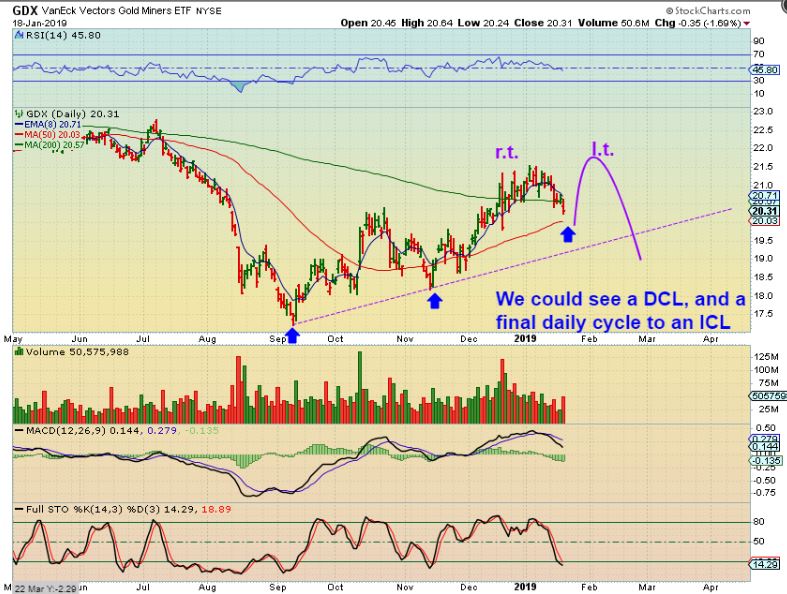
This is a very strong possibility, probably most likely, and still matches the Overbought Weekly charts.
GDX FORMS DAILY CYCLE LOW SOON , THEN BOUNCES into a Left Translated Peak for the final Daily Cycle, and a final drop into Feb for an ICL.
For the Precious Metals sector: At this point, I’d say that the charts indicate that the USD started a bounce and Gold, Silver, and Miners rolled over. Miners took the lead and started dropping early in the week, and Gold just rolled over Friday. Timing for this intermediate cycle count has Gold on the 5th Month and due for a drop to an ICL. As seen above in that GDX daily chart, It may even take another daily cycle to do that. I just want to watch how things play out and gather clues along the way. Some miners may hold up well, others may not. Allowing this sector to show you how it wants to sell off is the safer way to play it. If we see accumulation ( Buyers stepping in on each drop) , that will be a good sign. If Miners just start to accelerate in their selling after a good bounce, it is always best to stand aside and wait for the real low prices- the ICL.
.
I no longer own any miners as of right now, I even sold my AUMN, so let me show you something below after signing off.
.
This has been your Big Picture weekend report. Monday is a holiday in the U.S., I’ll see you Tuesday morning in the comments section.
Enjoy the rest of your weekend!
.
~ALEX
.
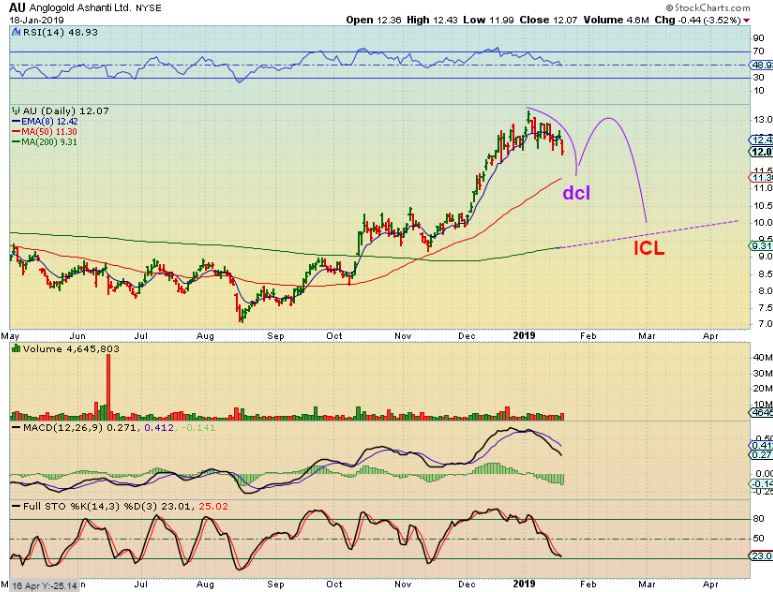
During sell offs to the ICL, a bullish stock may hold up and tend to go sideways, since it is still being accumulated. At times, the sell off really takes hold though, and prices drop further than expected, but they are still within a normal bullish range. Let me just give you a visual of this using 4 charts of AU below.
.
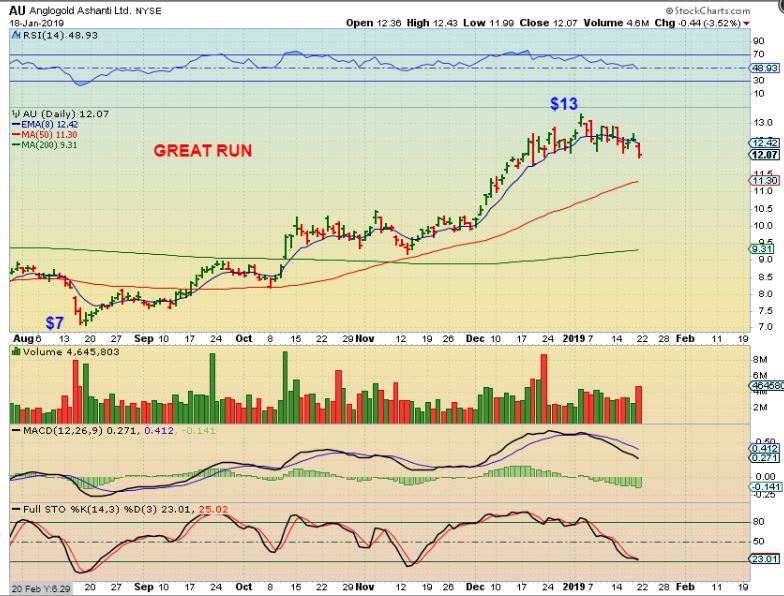
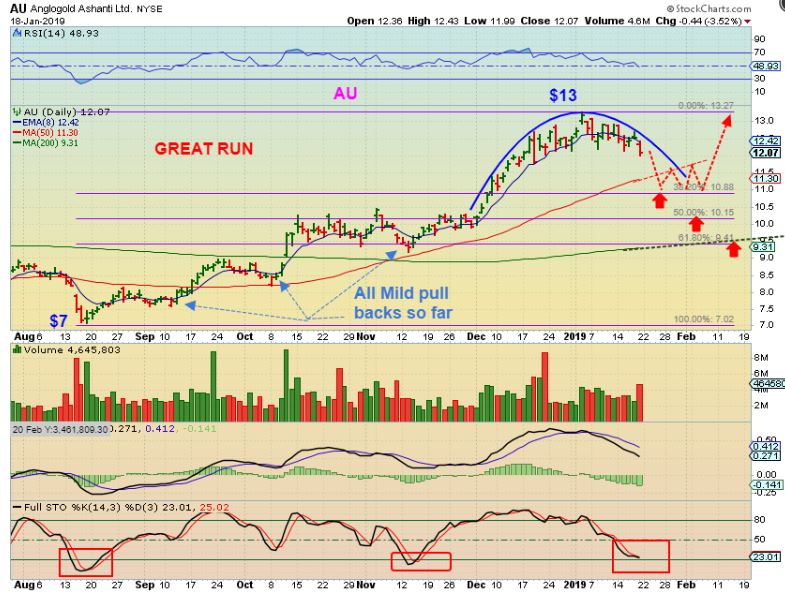
AU #1 – What a great run, almost 100 % off of the August lows. Notice that each pull back has been really mild, in fact, it has been pretty much just sideways chop to support of the 50sma in October & November. Is that where AU will go now?
AU #2 – We see that the top is rounding & rolling over here. Using Fib #’s, we see that the 50 sma, the 200 sma, and 3 other targets are often good areas to watch for a reaction. The 50sma almost lines up with the more bullish 38.2% Fib, and the 200 sma does line up with the deeper 61.8% Fib #. All are acceptable & probable areas of support for a reversal.
AU #3 – I would guess that the timing for the GOLD ICL will affect the depth of the sell off here. For example: If the drop for GOLD is sharp & quick, an ICL could form quickly as AU tags the 38% or 50% higher area, but if the selling is dragged out and it takes a month to get to an ICL for Gold? Then I could see the AU Price sell down to the 61% area / 200 sma as shown.
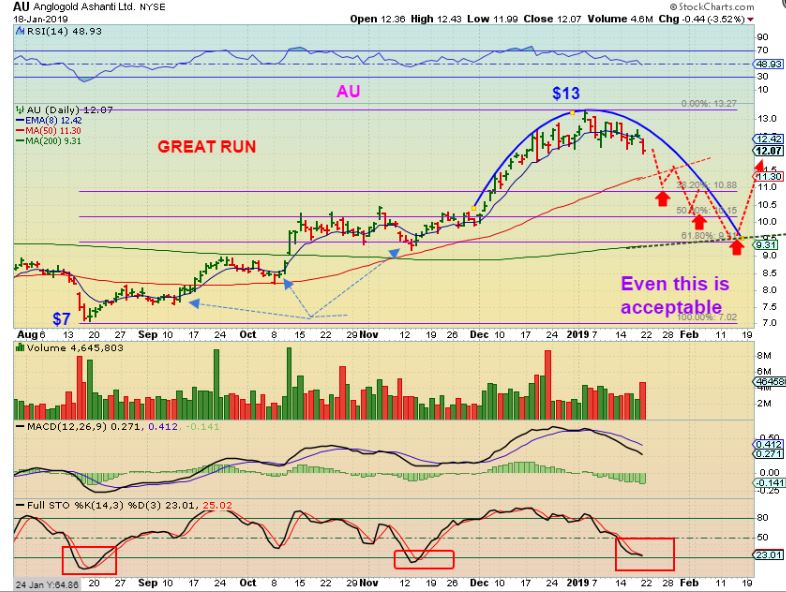
AU #4 – THIS IS ALSO VERY LIKELY, IF WE GET A DCL, A SHORT SHARP BOUNCE, AND THEN ROLL OVER TO THE ICL IN FEB / MARCH. This matches that GDX daily chart at the end of the report.