
Jan 12th Weekend Review
This is the weekend report, where we can monitor the progress that the various sectors of the market have made, and what we may expect going forward. Since I give a more detailed day to day update in the daily reports, I often focus mainly on the Big Picture in the weekend reports by using the weekly or Monthly charts. This week , however, I will start with the daily charts in a couple of the sectors, to include a close up of where we are now, and then we’ll get into our Big Picture Outlook.
.
QQQ Daily – We are pausing at the 50 sma, as expected. Will we go sideways or pull back? It really shouldn’t matter, at day 12, I think that we should still break above the 50sma in the first daily cycle and maybe back test it on the dcl later…
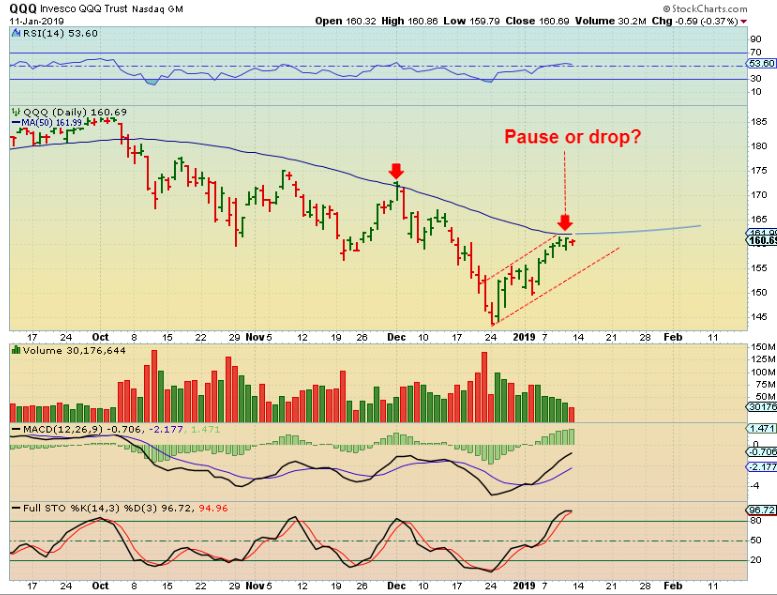
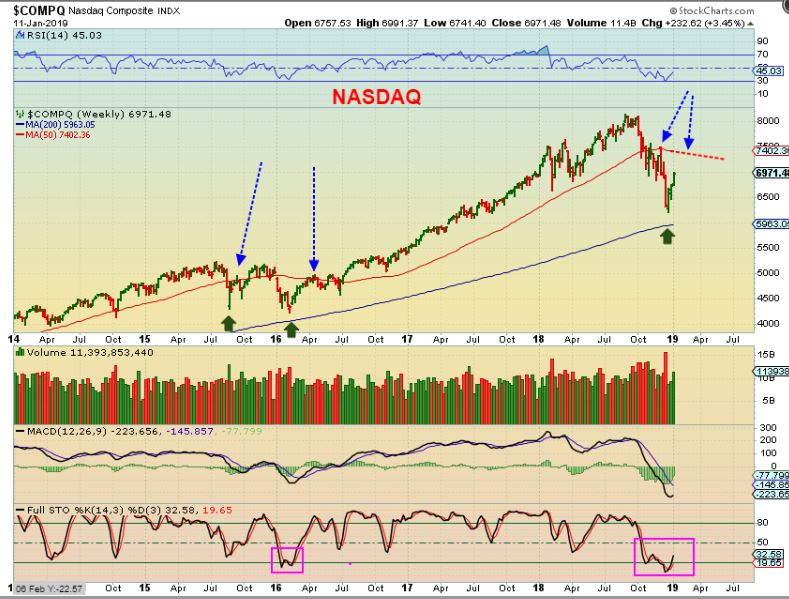
QQQ WEEKLY – This is an area that POSSIBLY may eventually become an important topping point. We are watching this s things unfold. If the FED stops raising rates in early 2019, I wouldn’t rule out that the markets can hang in there a bit longer. FED PROPPED. I still lean toward a H&S top though, with highs in place.
.
My goal for this report is keep the words to a MINIMUM, and let the charts speak for themselves. I should be able to do this if you try to remember all the ideas in past daily reports & weekend reports.
.
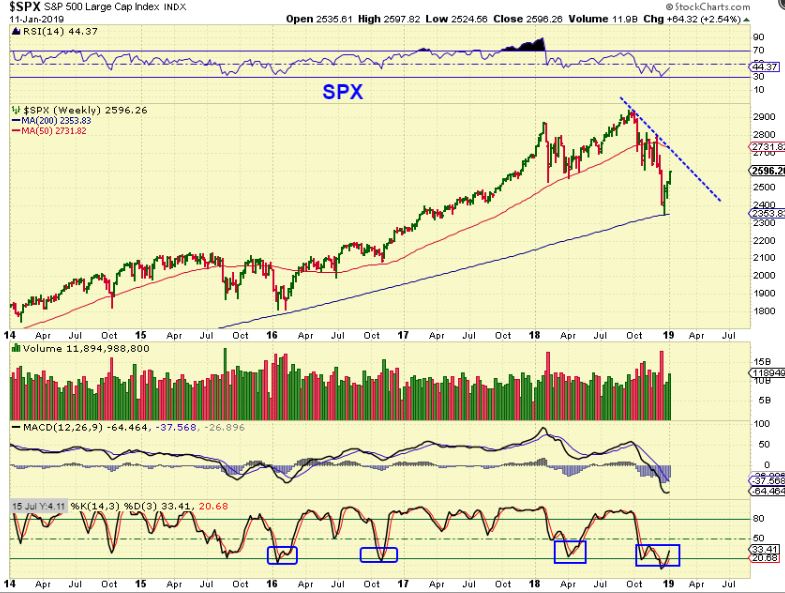
SPX WEEKLY – We caught the lows with that reversal, and so far so good. I am also watching the 50 weekly MA here , over time.
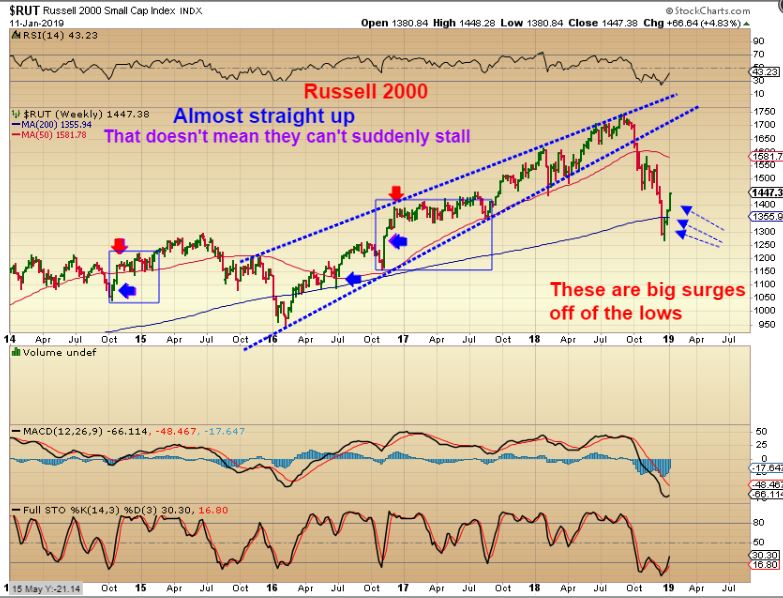
RUT WEEKLY #1 – Yes, the Russell 2000 and other sectors are zooming straight up, see the chart. That can be the result of short covering with buying, it looks extremely bullish, but I just want to point out 1 thing with that…
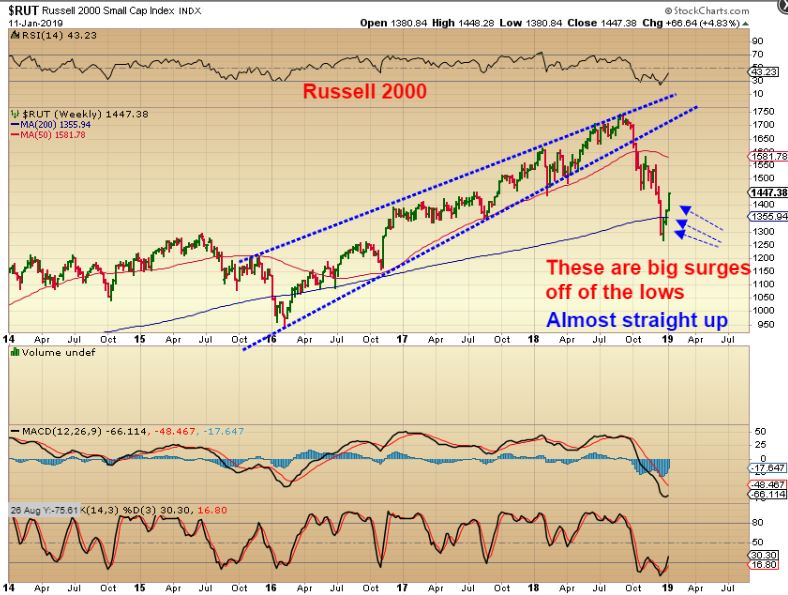
RUT WEEKLY #2 – In the past, we have seen that straight up rally and then it dies down when the shorts finish covering. Notice that it often went sideways after 3 or 4 weeks of straight up. I will watch for this.
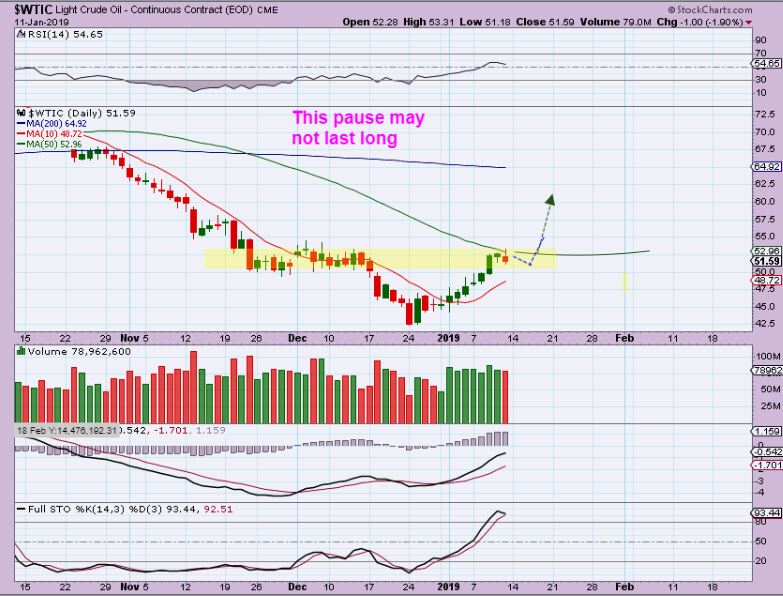
WTIC DAILY #1- Oil has paused at resistance as expected too, but this looks bullish and it might just break higher soon. The sideways move on the left did last for 3 weeks though, so this one can linger too. We may need patience with Oil, but if it Breaks above the 50sma, you may want to add to positions and raise stops, with a tighter stop under that 50sma.
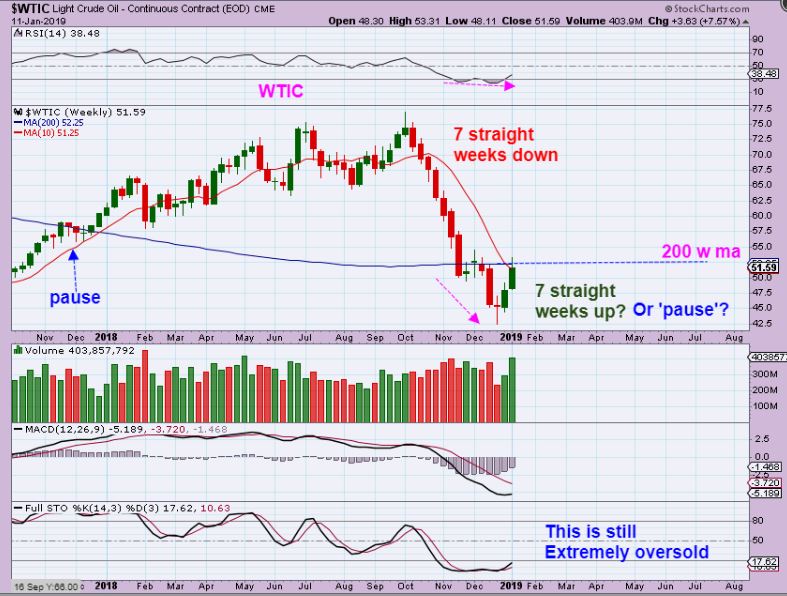
WTIC WEEKLY #2- A reversal followed by 2 strong weeks. Oil broke higher and pulled back this week, also indicating that it may stall.
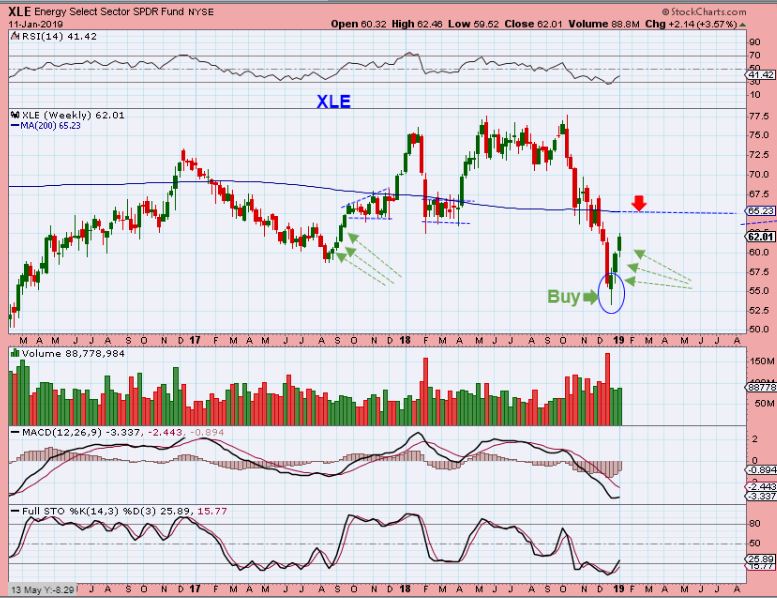
XLE WEEKLY – The XLE regained a capitulation candle and it looks like it can climb a bit more without resistance.
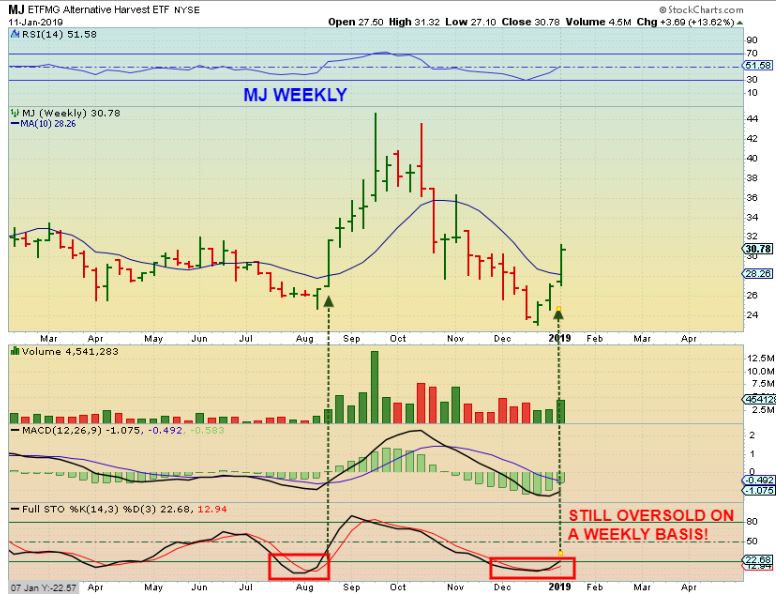
MJ WEEKLY – I’ve been pointing out this Sector as it moved off of the lows & broke the down trend line, so why not cover it Big Picture too? With STRONG follow though, the weekly charts look EXCELLENT. Notice that This is still oversold! This ETF gained another 13+% last week. This trades on the NYSE.
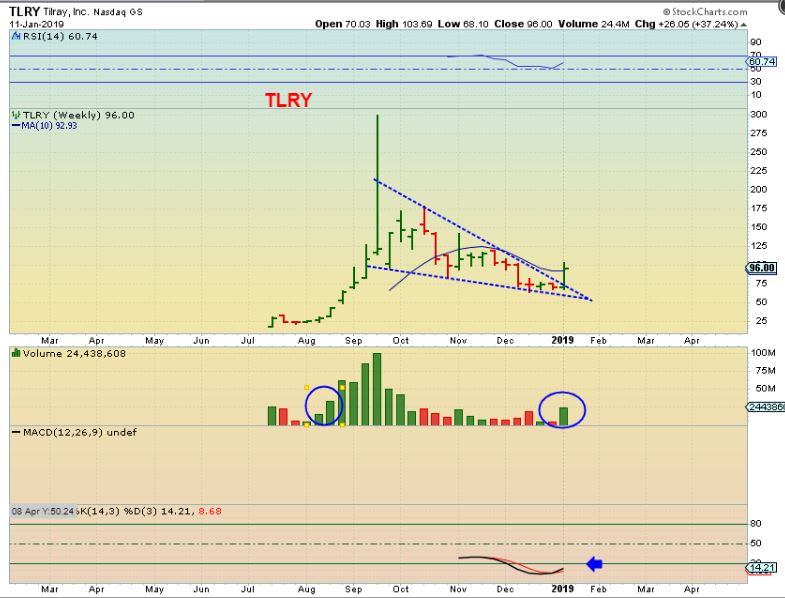
TLRY WEEKLY – Trades on the NASDAQ, This weekly chart has Massive potential if this gets going again. It was up almost 30% last week. This can run a lot higher.
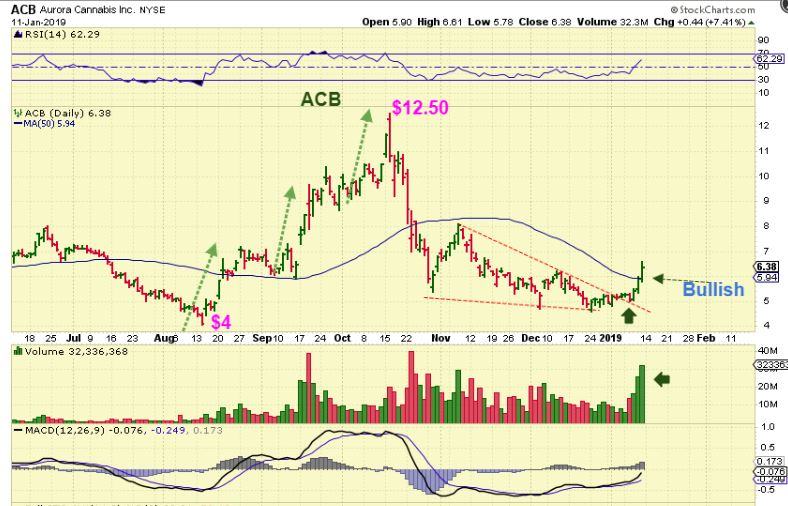
ACB DAILY – We grabbed this days ago, and it gained about 10% avg daily. It easily broke the 50sma with increasing volume, these look very bullish. The Weekly chart follows.
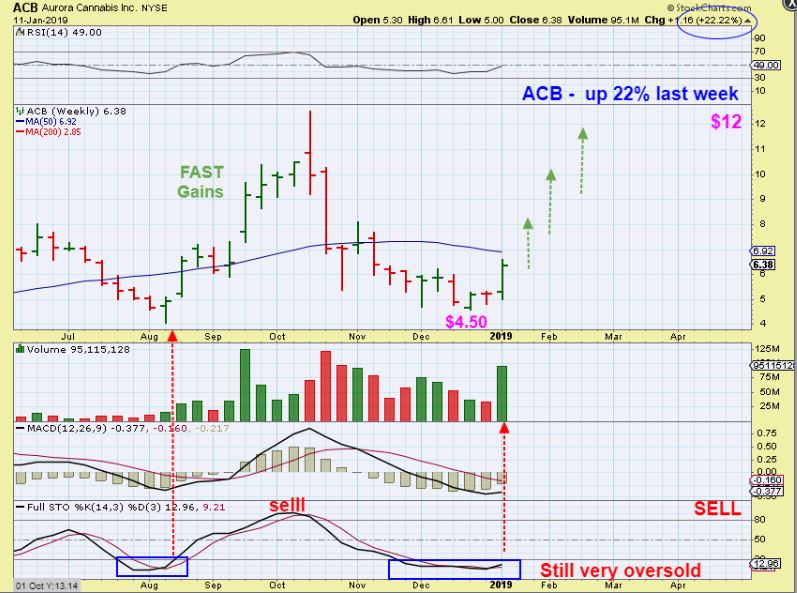
ACB WEEKLY – Do you see great potential, if it only does what it did last August to October? NOTE: This remains VERY OVERSOLD On a weekly basis. In August, it stalled at the weekly 50, but it also dint have THAT volume.
.
Sidenote: I will talk at length here 🙂 A few of these are now trading on the major exchanges in the US. ( MJ ETF, ACB, CGC, CRON, APHA, etc for example, and NBEV, WTER, etc as CBD infused beverages). I can’t say enough about the MJ Sector. When it is Bullish and running well, Gains are ridiculously fast and I’ve made 100-300% in just weeks. When the run ends & signs of a top appear, it is time to Get Out. I get out of my positions, because these can drop fast too, but will that change with recent events? Let’s discuss. I have been trading this sector off & on for years now, and it took a while to learn its personality. It is now a very rewarding sector to trade ( Small positions if you are new or want to avoid risk). Now think about this as a possible change going forward …
.
My thinking is that with the legalization taking place for Medical and recreational use of Hemp and Marijuana, the growth potential in this sector can start money flowing in for the BUY & HOLD crowd too.If they buy and stay invested- These large Bursts higher that have dropped a lot in the past may just start trending uphill in a tighter manner. This is still up trending, it is just hard to hold these big swings. See the chart and …
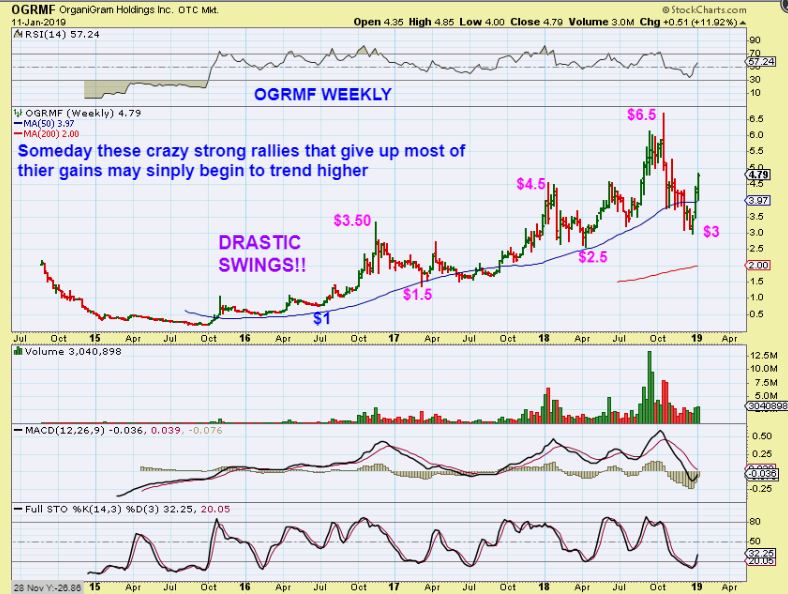
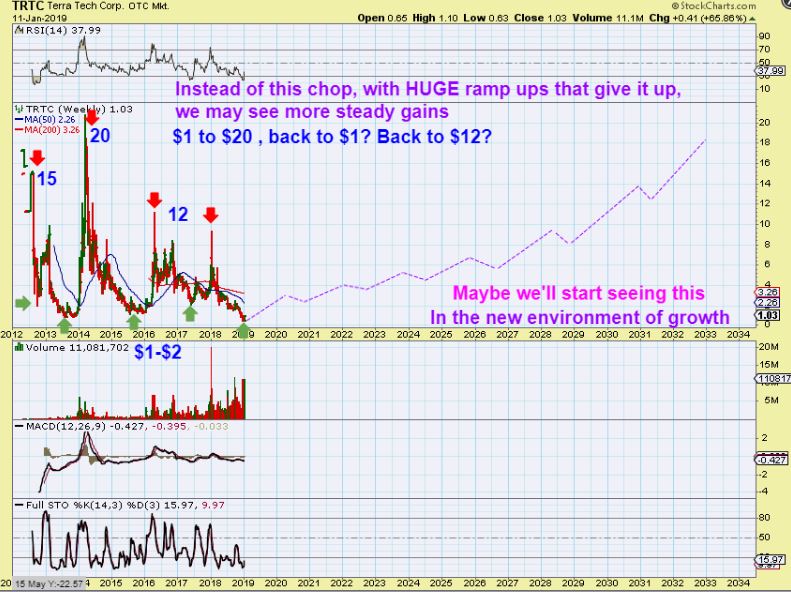
TRTC WEEKLY – This has been ridiculous with massive rallies that die and give up the gains. Maybe there will be a more consistent move with the prospects of steady growth in some of these MJ Stocks. Look at these Big Swings. If that steadies out, these will be money makers. Many more are applying to be listed on the larger exchanges too.
.
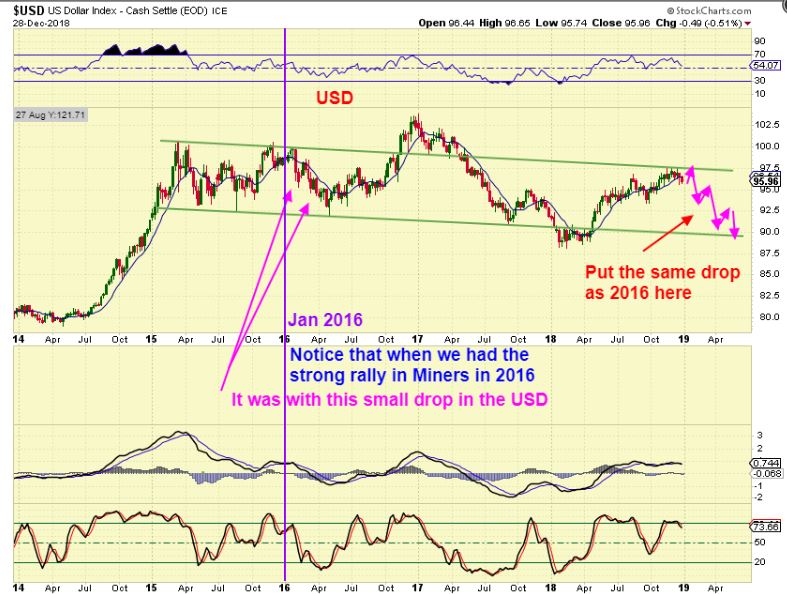
USD WEEKLY DEC 28 – I posted that the USD should roll over, that ought to be good for the metals.
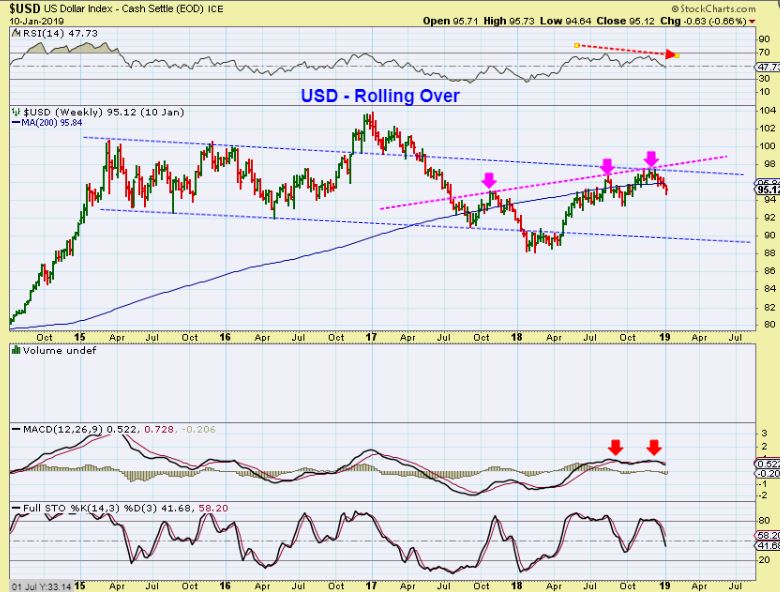
USD WEEKLY – It has been rolling over.
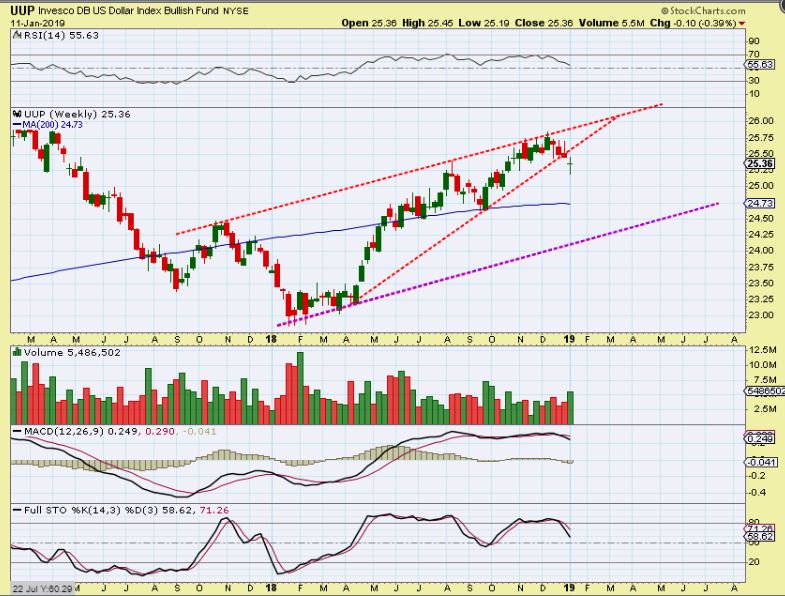
UUP WEEKLY – I even see a rising wedge. Is that a USD reversal? If so, the USD can back test the wedge, GOLD, SILVER, & The Miners can pull back a bit more.
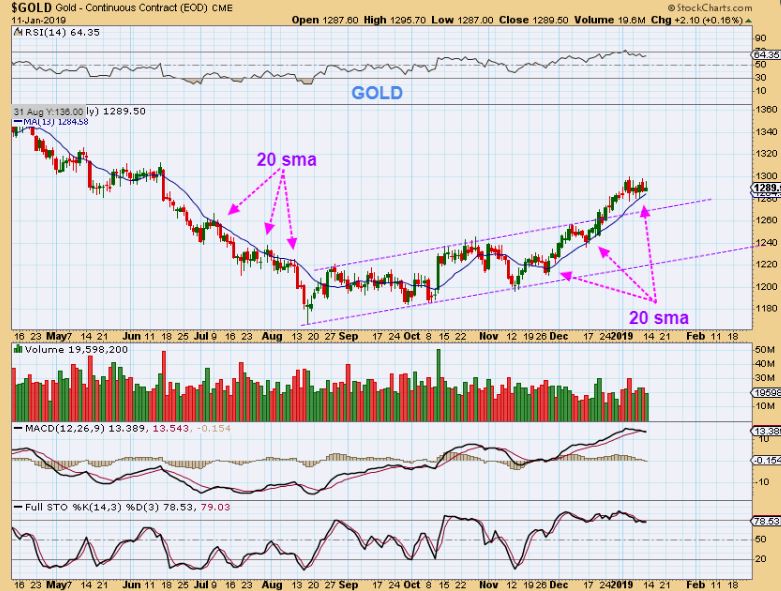
GOLD DAILY – Gold has gone sideways for days now. If the Dollar bounces, it may be able to back test the recent break out.
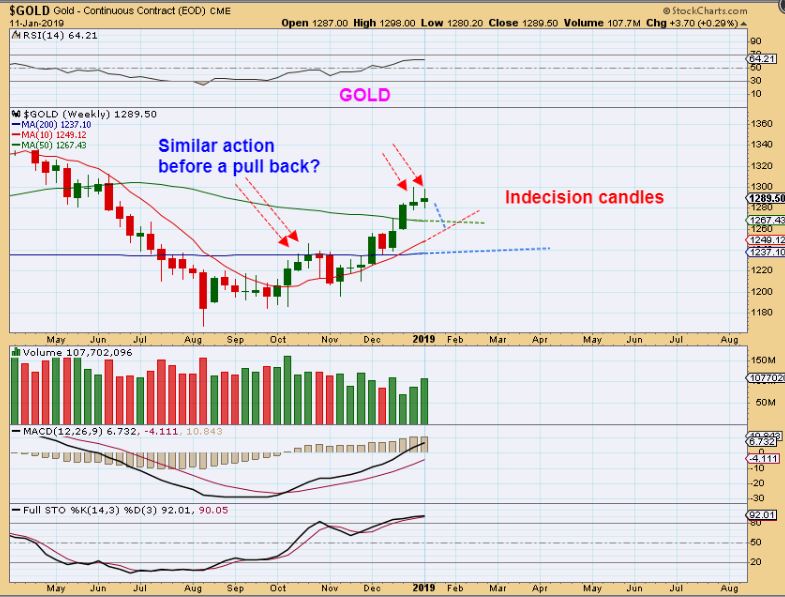
GOLD WEEKLY – A pullback is due, but Gold wont sell off. These are 2 weeks of indecision, so we may see a pull back next week.
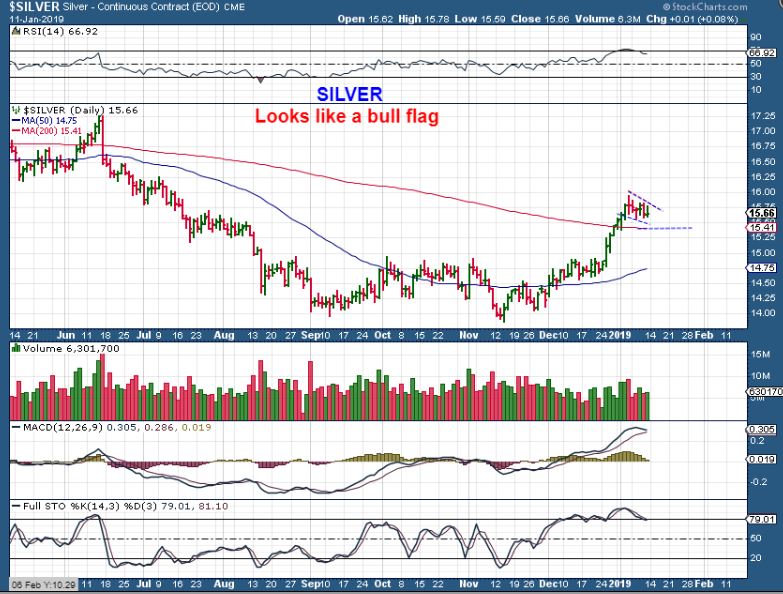
SILVER WEEKLY – The weekly Silver finally broke out after leaving that small base behind. Since this is a ‘recovery’ similar to GDX GDXJ, they usually do not fail again. That means that Silver may just continue sideways. Let’s look at the daily for possible clues…
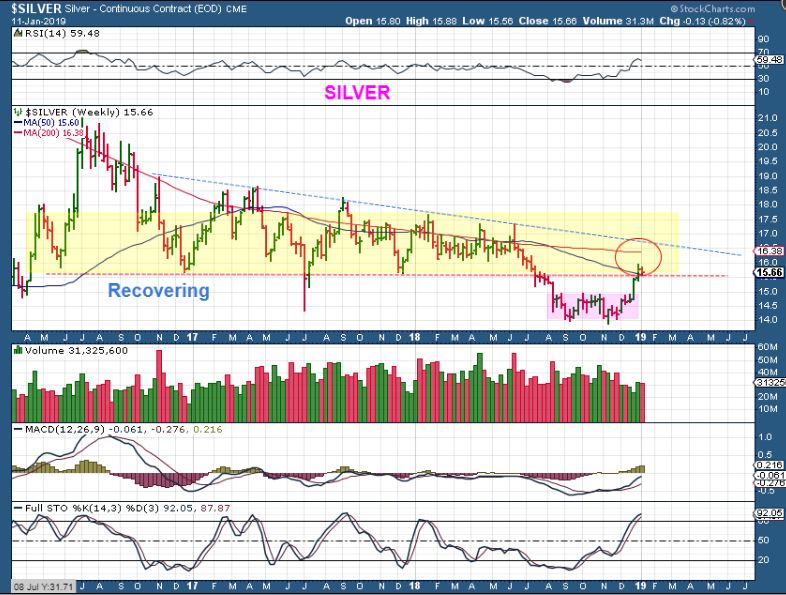
SILVER DAILY – Sideways also fits the daily chart. A bull flag to the 200sma back test would be perfect. BUY THAT REVERSAL!
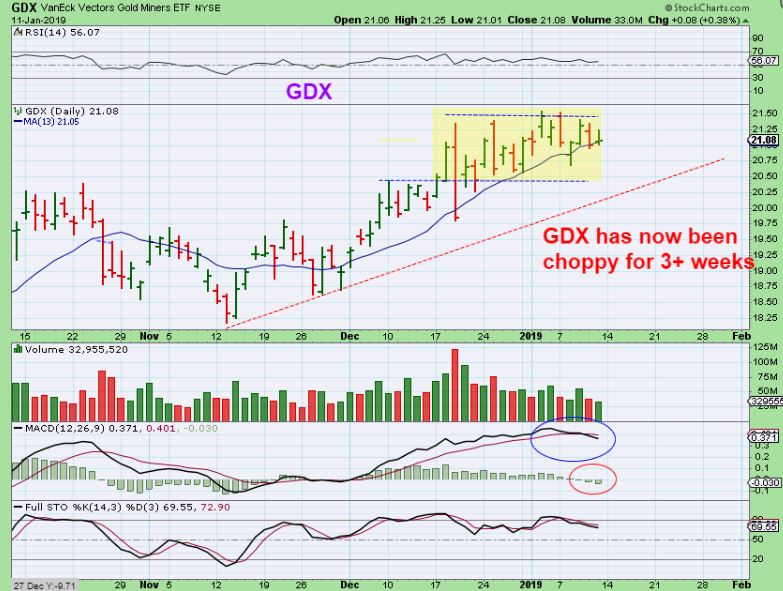
GDX DAILY – This is actually now 3 weeks of choppiness as it consolidates the recent gains. We now have a MACD cross down and this can drop further from overbought. So far, each dip to the 10sma has been bought. When that is broken, I’d say we’ll get our DCL.
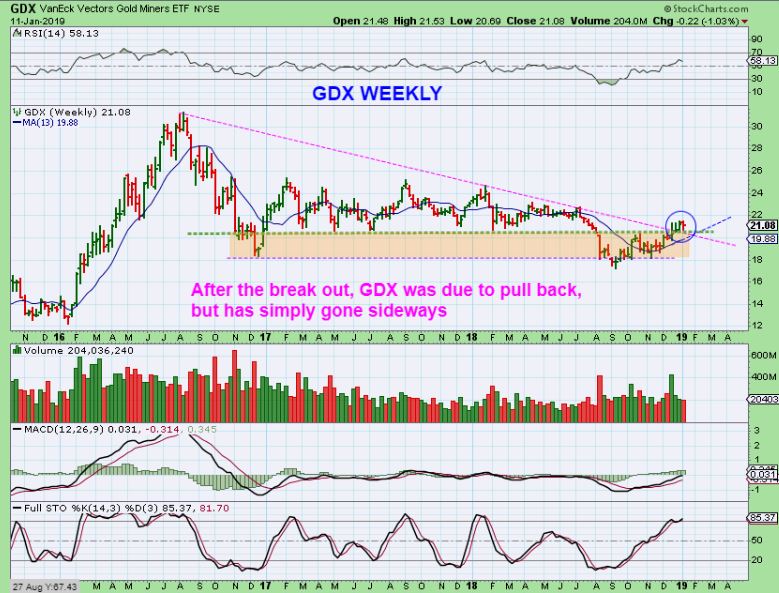
GDX WEEKLY – As mentioned, this is a recovery, and they usually do not break down again, so it has been going sideways for weeks.
GDXJ WEEKLY – This is also a break back into the Bullish Zone. 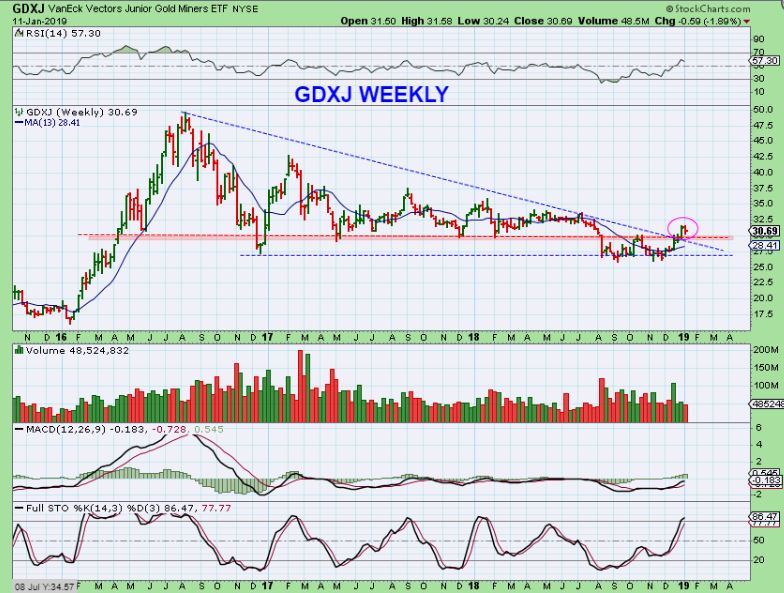
I would expect for us to get a great rally in the precious metals sector with this shake out, base, and now a Weekly & Monthly recovery. It really should not break down after recovering, so I would say that with the recent sideways move, it is just a matter of time before it begins to trend higher. We can look for a reversal soon.
.
This has been a very good couple of weeks of short term trading in a variety of other sectors too. There are pauses along the way at resistance areas, as shown, but it does not look like these trades are ending. We may be seeing short term pauses or moments of rest before the upside continues. As the next runs unfold, we’ll monitor how things look again.
Trading & investing is getting exciting again 
.
Hope you all enjoy the rest of your weekend!
.
~ALEX

