The MJ Stocks, Round 2?
(below is a sample of Alex’s work from the week. The marijuana stocks were highly volatile in recent months and after the news of legalization in Canada, they saw a sharp sell off [‘sell the news.’] A reversal appears in order. There are dozens of companies to cover in the MJ sector, including the MJ ETF but these are just a few.)
MJ STOCKS –
Note: I have repeatedly warned about the great risk / Reward of this sector. It simply moves very fast and any bad surprise can take price down quickly. That said, they do also move higher 10-50% per day. please use caution & control risk with position size.
.
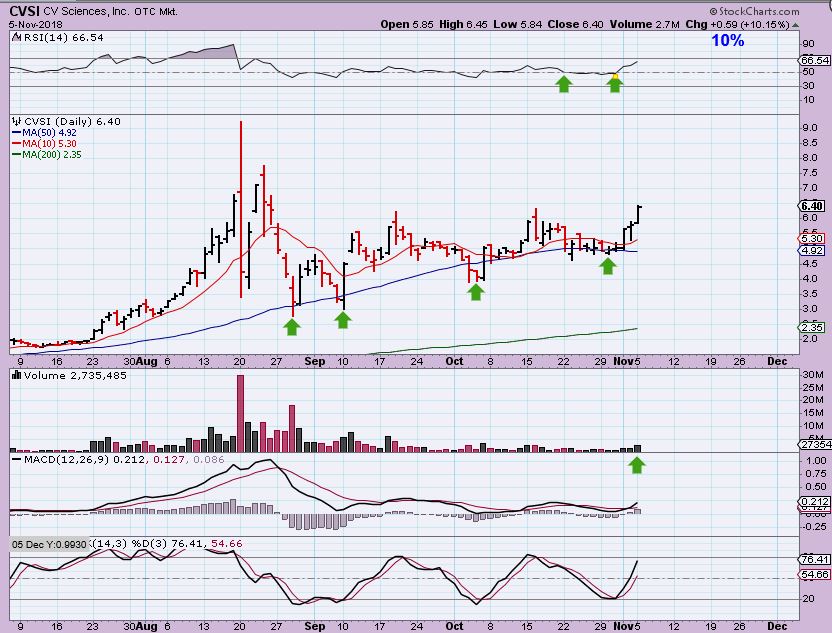
CVSI – I mentioned that even with the “Sell off’ in this sector, CVSI held up around that 50sma, so I bought it. This is a bullish chart pattern.
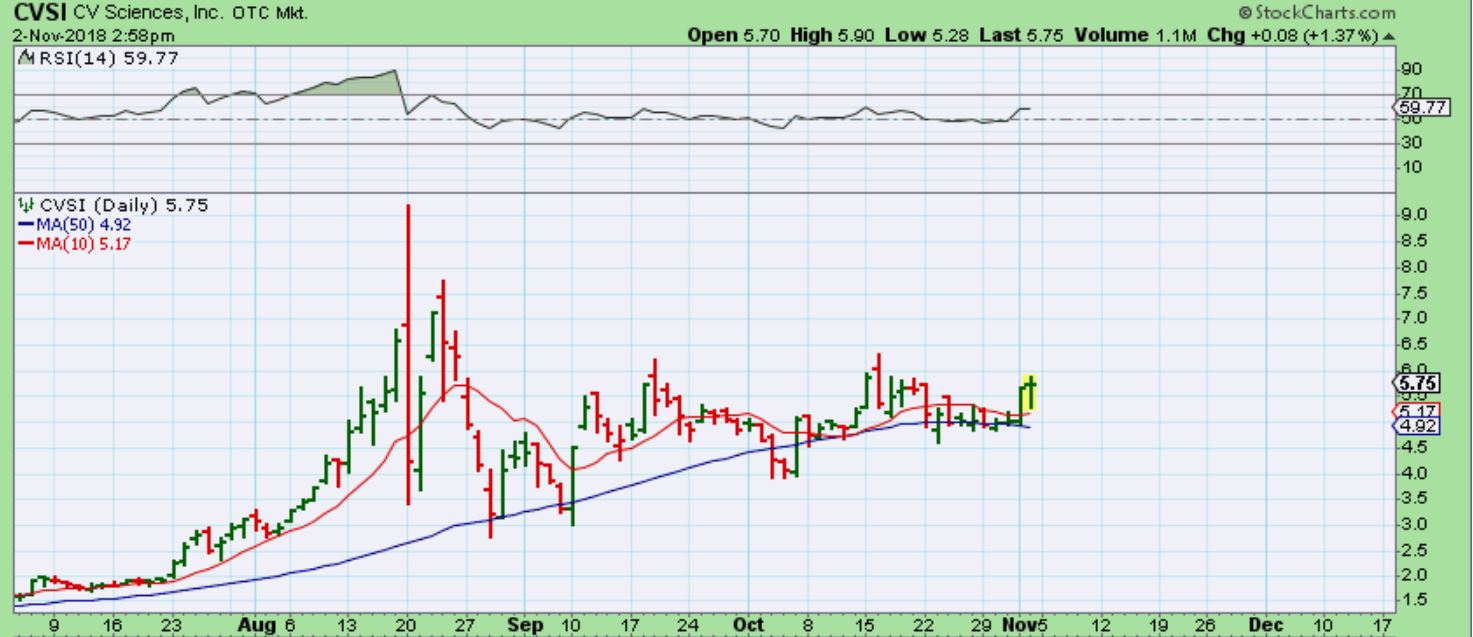
CVSI – It continues higher
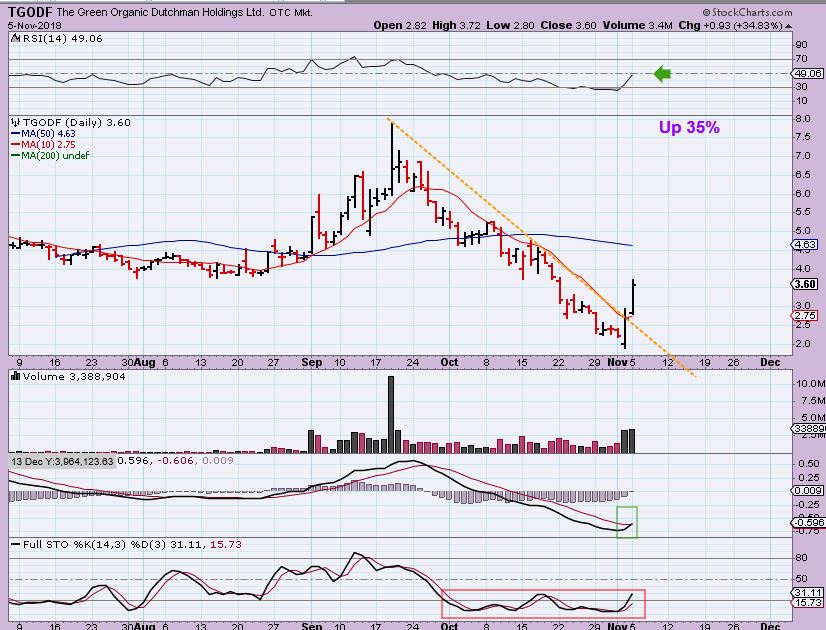
TGODF – I also said that I bought this as it was rising, because it was a bullish engulfing at the lows with good potential.
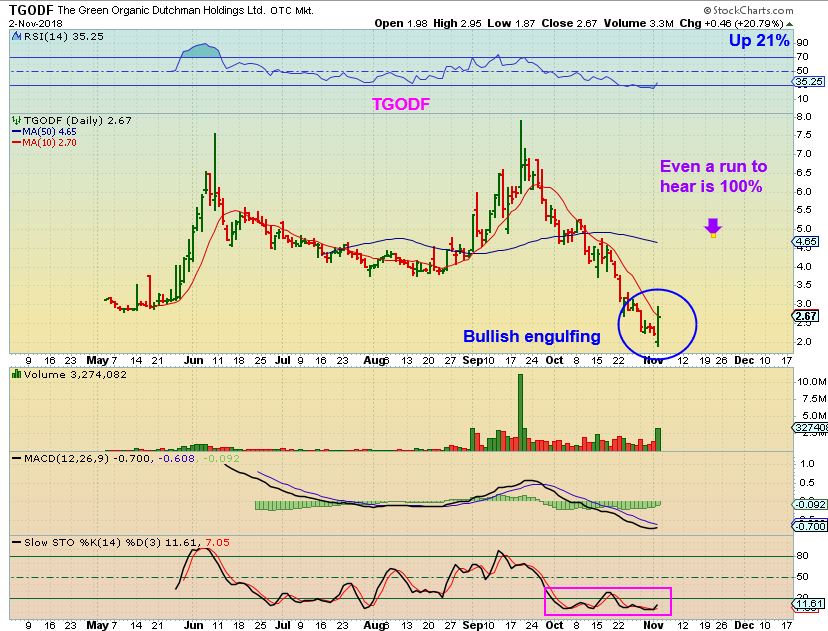
TGODF – It was up 35% Monday.Several have been moving off the lows, and just ran staright to the 50sma and even broke out.
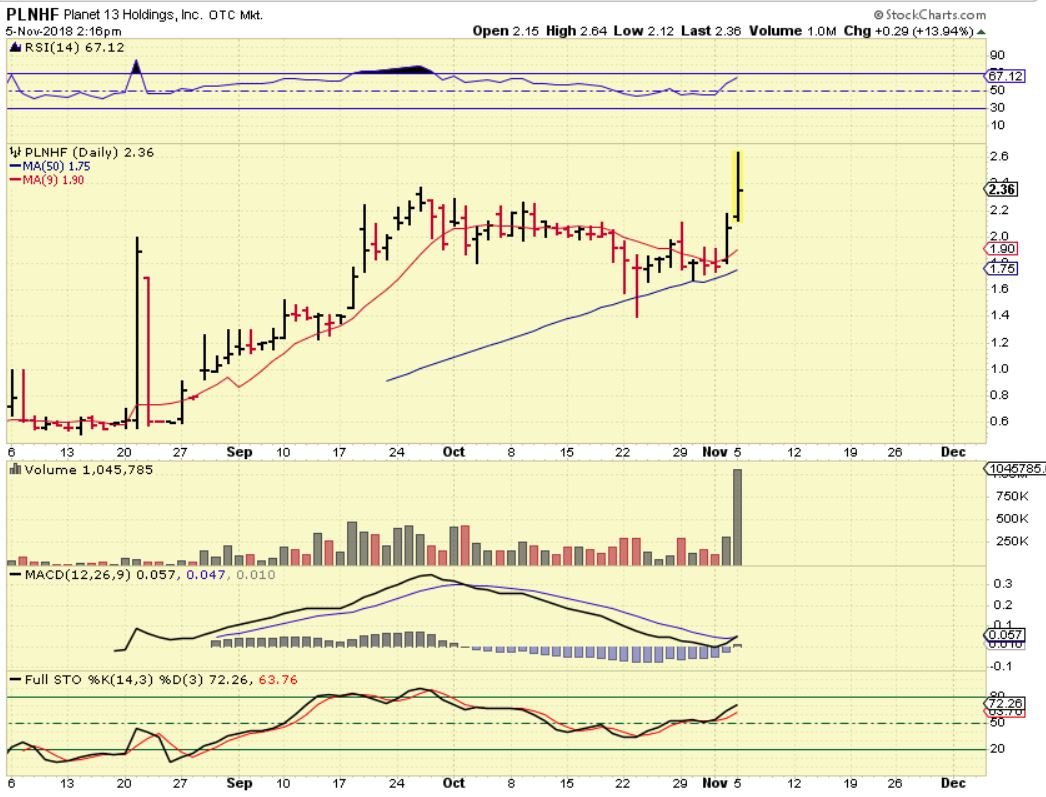
PLNHF– Tammie mentioned this stock, and I actually loved this chart pattern.
1. Steady on the 50smaI
2, A long sideways consolidation, not a sell off t was already up 10% when I bought it, but you can see that it ran higher and sold off.
3. Big Volume
but why would I buy it if it already ran from $1.6 to $2.30 in 3 days? I bought it as it sold off to $2.30 knowing that it can be bought back by the days end. This set up was very bullish, and …
PLNHF – And it closed up 24%. I is at new all time highs, and that is bullish. As a measured move (and with that volume), it does have a target of $4.20 or more, so even though it was already up- This One was buy-able.
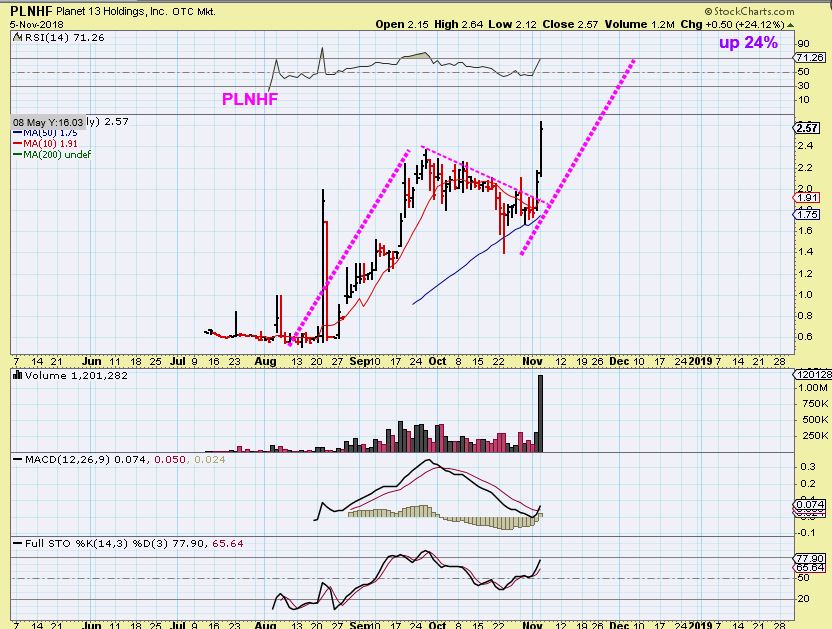
NOTE: THAT PLNHF CHART ABOVE WAS SPECIFICALLY BULLISH OVERALL. I WOULD NOT JUST BUY ANY STOCK UP THAT MUCH, YOU CAN GET CAUGHT IN A DOWNDRAFT.
.
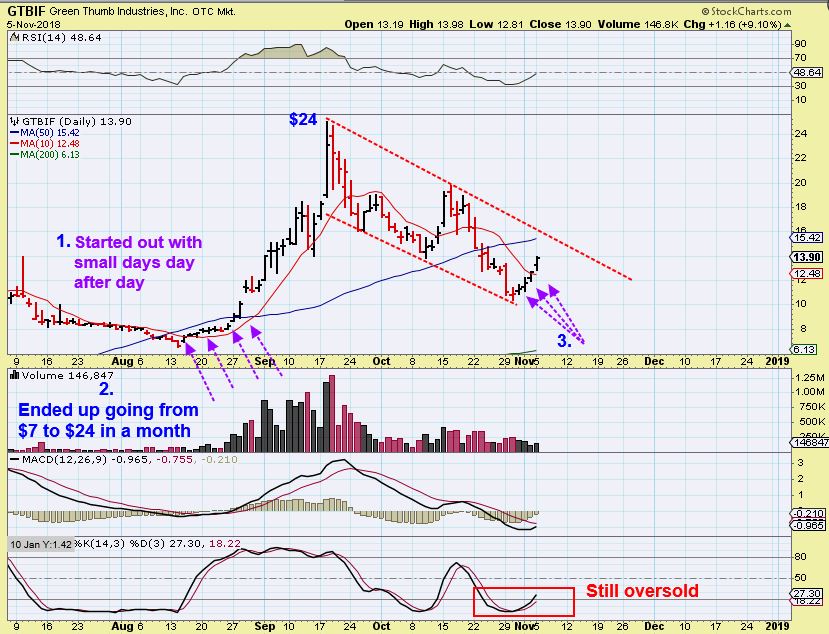
GTBIF – This is an example of what I see many MJ stocks doing now. At first glance, I would expect a ‘Bounce to the 50sma”, but as you see, many of these are breaking out again. Can you see how this slowly ran higher in August to the 50sma, and then ramped up? I’m wondering if We may see the same ( read the chart). This tiny move is already $10 to $14!
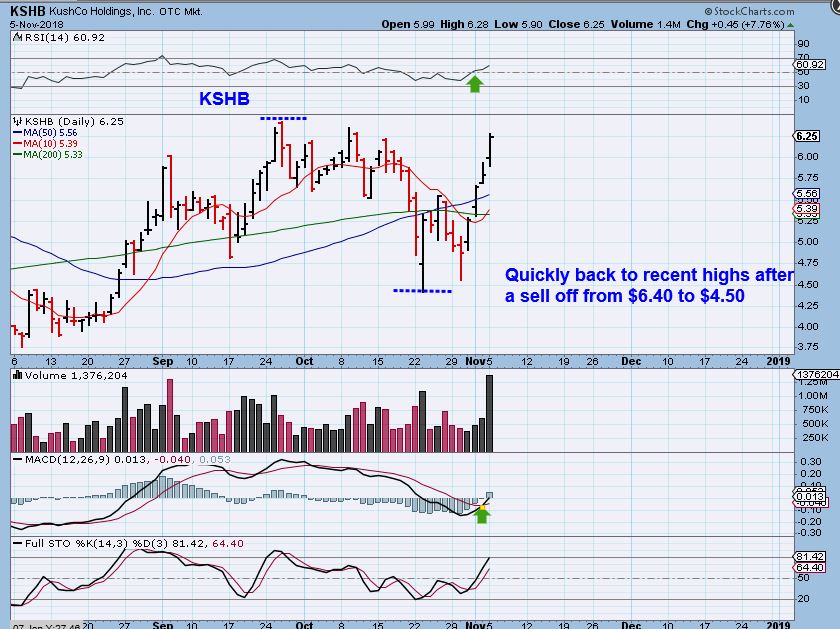
KSHB – KSHB crashed below the 50sma in the recent sell off, but suddenly, the sector got heated up again, and it ran from $4.50 to $6.40 in 5 days. That’s not all…
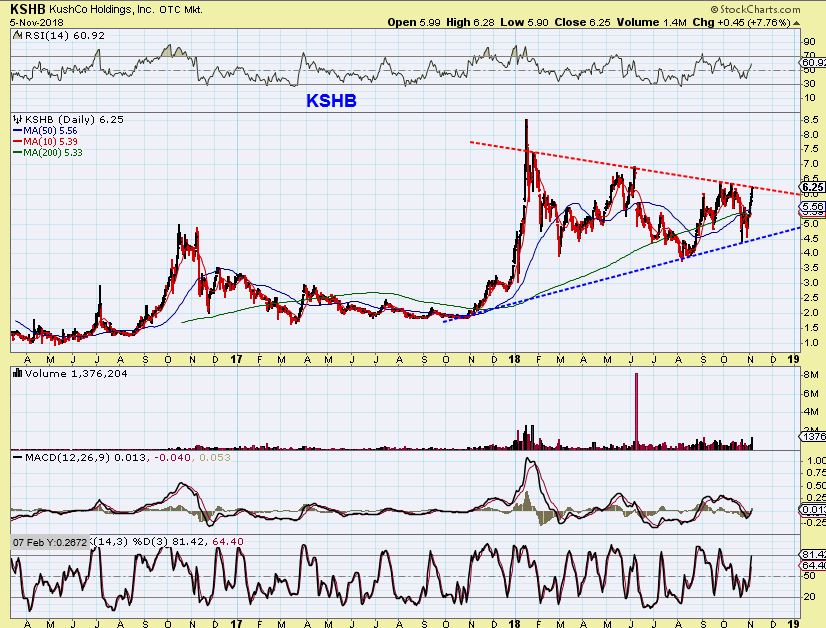
KSHB – I always like to look at the big picture of these, and you can see that KSHB is a bullish triangle, heading for all time new highs. Let’s just say that you held “Buy & Hold’ from last Oct lows, that was $2 to $8.50, but what a bumpy/choppy ride these can be! It is now at $6.25 and could break to all new highs soon though.
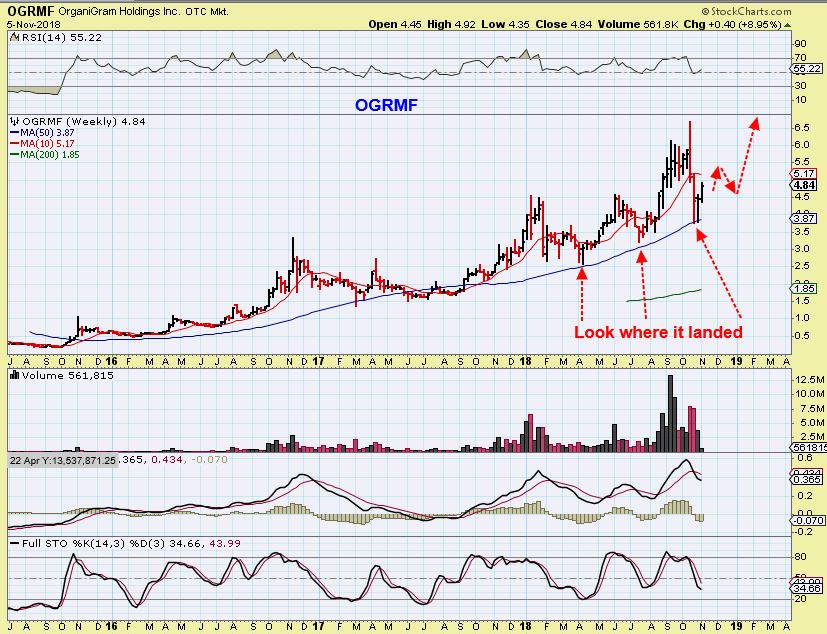
OGRMF – Another long term bullish chart, but VERY difficult to ‘buy & hold’. It has now bounced off of the 50 week moving average after a steep 2 week crash.
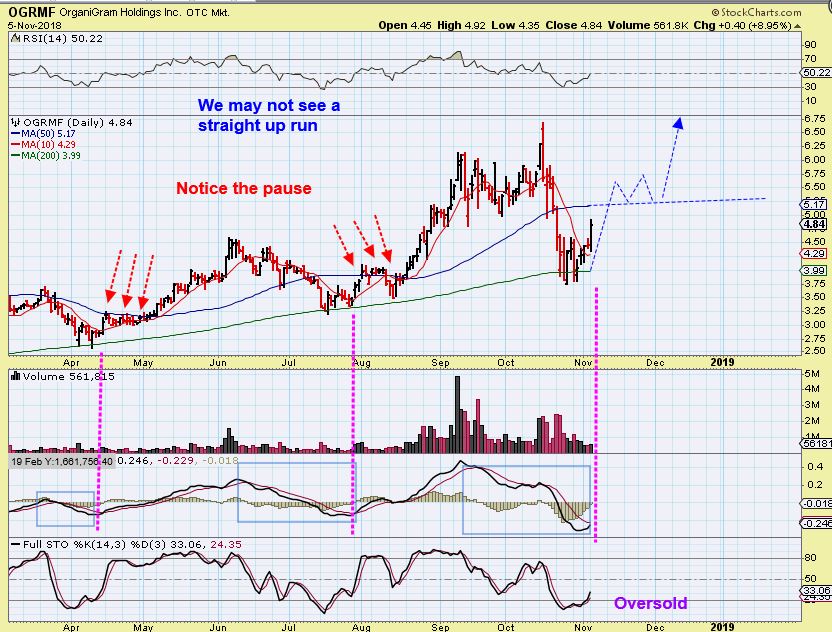
OGRMF – This was the crash on a daily chart and it is just now starting to move higher, up 9% yesterday. Please read the chart, it is difficult to tell if this will meander higher or surge higher.
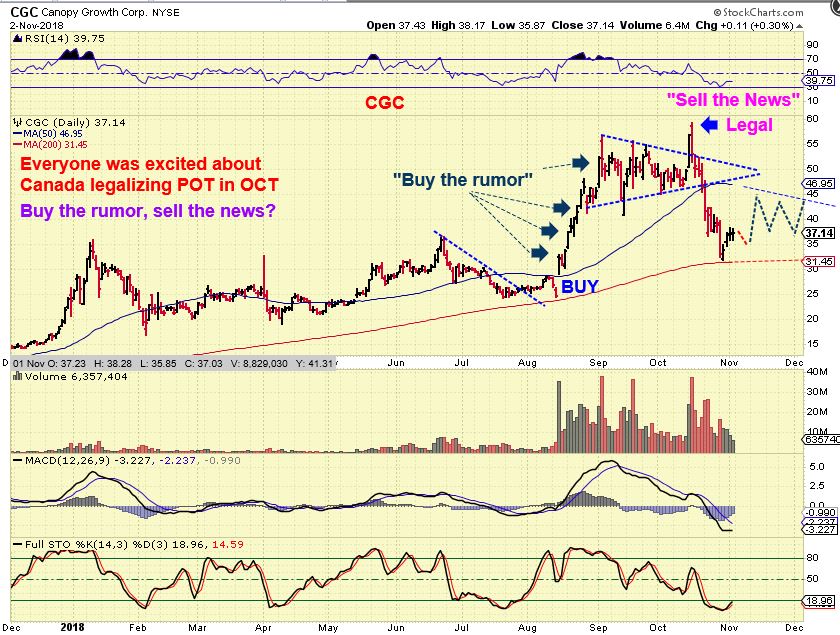
CGC – Read this chart: This is a tough call, and I mentioned it last week. I can’t tell if it is ready for a massive run again, like in August? Maybe it is. Or will it meander, and if so, why? I say this because there may be a lot of Buyers in September that may now be stuck after that sell off, so they become sellers stuck in this stock just ready to bail out on a rise higher. It is a buy near this support level though.
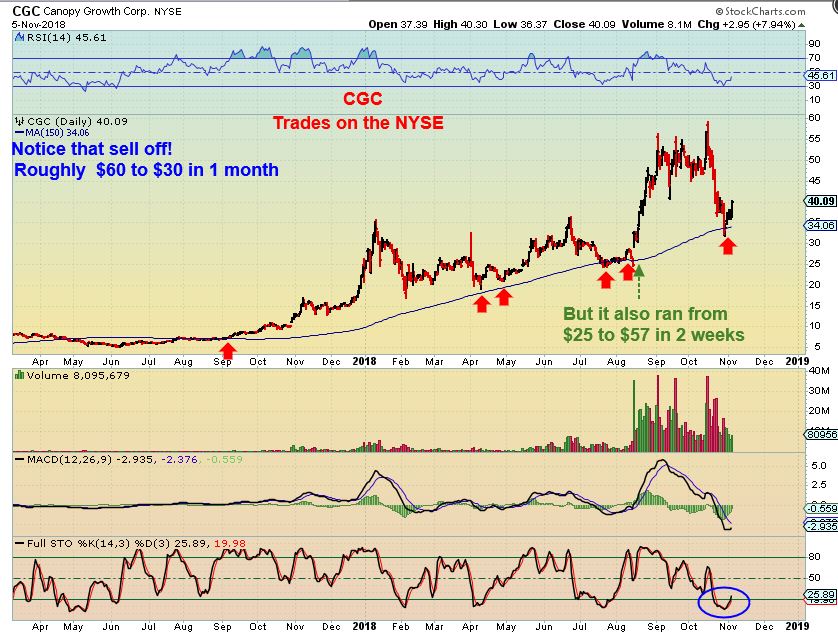
So I posted this and wrote this chart about CGC last week, thinking that maybe sellers could be caught in this stock ready to bail out. I could also be wrong, they may just add to position and ride it higher.
I have a list of maybe 60-80 MJ Stocks, and that is too many to mention here, So check your list of MJ STOCKS and see if they may be rising from a support level with increasing volume. You may have a nice trade developing if you do.
Chart Freak Membership
Alex has been successfully writing a daily newsletter service for nearly four years now and is considered one of the best traders of precious metals miners, energy/uranium stocks, and biotechs. This is your opportunity to join his service as a member and follow along as we enter the next bullish gold Cycle higher.
If you would like to find out more about the service or sign up, please click the buy option for more details.