
10-24th – The Latest Developments
The selling continued in the stock market, but there is a recent development that I mentioned we should look for.
.
DJIA – Yesterday I used this chart and mentioned that we could look for a possible double bottom low, or ‘W’-Bottom with divergence. You see it at other Lows formed this year.
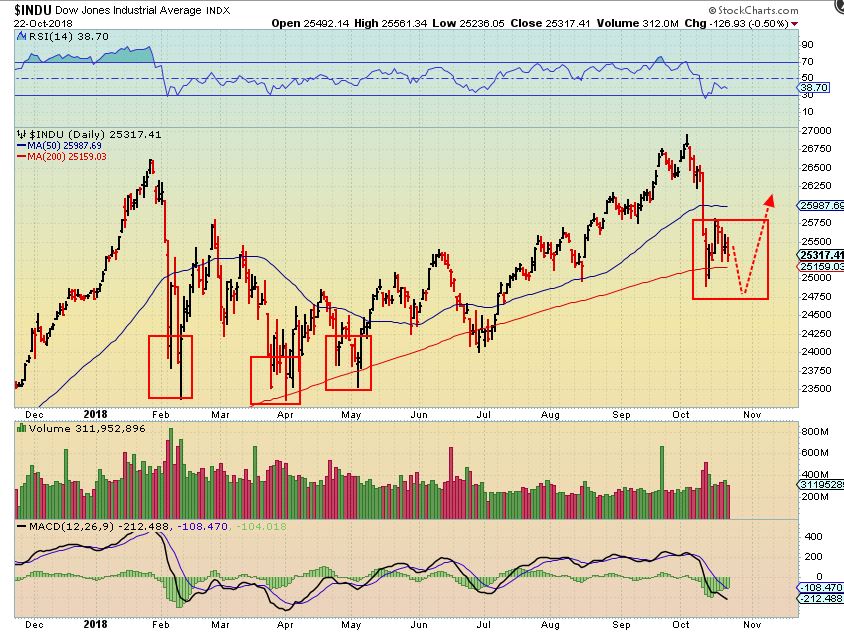
Tuesday the DOW dropped over 500 points and broke below the 200sma as a possible shake out / reversal.
1. It is safer to buy a swing low confirmed above the 10sma, as you can see, the last swing low 2 weeks ago failed at the 10sma. However…
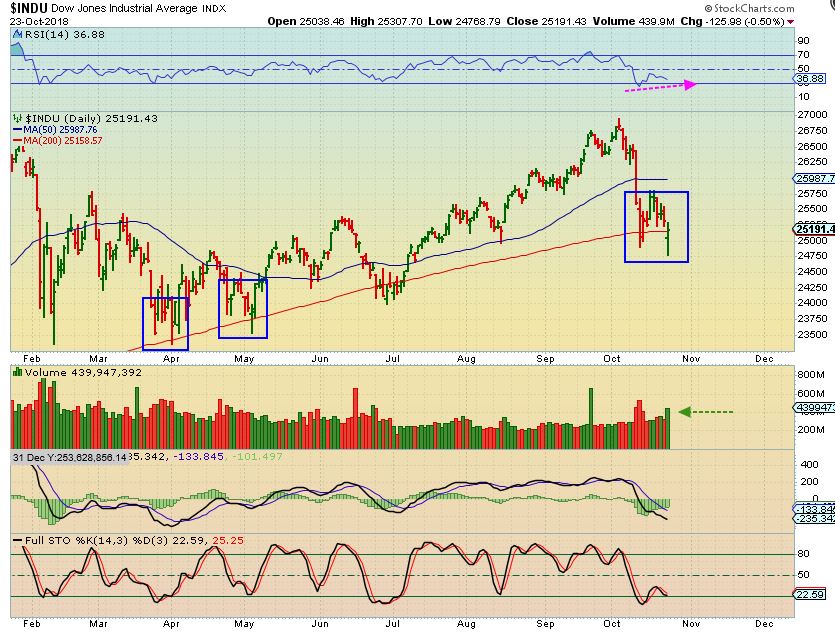
2. For higher risk traders using technical analysis, That low can actually be bought with a stop below yesterdays lows, but keep in mind…
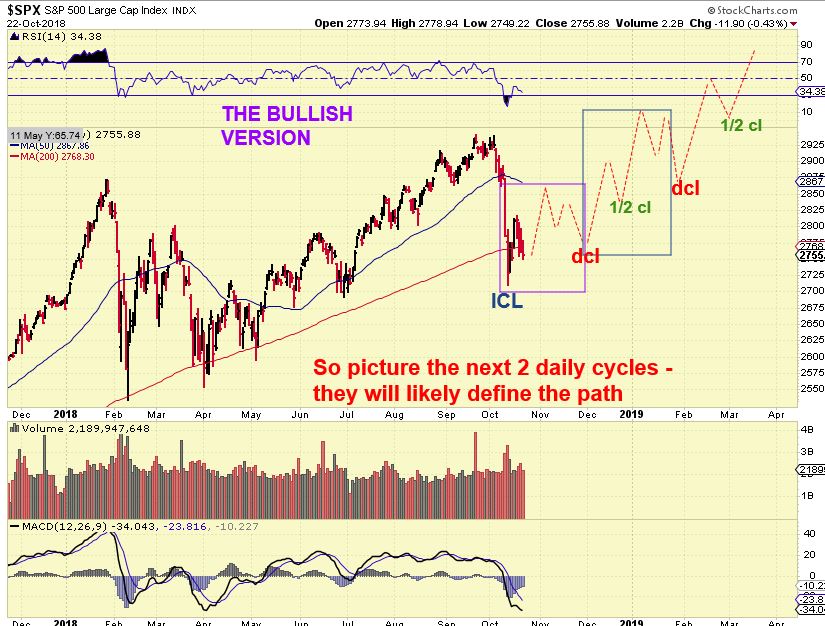
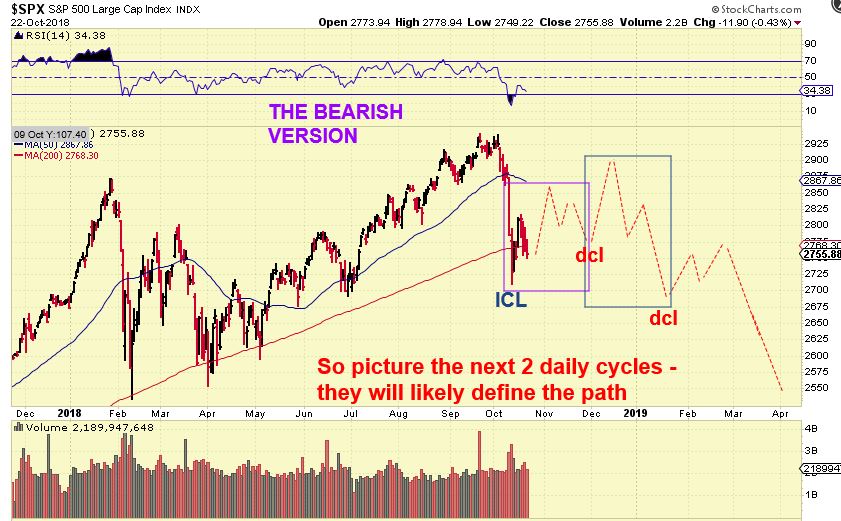
I also used these 2 charts below to show that going forward, the next 2 daily cycles will unfold as either bullish or bearish . That will be determined WEEKS from now, so please be patient as this plays out.
The Bearish version – Dead Cat Bounces eventually rolling over
TQQQ- Many individual stocks have these reversals too. As mentioned above, a reversal with this divergence can be bought with a stop under the lows. We just don’t know if this will rocket higher or get back above the 200 sma & chop around sideways .

USD – Did I mention that the USD looks bullish? It has for the past few weeks. Resistance continues to hold down the USD. I’d love to see it play out as drawn.

WTIC – Oil really dropped on day 47. It has broken the 200 sma. A break below $64.43 would be a negative for Oil & indicate a drop into an ICL. Oil inventory reports are released on Wednesday.

GOLD – Golds chart looks beautiful, with that POP that I was hoping for. Notice that it didn’t close at the highs, so is that bearish? It could turn into a false break out, but so far this looks good. I would expect this to follow through. Also…
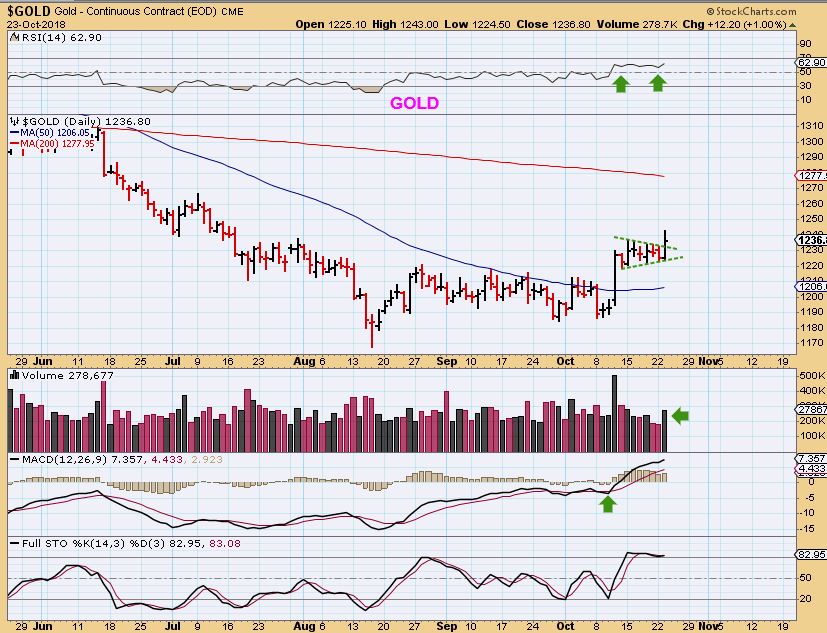
GOLD 4 hr chart – On a 4 hr chart or 2 hr chart, that drop is merely a back test of the break out , so far. So a break DOWN from here gives us a false break out, follow though higher is bullish.

SILVER – Silver has been crawling along the 50sma, but without a solid break upside. That MIGHT be about to change. This does look ready to move higher and is at least holding above the 50sma.

.
MINERS GAPPED OPEN AND SOLD OFF AS THE DAY MOVED FORWARD. I DO HATE TO SEE A REVERSAL LIKE THAT, BUT IF GOLD FOLLOWS THROUGH HIGHER, I WOULD EXPECT MINERS TO DO THE SAME. LET’s DISCUSS MINERS…
.
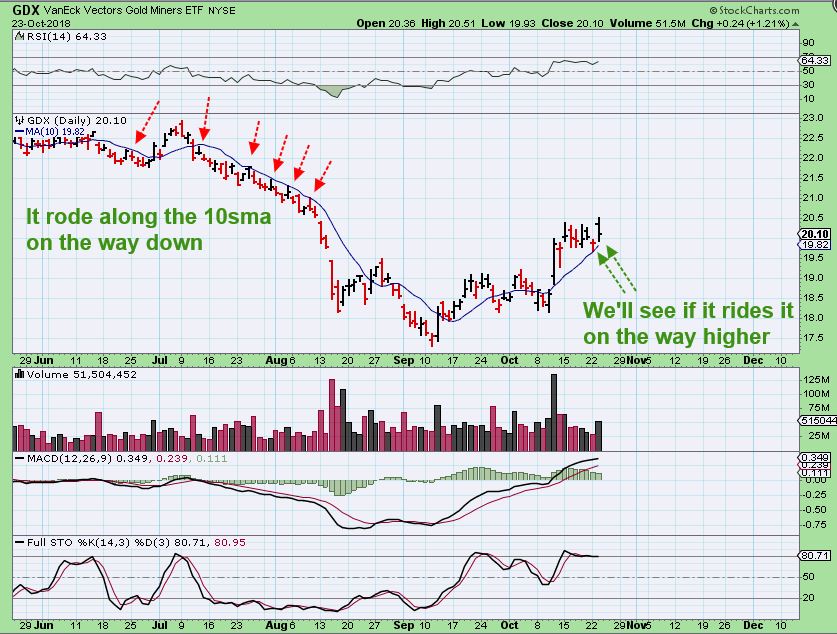
GDX – I don’t like the reversal, it is actually a Black Candle if I use candlestick charting. A Black candle often leads to a few more down day. At this point, I am just pointing out how the GDX PRICE traveled along the 10sma on the way down, and I expected it to do the same on the upside. So far it is, however …
.
I have also mentioned a possible back test of the 50sma. THAT IS NOT BEARISH, but it is disappointing when we just want some upside gains from our entry point. Let’s review that idea…
.
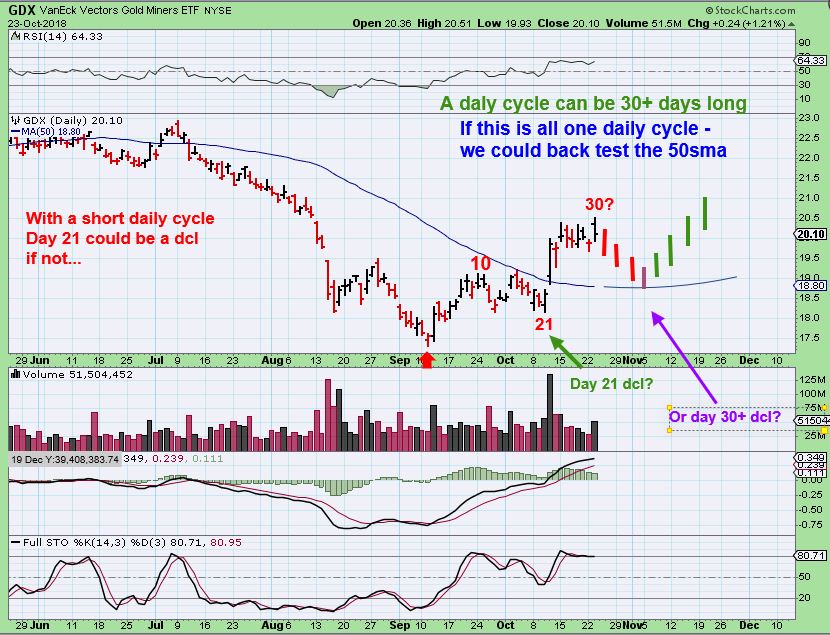
GDX – If day 21 was not a daily cycle low ( and that is a tad early), then this daily cycle is now very right translated, and normal daily cycles can be 33, 35, 37 days long. Again, this is NOT bearish, it is normal. Please review the chart.
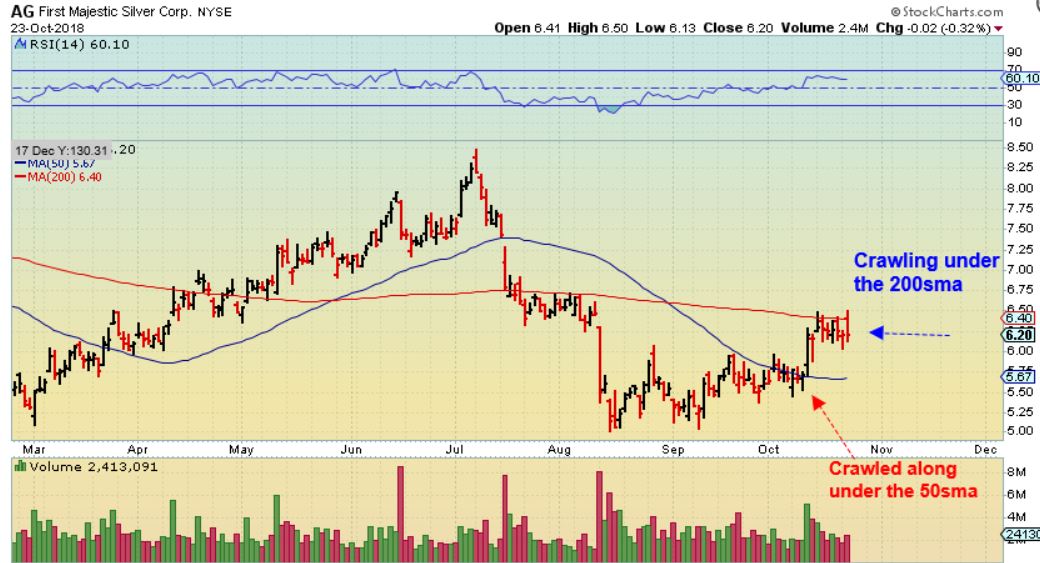
AU – I’ve discussed the bullish charts of SBGL, AU, GORO, ABX, etc – Look at AU.
Do you see this as a BULLISH CHART?

AU AS GDX – If so, then notice how AU did EXACTLY what GDX has done within this blue box. It crawled under the 50sma. Broke out & Yes- had a reversal candle and then back tested the 50sma. It then launched higher.

GDXJ – SCROLL UP & DOWN & Compare GDXJ with AU above. Almost Twins within the blue box. This would be very similar if we get the back test to the 50 sma- and you must have agreed that the AU chart was bullish. And now Au’s reversal would tag the 200sma for a low risk ‘buy’ too.

So The General Markets may have a double bottom or ‘W’ – Bottom low. Those wanting to trade TQQQ, UPRO, or other individual stocks that had reversals could wait for a confirmed swing low above the 10 sma, or buy with a very tight stop. Markets can rocket higher for a couple of days, but also they may just remain choppy. LOOK BACK AT THE FEB LOWS, they are similar to what we have now and that was choppy. That may help you to decide if you want this trade.
.
Wednesday is Oil inventory, will THAT put in a swing low? Will that break former lows at $64.43 ? We shall see, but Oil is in the latter timing for a dcl and we should see a reversal soon and then a break above the 10sma.
.
Gold broke out and looks very good, but it is hard to understand why the Miners did not gap fill and get re-bought into the close with Gold & Silver still in break out position. That means that set up in the Precious Metals sector is ‘mixed’ at this point, but remains longer term bullish. The Mixed part is this…
,
1. They remain above the 10sma = short term bullish
2. They have reversals that caused black candles, black candles usually are followed by a down day or down days, and that would break the 10sma. Short term bearish.
3. We could drop & test that 50sma for a daily cycle low. Not long term bearish, but short term annoying.
.
We just have to wait and see what Wednesday and the rest of the week bring our way. I’m not posting any new ‘Buy set ups’, but many Miners are at the 10sma, and that has been pointed out as a possible buy area or a good place to add to current positions ( In this case, it would be as long as we don’t drop to the 50sma) .
.
ABX, AEM, GG report numbers today. AEM, GG after market closes , I’m not sure about ABX
.
Enjoy your Wednesday with the Markets. As a side note: I added to GORO yesterday at the 10sma, AG under the 200sma, and added to leverage, but I am going to try to sit on my hands for most of the day Wednesday and watch how things unfold. All 3 of those could drop to the 50sma, if the daily cycle is still finishing up. I thought that the miners would be bought back into the close, and that would have erased those Black candles. We’ll see if Gold can keep breaking higher & drag those miners higher with it. I will put a few charts at the end of the report too.
.
~ALEX
,
AG – I bought it, even though AG could drop and test the 50 sma. At this point, it looks like it wants to break above the 200 sma.
FIND ANY CHART WITH BLACK CANDLES – That day is more often than not followed by a down day or sell off, so that is why I have mentioned it on GDX & GDXJ.

GDX BLACK CANDLES – A red day (or days) often follows.


