May 26th Weekend Report
We have really been focusing on whats going on in the Precious Metals Sector lately, so with that in mind, I am releasing this weekends Premium Weekend Report to the public, enjoy!
.
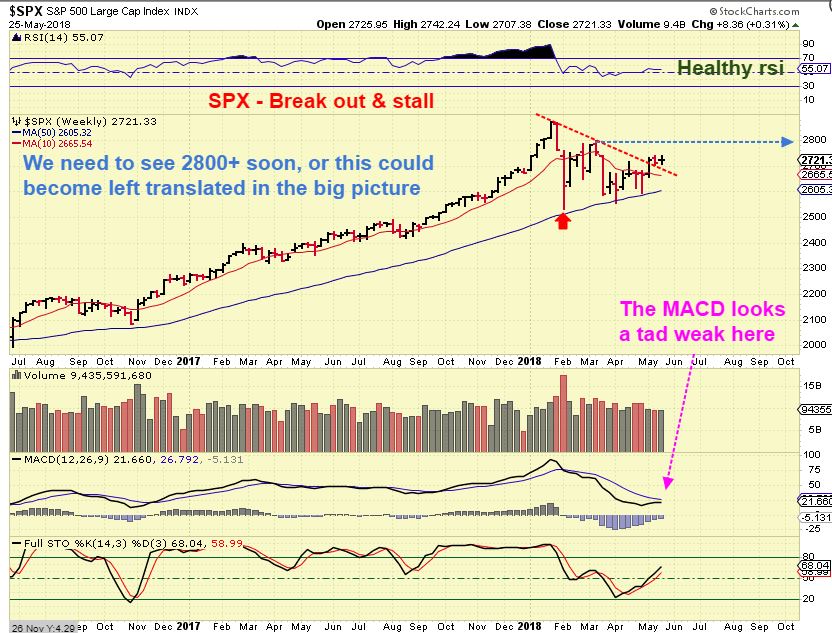
SPX – We discussed the break out from the down trend / triangle as bullish 2 weeks ago, but we really need some upside to increase the big picture bullishness. An ICL in Feb formed and I’d like to see new highs within this intermediate cycle. This is currently a bullish set up, as discussed in the weekday reports.
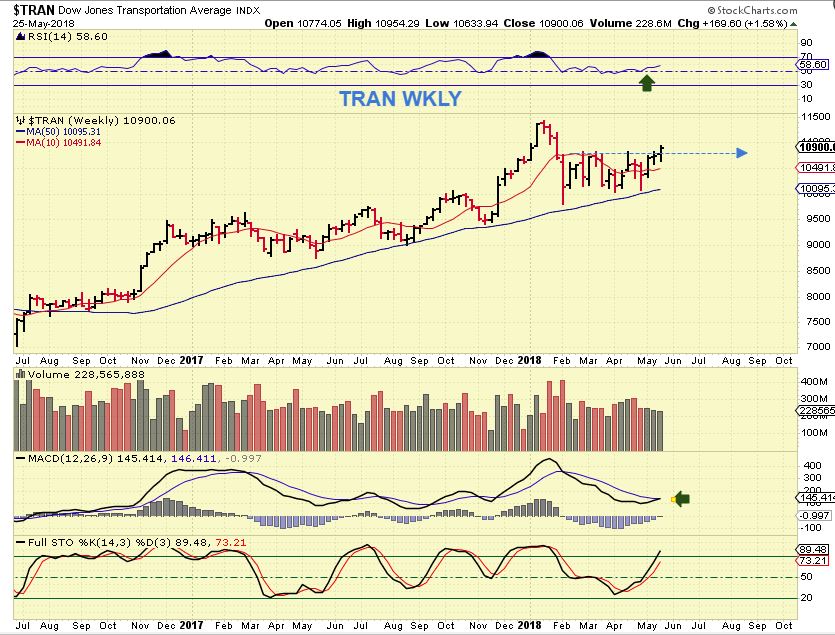
TRAN – It is encouraging that the TRAN broke above the series of highs inside of this intermediate cycle. This keeps things looking bullish, and…
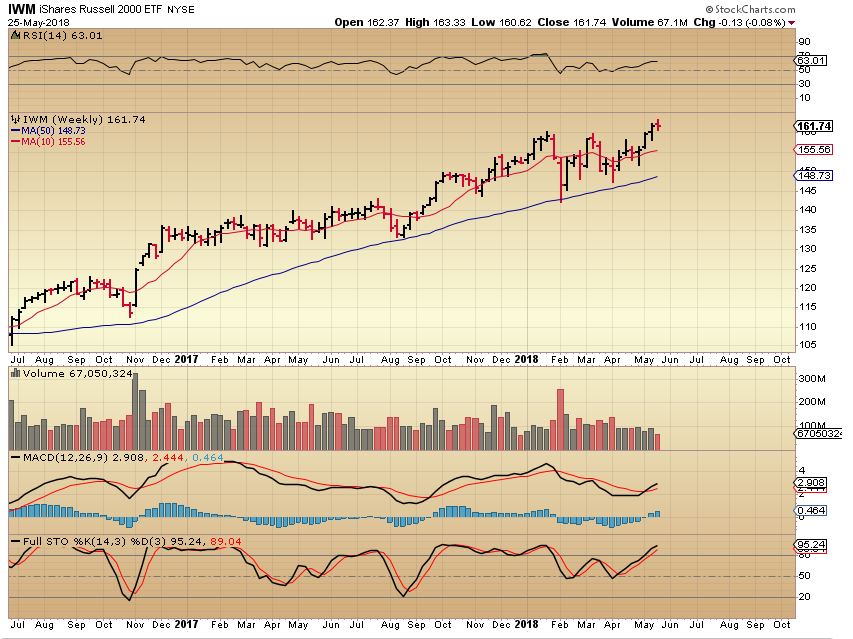
IWM – And the RUT or IWM are at new highs. The General Markets remain bullish.
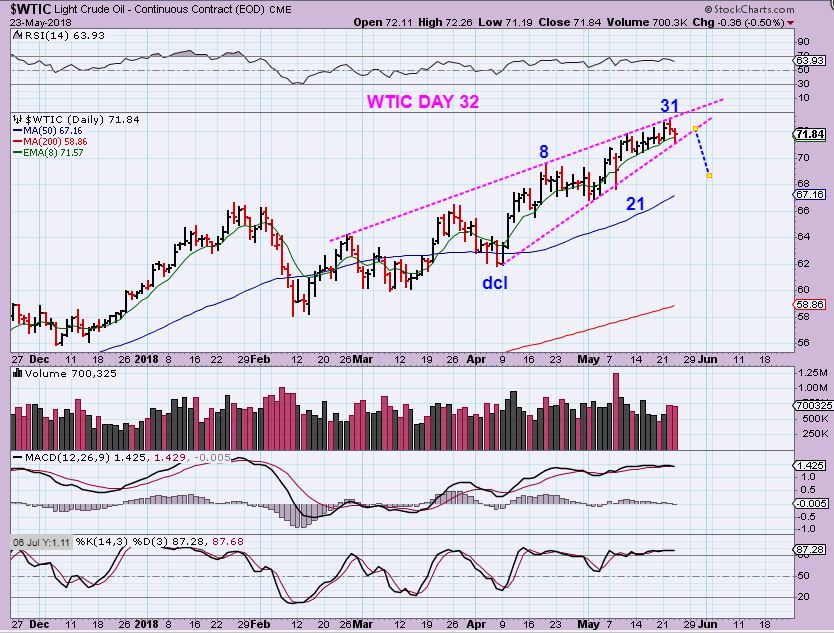
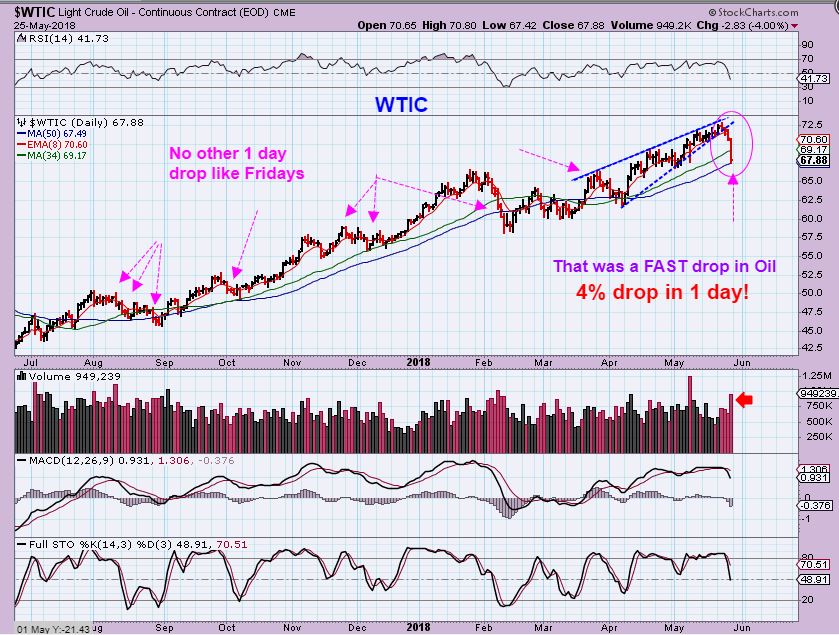
WTIC – I’ve been waiting for Oils wedge to break down. I was looking at the 50sma as a target with Thursdays chart, but …
WTIC …but Wow! a 4% drop on Friday got us there pretty fast. I do not see a 1 day drop that large on this entire chart. Since the stochastics is not oversold, and cycle count does have room to drop, this could continue lower, so let’s see what Monday brings.
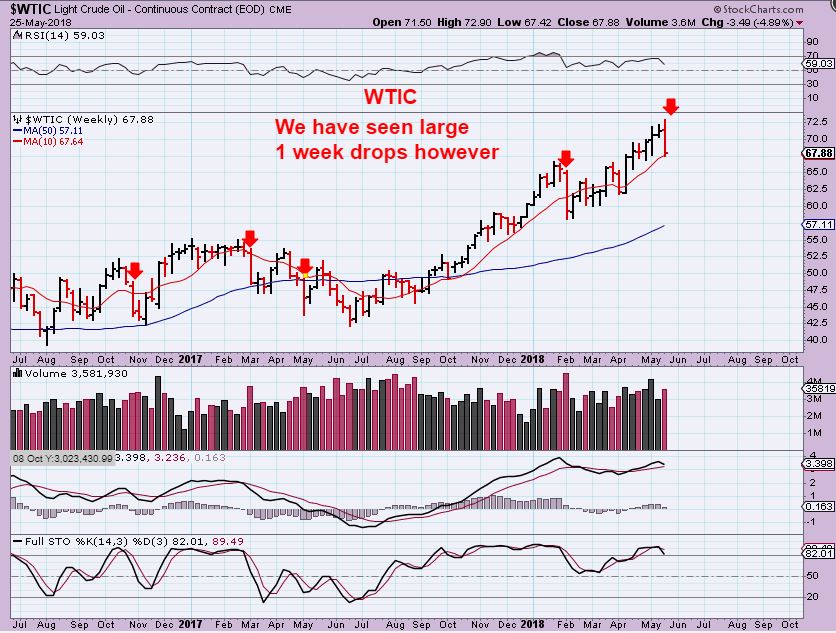
WTIC – On the weekly, we have seen a drop that large, it just took an entire week. So the weekly shows some sharp drops that often capitulated selling and then it formed a low shortly after. We will continue to monitor this area next week.
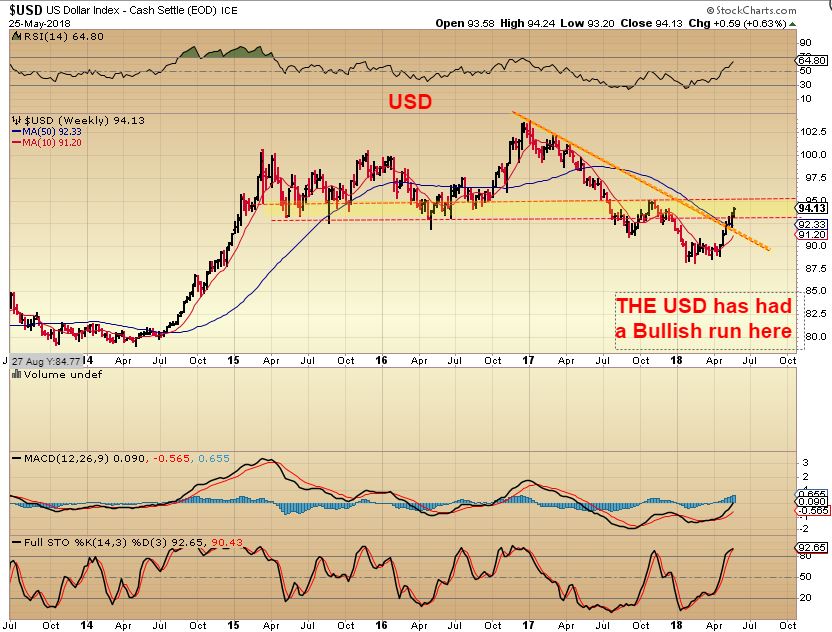
The USD has had a BULLISH RUN out of this years Lows. Is it concerning for Precious Metals? It could be if the run continued, but I am not concerned yet, and I will show you why in the rest of this report…
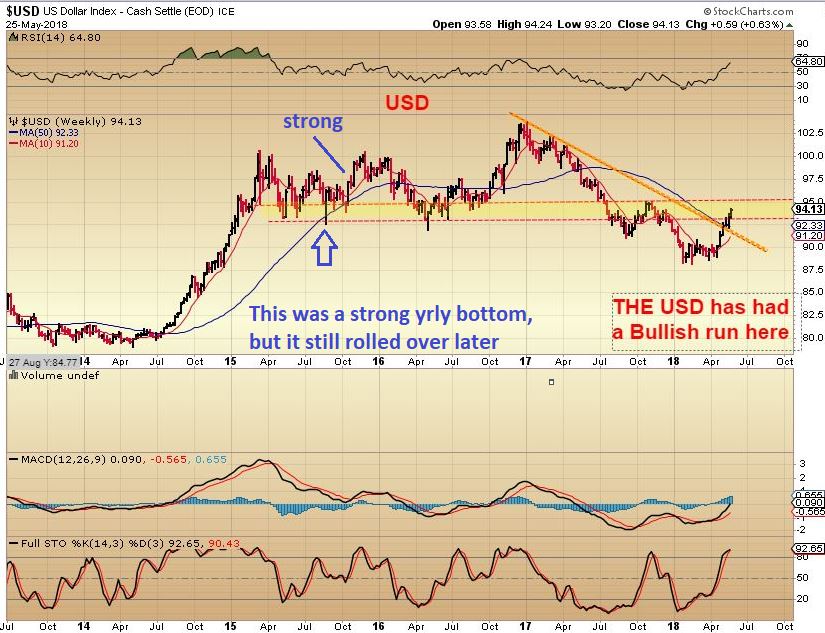
USD -The USD broke a downtrend line, and that is often bullish. I still see it currently reaching a resistance zone. The USD appears to have put in a major yrly bottom, but that does NOT mean these are THE lows and that it cannot roll over again. For example…
USD – The yearly low in 2015 ( blue arrow) rallied strongly too and in a similar manner as what we see now. Notice that it went sideways for weeks at the lows and then took off higher, just like what we are seeing now, but it still rolled over after that rally. This rally should still do that too. I will show you why further in the report. Also, take note of this…
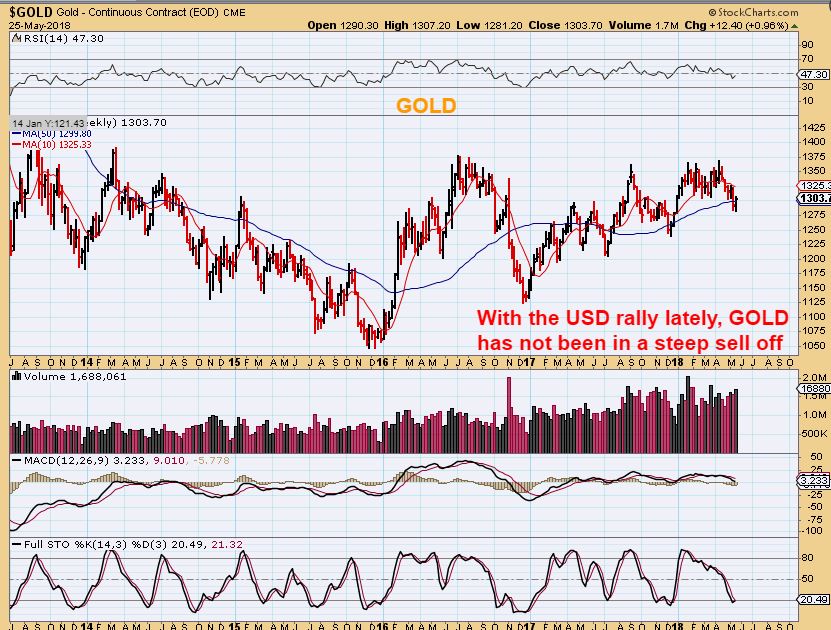
GOLD WEEKLY – Gold is not exactly crashing as the USD is rallying here. This is a normal pull back so far, with a series of higher Lows for Gold at each ICL. And take a look at this…
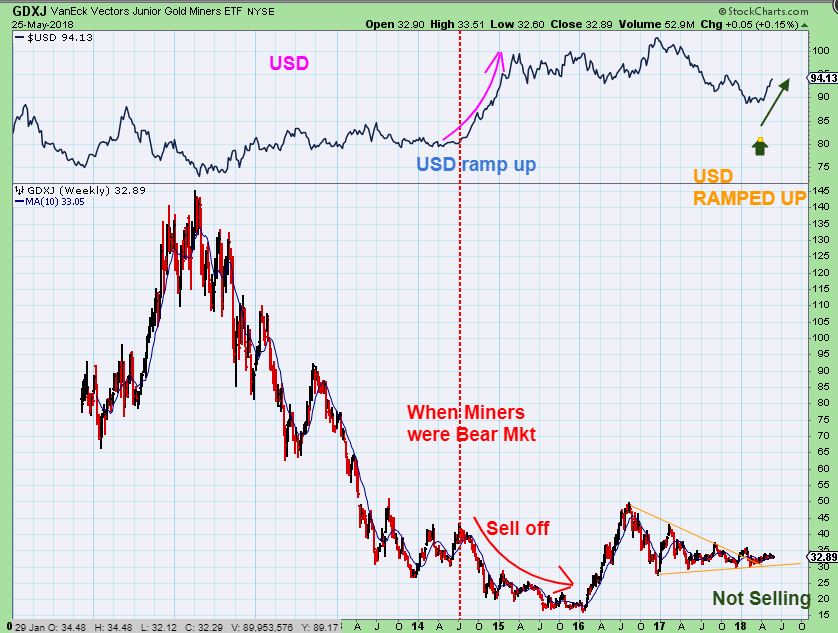
THE USD IS IN THE TOP BOX, GDXJ IS THE MAIN PICTURE.
In 2014-2016, when Miners were in a bear market drop, GDXJ dropped sharply when the USD started rallying. Now the USD is rallying, and GDXJ is also rising within this consolidation. The rally in the USD is not affecting the Miners Bigger Picture scenario here. It may be stalling the break out, but this is all a matter of time, in my humble opinion.
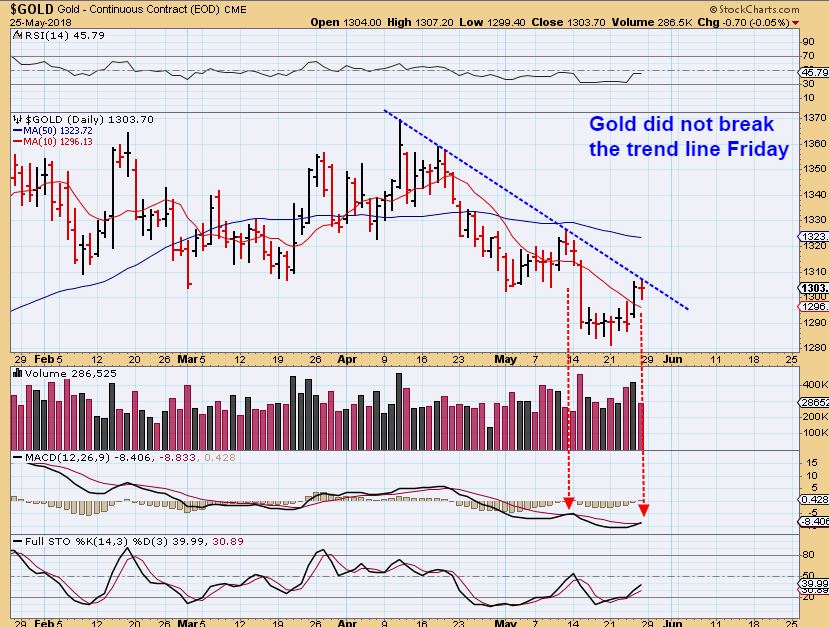
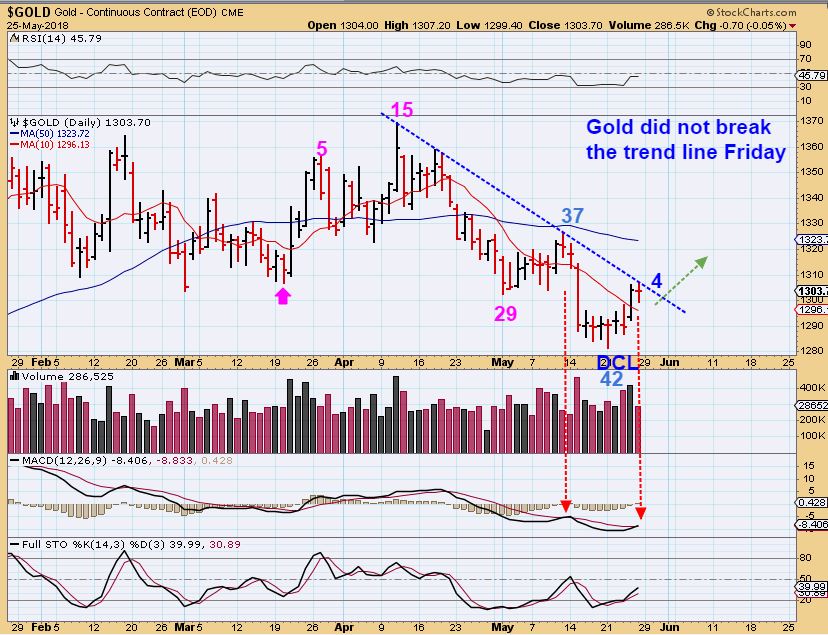
GOLD – Last week I was watching for a downtrend break in Gold to confirm whether or not a daily cycle low took place. We did not get that break out Friday. The doji type cross candle Friday looks like the one right before the sharp drop a over week ago at the trend line too. That adds caution to the picture, until we get that break out. So this is neutral, but I do have a Bullish Gold chart coming soon 🙂
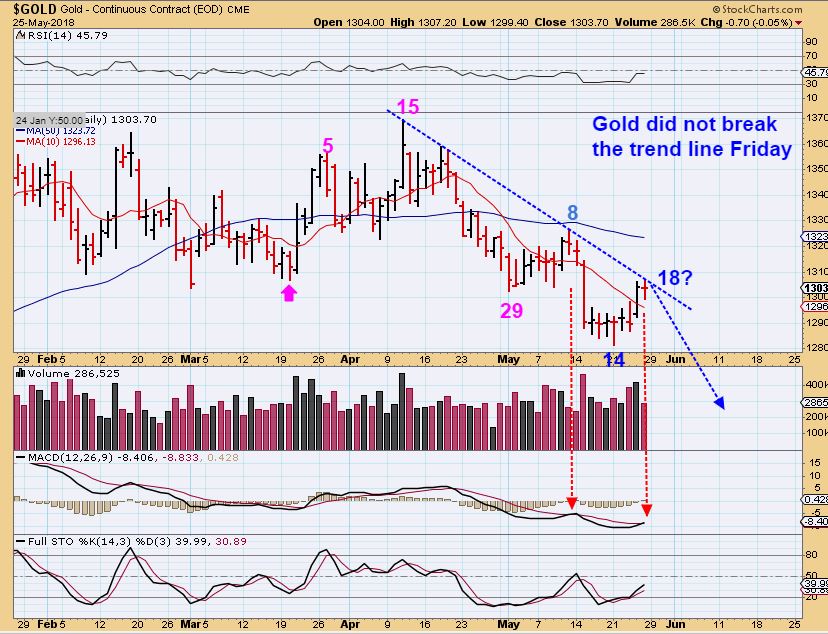
The cycle counts can be counted 2 ways, as pointed out in prior reports. I will post updated charts of both possible cycle counts below, see if you can follow the thinking here.
GOLD CYCLE COUNT #1 – This has gold day 29 as a DCL. Why? Because it closed above the 10sma shortly after that low. With a day 8 peak it dropped to a new day 14 low. I would then call day 14 only a 1/2 cycle low and now we’ve bounced to a day 18 with another drop into an ICL coming. THIS IS 1 IDEA, with 1 more drop to a new low to follow.
GOLD CYCLE COUNT #2 – This does NOT call day 29 a dcl, despite the close over the 10sma, because the trend line was never broken. So this would show a continuation of that daily cycle. We have day 29 as near the middle of a long daily cycle, with a bounce to that trend line on day 37, and a final plunge to day 42 as a possible ICL in place. Next we need to break above that trend line Sunday or Monday ( or soon) to confirm. Being rejected at the trend line Friday seems bearish, but here comes the bullish chart…
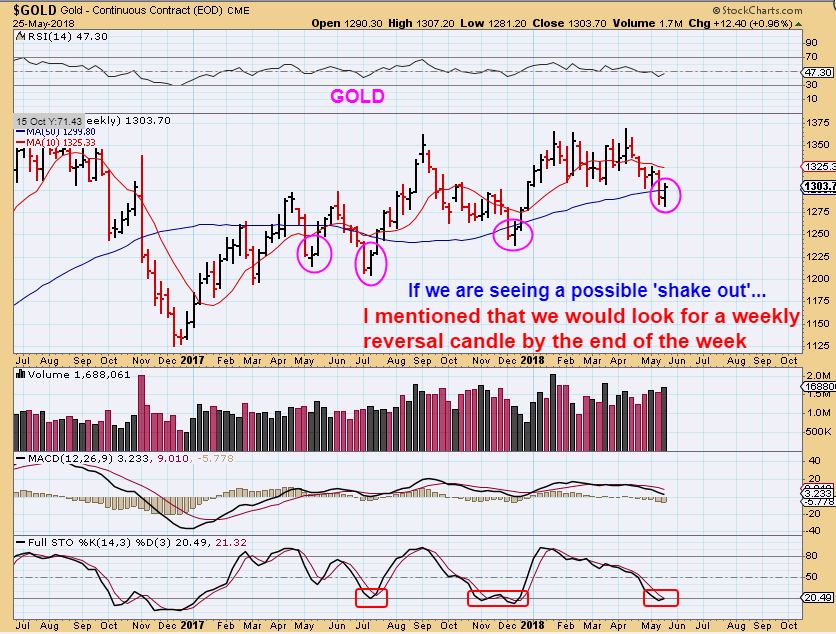
Being rejected at the trend line Friday seems bearish, but the weekly chart actually has a bullish look, one that I said we would watch for in last weeks report.
GOLD WEEKLY
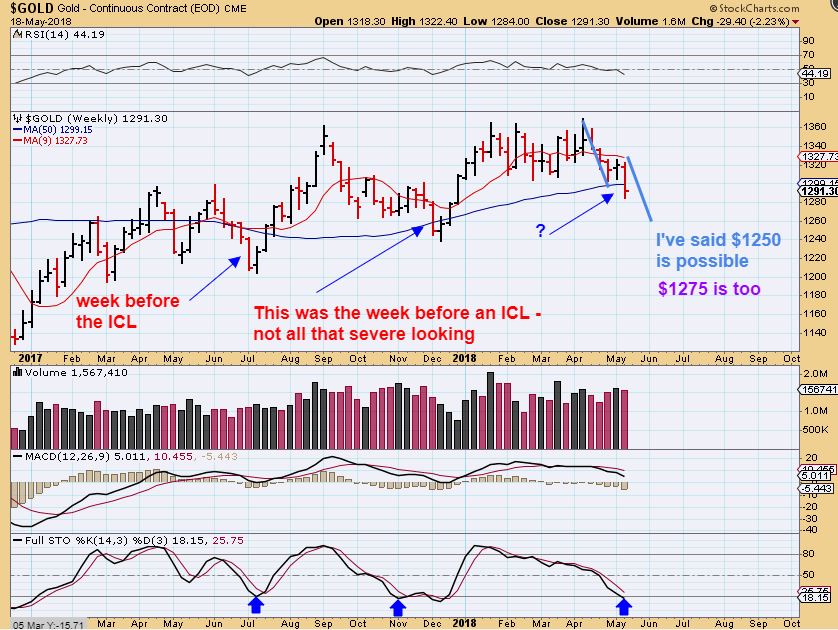
Last week, on May 18 I posted this weekly chart, showing that the last ICLs broke below the 50 weekly ma, and reversed higher the next week. THOSE WERE SHAKE OUTs to run the stops. I said that this week we would look for a reversal candle recovery as a possible ‘shake out’ this week too. So I was watching for this…
GOLD WEEKLY – Look at that. We actually got one, with Gold closing back above the 50 week sma. That is a Bullish looking chart. Even though Gold was rejected at that trend line & sold off Friday on a daily, the weekly remained healthy. THIS COULD ACTUALLY BE BOUGHT WITH A STOP UNDER THE LOWS. We would expect Gold to break that trend line next week with follow through… time will tell.
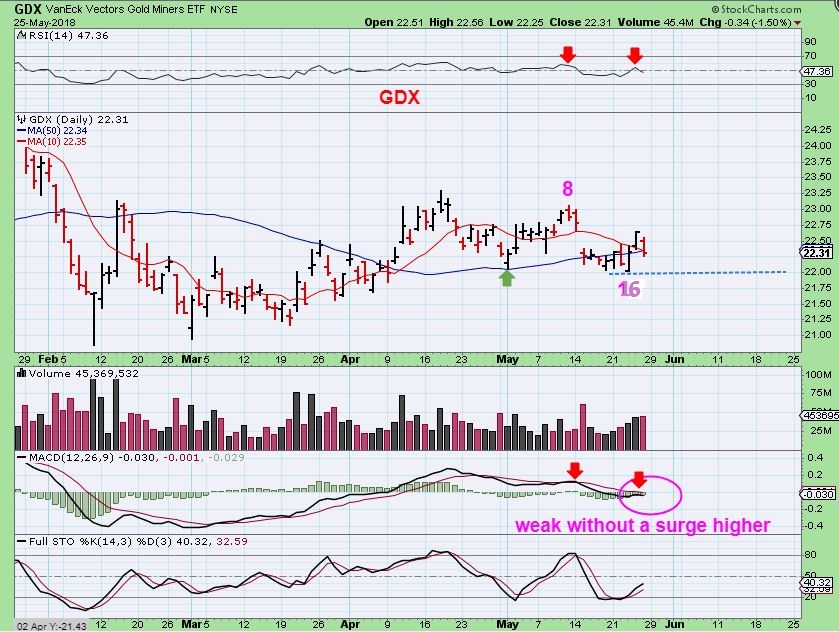
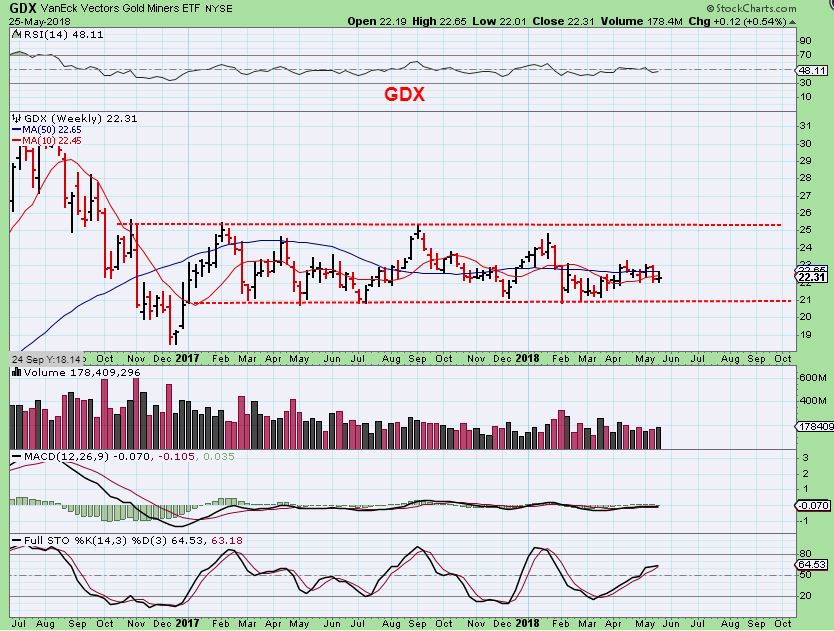
GDX – GDX actually made a new low on day 16, regained the 10 & 50sma looking rather bullish Thursday, and then lost both on Friday. Miners are out of sync with Gold, so I am using Golds chart for cycle count, and GDX charts as a stand alone observation. This chart is rather neutral after being rather Bullish Thursday. Let’s look at the GDX Weekly Chart too…
GDX WEEKLY – We remain basically stuck in the middle of a trading range or consolidation, as discussed for months now. I honestly would love to see 1 more drop to the lows near $21, and we could probably go in heavy at the reversal of that drop.
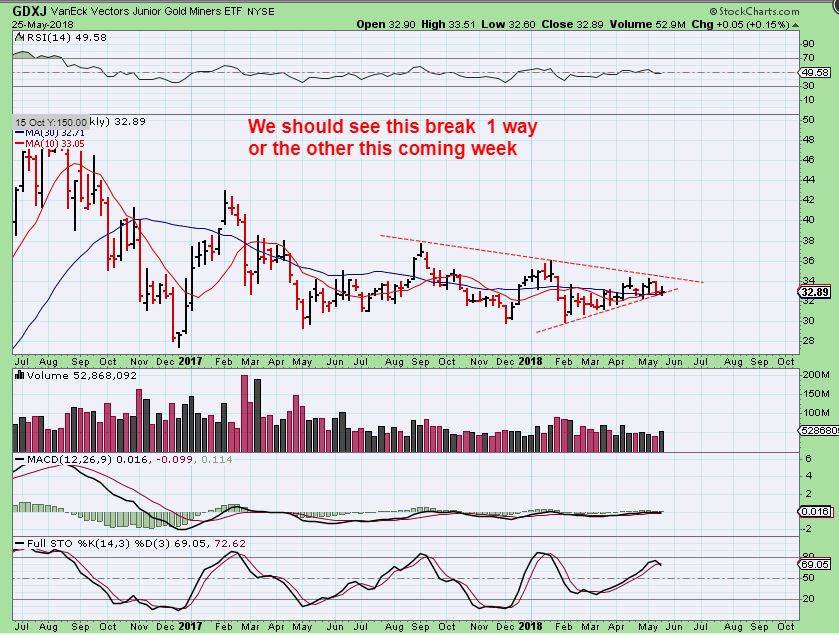
GDXJ WEEKLY – This will likely follow Gold, and this is ready to go one way or the other now. Will Gold break that down trend line inviting GDXJ to follow? Or will Gold break down, and will GDXJ follow? GDXJ remains stuck in the middle too, but this looks ready to go 1 way or the other this coming week.
One final BIG BIG PICTURE CHART
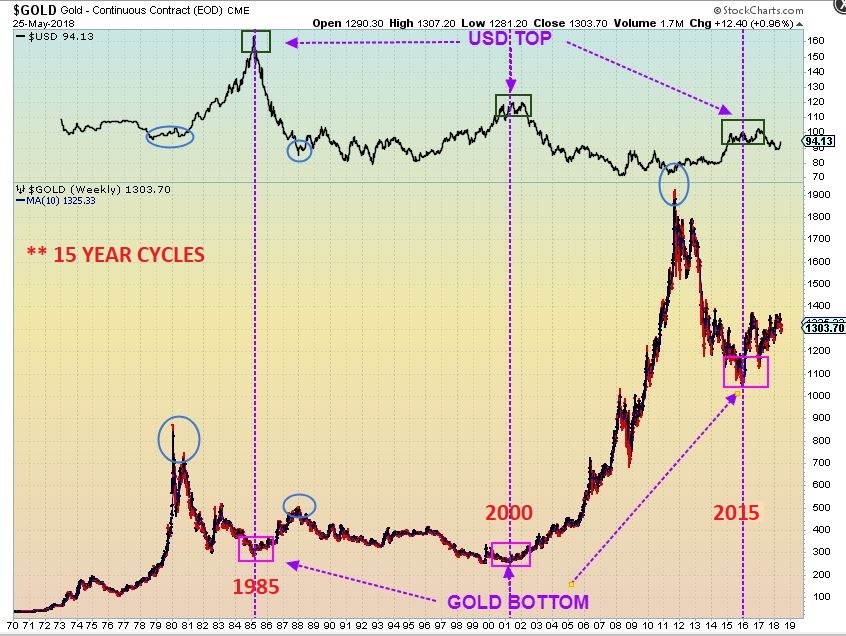
I showed this chart in January, but this is an updated current version, and it is showing that 15 year cycles are in play in the VERY BIG PICTURE. Every 15 yrs we see a topping process for the USD, and a Bottom for GOLD every 15 yrs. This is why we should have confidence that things will play out as expected. See the chart please…
,
GOLD & THE USD BIG PICTURE – 15 year cycles are at play here.
1. 1985 USD top/ Gold bottom. 15 yrs later…
2. 2000 USD top & Gold Bottom
3. 2015 USD topped and Gold bottomed in Dec 2015.
The above chart is showing a Bull market in Gold, coming out of the 2015 lows, trying to gain traction to break from a massive base. When it does, that set up in GOLD, SILVER, and The Miners should catch fire. I am expecting great gains as we cherry pick The Miners with the most bullish set ups. I think that the moves will be exceptional, much like 2016. That will be very rewarding for the patience that we have shown waiting for these lows to develop over the past few weeks.
I hope that this report has helped all of us to again refocus and look at the possibilities that I believe are coming our way. Enjoy your weekend, and if you need a little more evidence, I will add a few things at the end of the report too. 🙂
.
Edit for non-members: Thanks for reading along, I hope you’ve enjoyed the weekend big picture review. If you would like to sign up for 1 month, a quarterly, or yrly membership, please click on the link below. I usually have 5 reports per week, with the daily reports covering daily market activity and stock set ups if conditions favor it. The we have a weekend report similar to the one above. I also believe that an outstanding opportunity is approaching in the Precious Metals sector, and will be covering that extensively in the coming days and weeks too.
~ALEX
I have had some emails indicating disbelief by a few readers that miners will ever be bullish again, based on some ‘other’ things that they were reading. I am reminding all of us this weekend that this set up remains bullish and it feels much like a rocket on the launch pad.
Honestly GDX & GDXJ have been trading inside of a consolidation or trading range. Can you picture what will happen when it breaks free? This was my GDX April 20th chart, and yes, we are still trading in this area. This is boring people to sleep and causing doubt, but…
When this finally breaks out, we will be making incredible gains fast. Miners run like Cheetahs when they get going, so just like we did here in 2016, we will be catching Miners ready to launch and riding them higher.
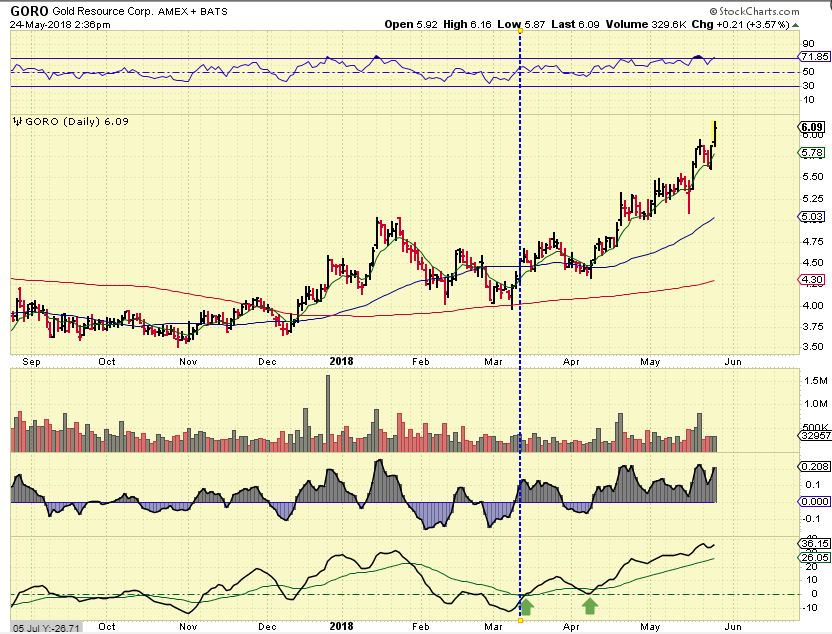
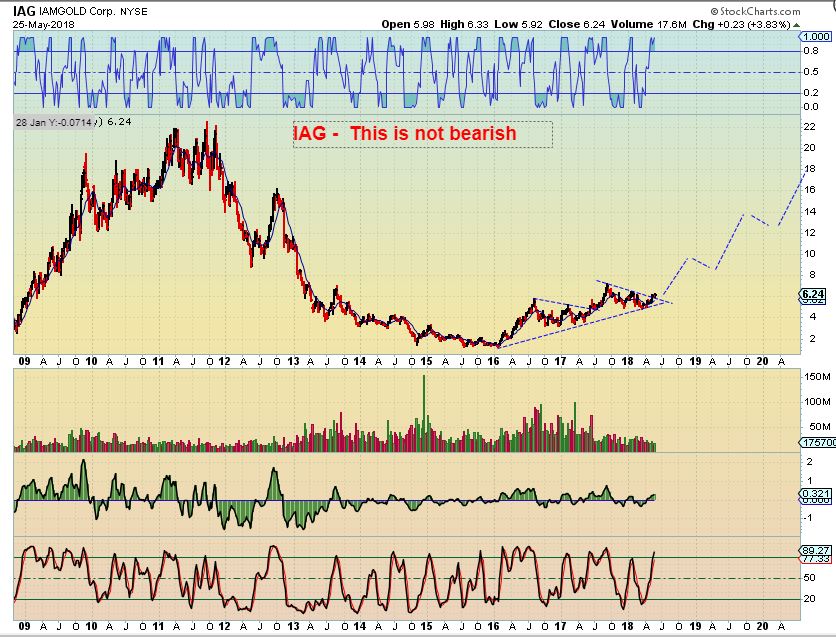
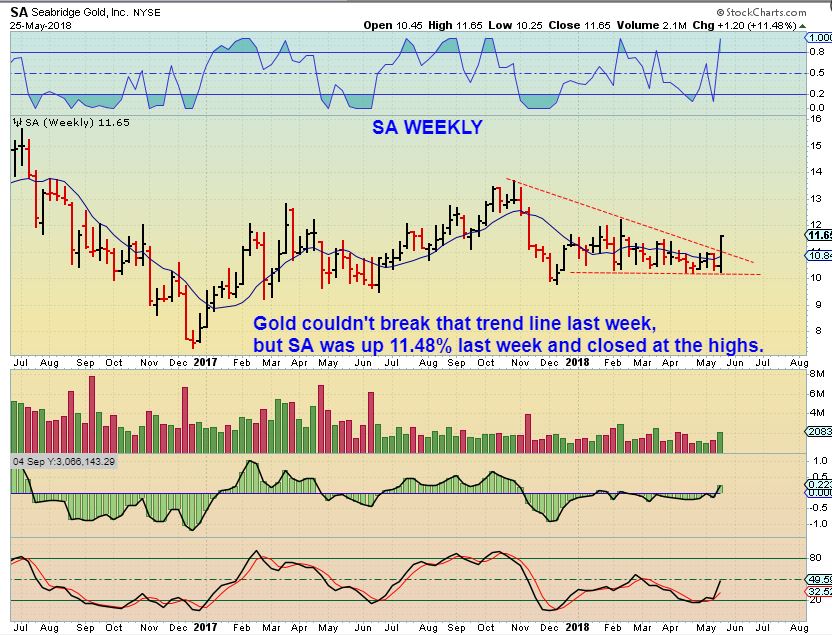
I have also already been pointing out in my reports that several individual Miners are already running and leading the way ( see GORO, KL, IAG, ETC, ETC, for example). That leadership adds confidence to my bullishness.
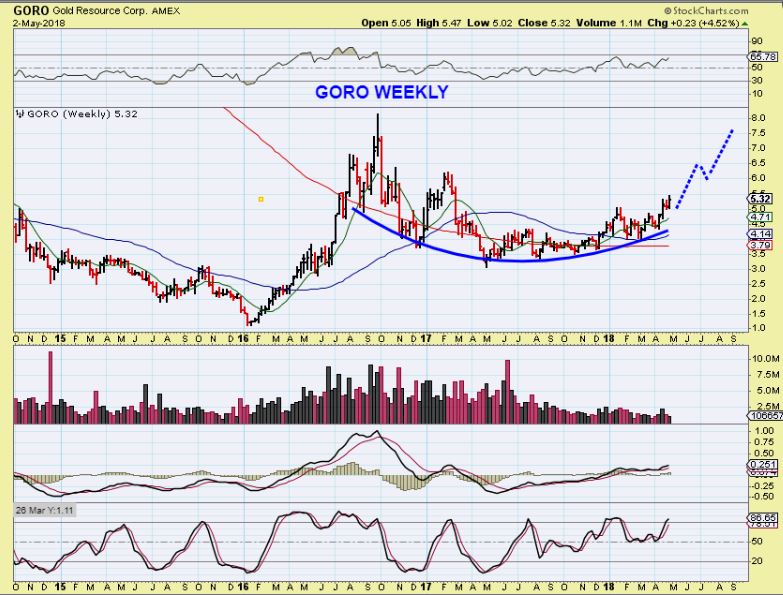
Look at GORO here on my MAY 3 chart. This set up was bullish rounding base pattern and set to run to $8 again.
GORO – It hit new highs on may 24 again. Miners like this are leading the way , in my opinion.
IF YOU THINK MINERS ARE ACTING BEARISH, WITH THEIR CHOPPINESS, YOU CAN ALSO STEP BACK AND LOOK AT SOME PROGRESS.
Yes, It may have been slow progress, but remember that GDX & GDXJ are still trapped in that sideways trading range. When they break out, I expect the gains to be more vertical again.


