I AM RELEASING MY PREMIUM EDITION WEEKEND REPORT TO THE PUBLIC, IT IS MORE OF A BIG PICTURE VIEW OF THE MARKETS, ENJOY!
In baseball, the simple call that this is ” The Bottom of the Ninth’ means that the game has entered the second part of the ninth and final inning. Unless there is another rally that extends the game, we reach The end of that game. For the team worried about going home with losses, it is the beginning of the end, unless this final opportunity provides a winning rally ( or at least extends the game into extra innings).
Could the General Markets be nearing that time? I’m not necessarily talking about THE TOP, but maybe the end of this winning run and a consolidation period would follow? Maybe, lets discuss this further.
.
In my last ‘Weekend Report’ we took a deeper look at the ‘Big Picture’, because we had additional views to examine at the end of March. This gave us not only a weekly view , but also the end of the months Monthly view, and also a Quarterly view. I went over that report today and it did point out that behind the beauty, cracks appeared. This week the cracks continued, and though I do not think that necessarily signals The End of the Bull Markets season, We could be in the Bottom of the Ninth for this run. Let’s look at our Big Picture View…
SPX DAILY – This is our daily cycle count, with the most recent low of the SPX still at day 34, and it looks like we have a dcl when it closed over the 10sma. Could that change? Unless buyers step in on Monday, I’d say that another ‘shake out’ dip below the 200sma is not out of the question into day 40 + and here is why I say that…
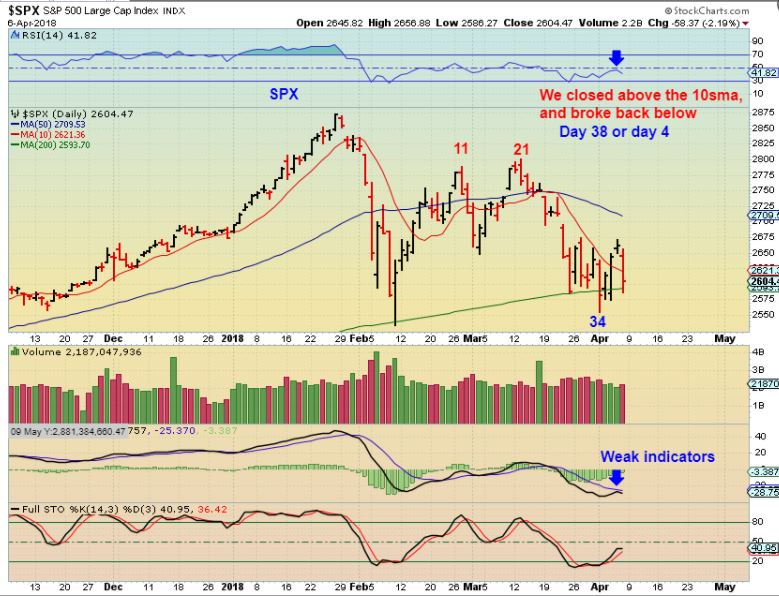
That chart of the SPX above should signal a Daily Cycle Low (DCL) on day 34, the lows should be in place since it broke & closed above the 10sma. That said, I want to review why it is possible that we could drop a bit more, but keep in mind that it should be very brief if we do.
DJIA WEEKLY- The DJIA actually took out Feb Lows and recovered, so I guess it shouldn’t surprise us if the SPX does that too. That would give us an ICL now & not in Feb. If not, we have a bit of a ‘mixed picture’ & will watch things as they go forward from here. Notice how the 10 ma was support & is now capping price. We need to see the DOW get back over that 10 weekly MA soon.
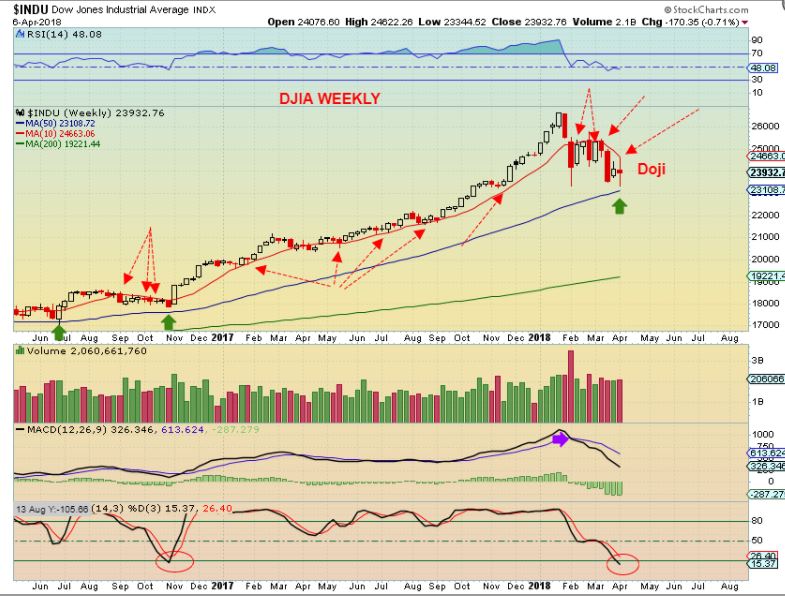
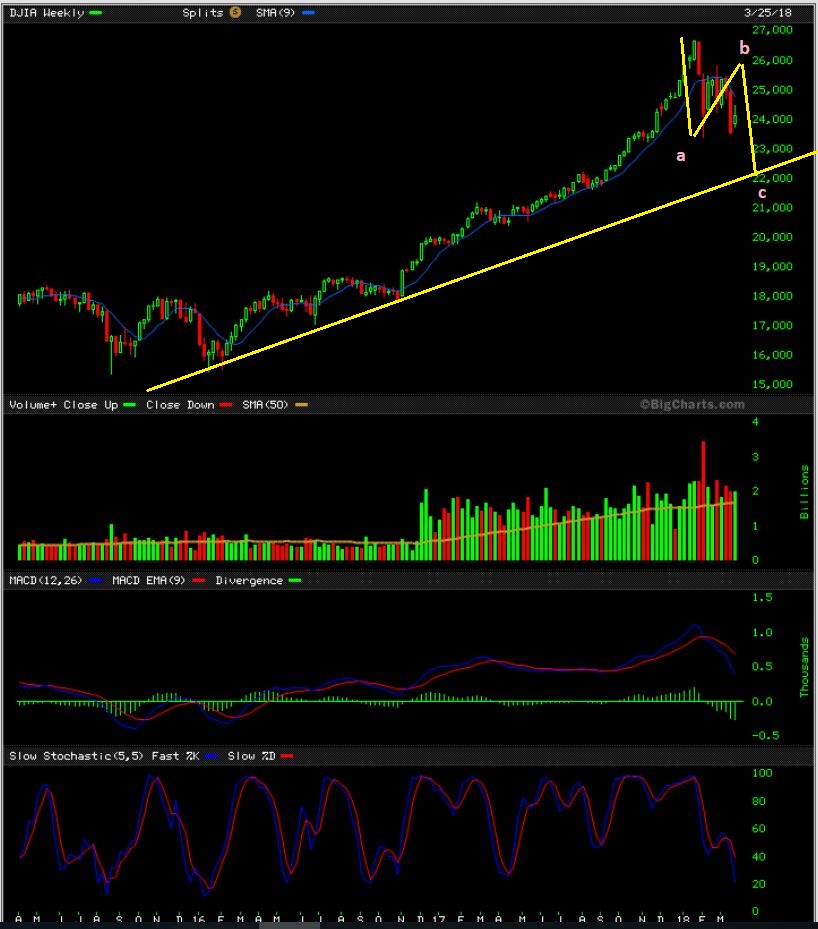
FROM LAST WEEKS WEEKEND REPORT – A WEEKLY a-b-c correction possibility was still possible, and we DID break to new lows this week, just not this deeply.
DJIA QUARTERLY – And a Friendly Reminder that I said that this QUARTERLY CHART has a High Volume Topping Candle. The Next quarter ends at the end of June, and these Markets could be sideways or lower by then. This chart really says a lot, so I will use it in future reports too.
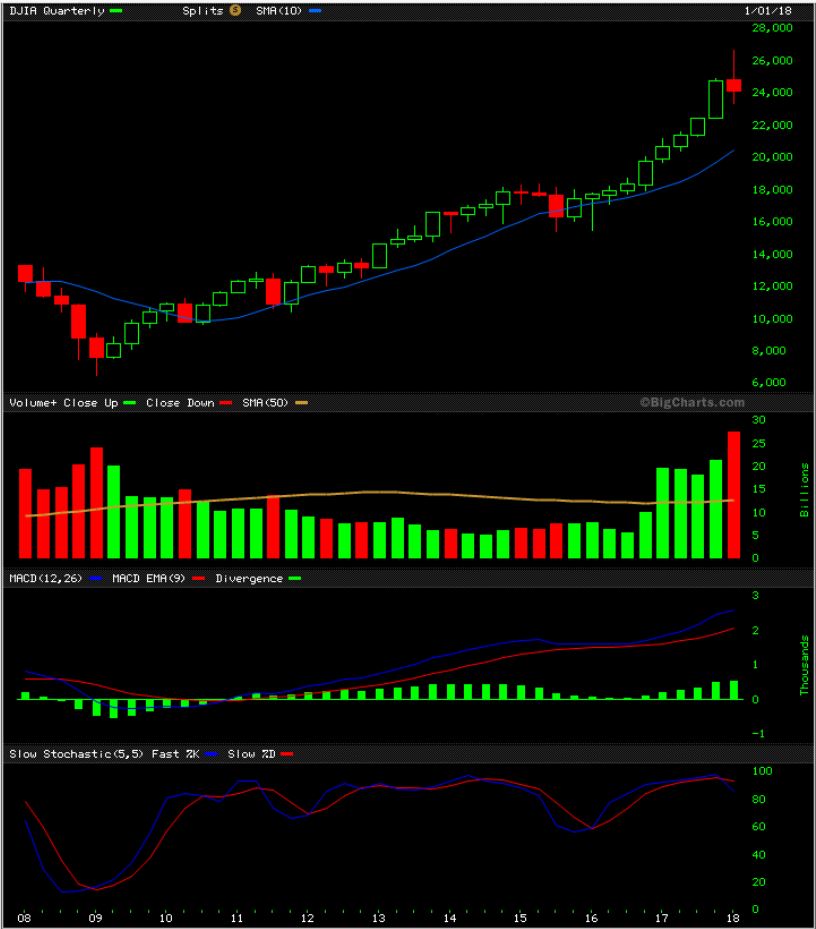
LAST WEEKENDS QUARTERLY, MONTHLY, WEEKLY REVIEW IS WORTH READING AGAIN, IN MY OPINION. If you have time, why not give it another look? 
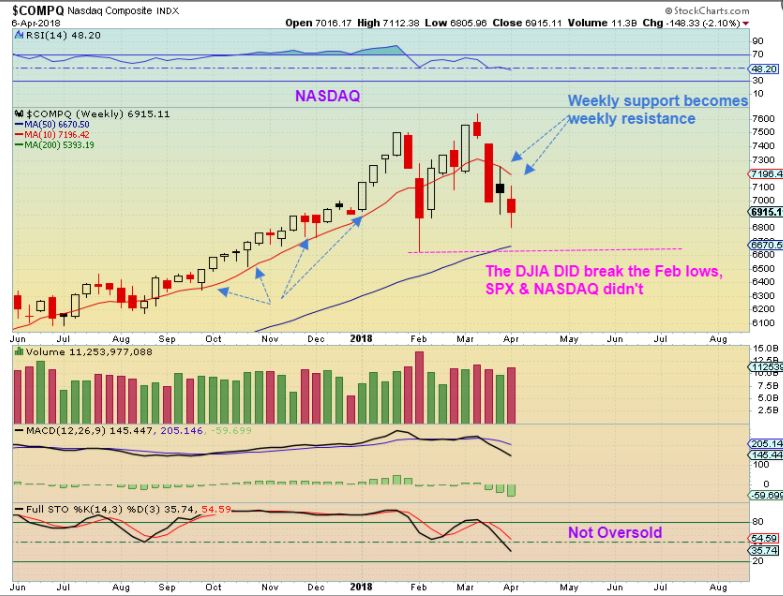
NASDAQ WEEKLY– The NASDAQ was strong and it even made new highs in March, so the recent lows are higher too. This weekly DOJI candle is a candle of indecision. This could drop to the 50ma next week, and that is at 6670, 245 from Fridays close. It was down 160 Friday, so 2 more days of that would do it. That dip is not not necessary, but you can see how it could happen in 2 ugly days.
IWM WEEKLY – The Small Caps have been holding up better, but they also didn’t RAMP UP like the DJIA did. The weekly MACD shows weakness even though the price went sideways, and that can be a big picture warning that things are changing.
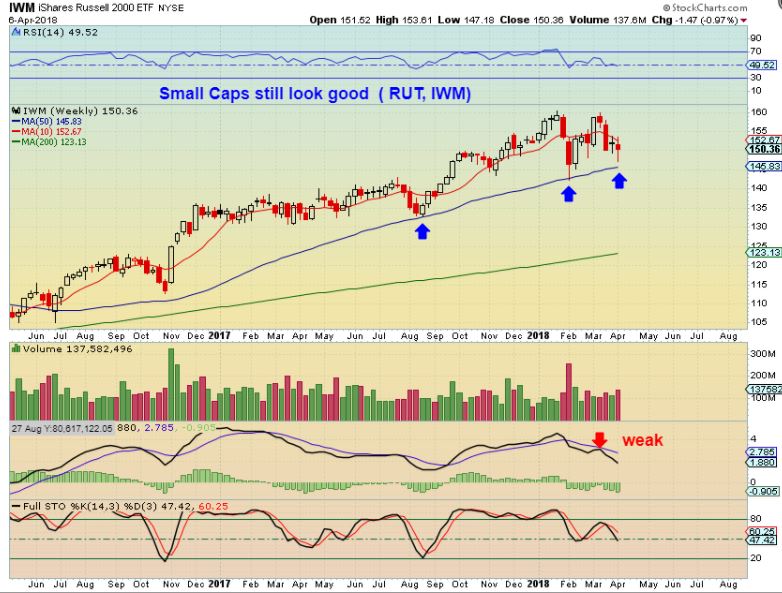
So this is what we may be seeing here, a ‘Topping process’ unfolding, or…
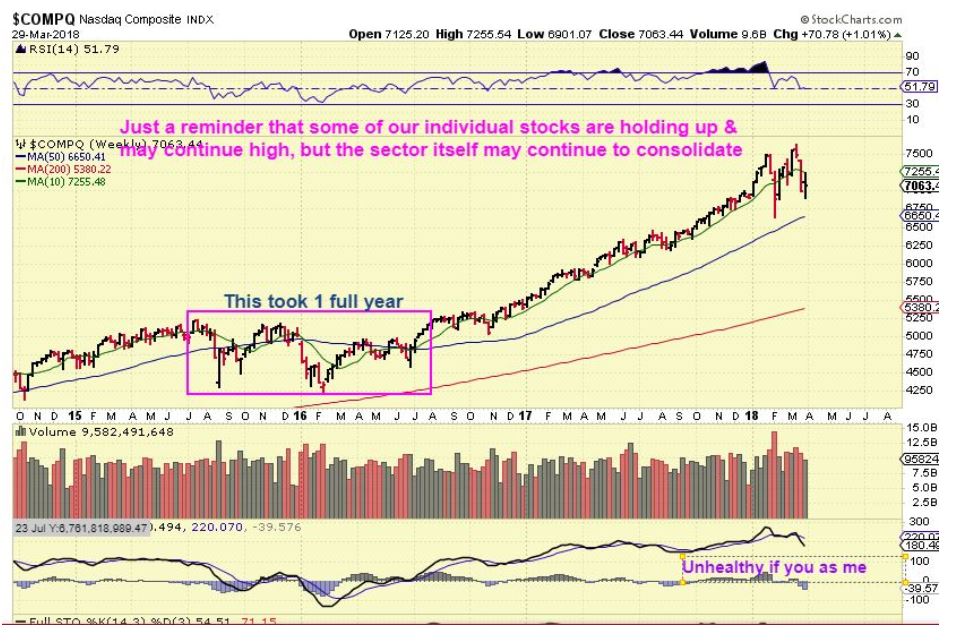
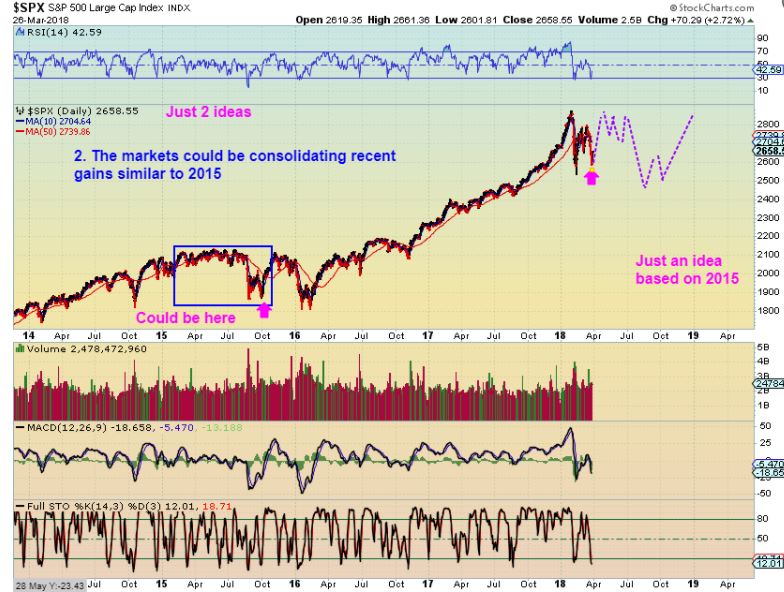
THE CONSOLIDATION – As I mentioned in last weeks report using this chart, we could simply be in need of consolidating the great 2017 gains. It doesn’t have to be a FINAL TOP, but it may become a long drawn out consolidation. Notice that these can take weeks, months, and even a year of choppiness, as seen on this chart.
WHAT ABOUT OUR BULLISH STOCKS RIGHT NOW?
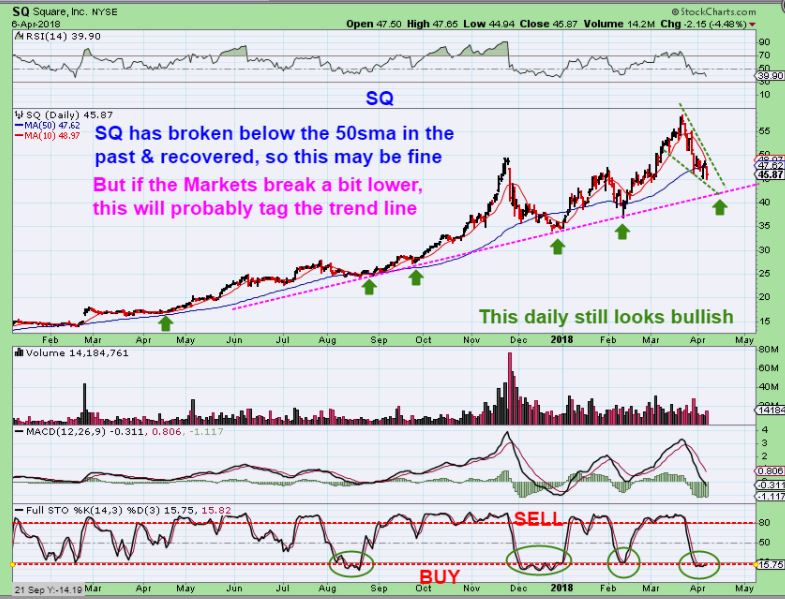
To be honest, they will need watching, and can drop further too. For example, I liked the way AQ, SAIL, IO, and a few others that we’ve been trading are acting with the selling in the General Markets lately. I own SQ too, and this was my ugly duckling simply because it closed under the 50sma Friday. So let’s just discuss what I see with SQ…
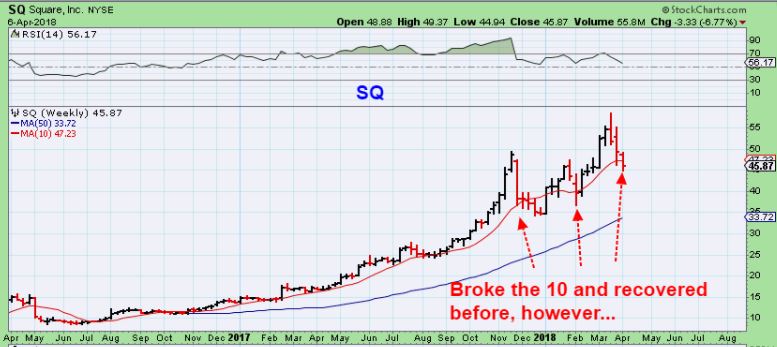
SQ DAILY – The daily is NOT bearish really, but it does have a possibility of falling lower if the Markets sell down further. You can see that it has done this and recovered in the past too. What about the weekly chart, since I usually get my early ‘heads up warning’ clues from the weekly?
SQ WEEKLY #1– At a glance, it has been a strong bullish run with a few drops & recoveries, but…
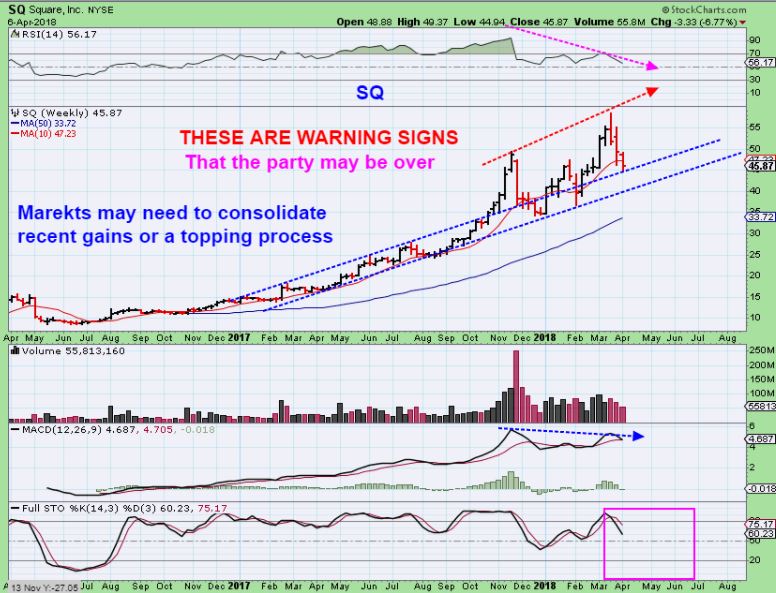
SQ WEEKLY #2 – Warnings Signs in the Bigger Picture appear here too, as pointed out here. Read the chart.
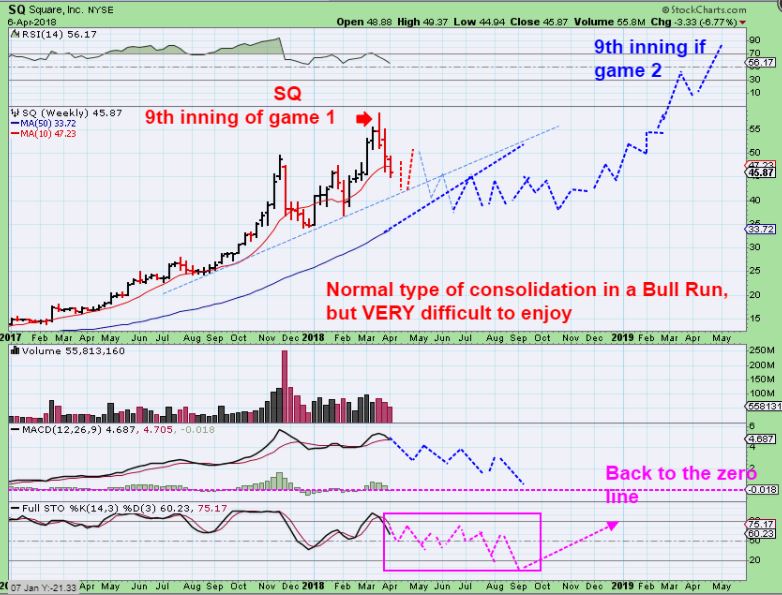
PLEASE- This next chart is –NOT A PREDICTION – it is a visual to help you to see what a ‘ normal extended consolidation’ can look like, and even how long it can take. This can apply to the current General Market too, if they consolidate recent gains.
SQ WEEKLY #3 – Just to be clear, this can be either topping or just consolidating these great gains. The Trump Tax Cuts are supposed to help the bottom line of many companies, so maybe they’ll consolidate like this, and then reap those rewards later, BUT THIS WOULD NOT BE A FUN RIDE OR EASY TO TRADE, RIGHT? I have drawn roughly a 1 year consolidation, but it even just consolidate through the summer & power higher in September, we just do not know.
NOT A PREDICTION, JUST A VISUAL IDEA FOR YOU TO CONTEMPLATE
On my March 28 chart last week, I again pointed out the prolonged consolation in 2015, and drew this as an idea of what that MIGHT look like now. Remember, The QUARTERLY CHART was a topping candle at this point, so the next quarter may show signs of stagnation. 2015 & 2016 had 2 double bottom lows. It is NOT FUN trading during a consolidation, but it did lead to a great Bull run later.
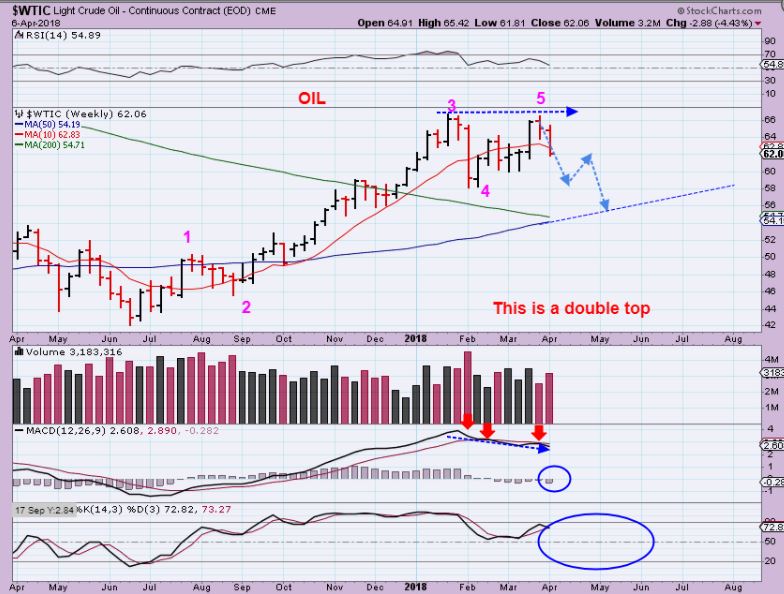
OIL WEEKLY – Oil has even more of a double top than when I mentioned it in last weeks report. I mentioned the extreme bearish COT and I shorted Oil via DWT , but I did sell on the inventory report. I do expect more downside for Oil, maybe in an a-b-c drop…
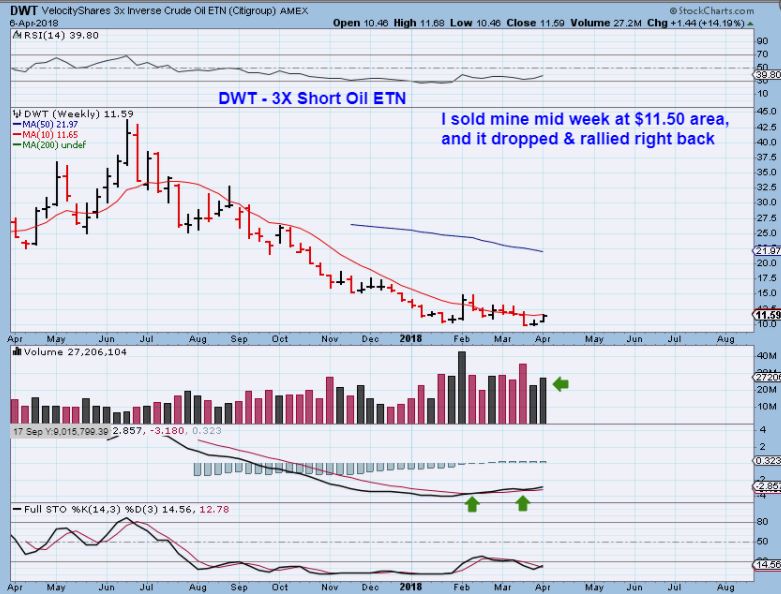
DWT WEEKLY – Note: Besides option plays, SCO (Ultra-short) & DWT( 3X ETN) can be used to short it. Some try to avoid ETNs due to risks associated with ETNs in general. .
I was in at $10, out around $11.50 and it dropped to the 10sma on a daily & bounced right back. IT is now higher than where I sold it. I may take this trade again, I will post it if I do.
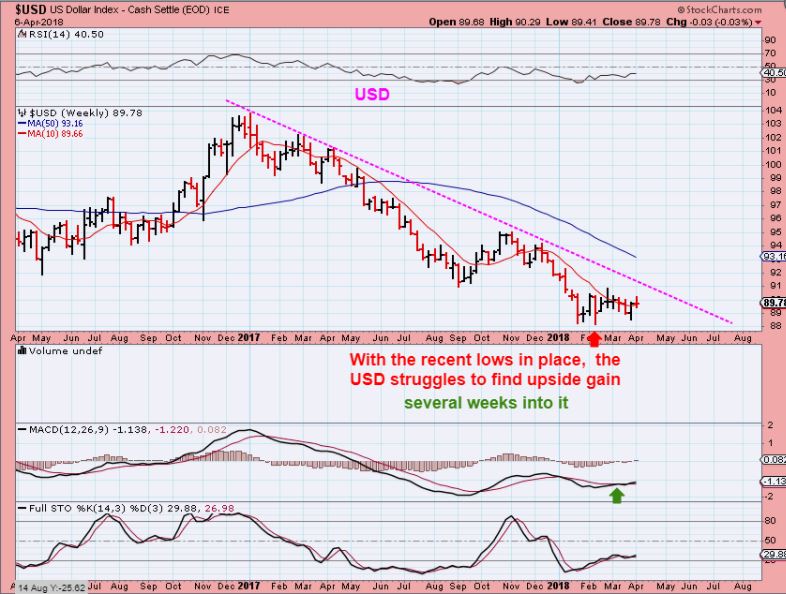
USD WEEKLY – I have been showing a chart like this week after week and the USD is just slowly grinding along the lows sideways. I am expecting a possible TOP in the USD, maybe at the next FOMC meeting at the Magenta line, this has been breaking down for a year now.
PRECIOUS METALS
I am expecting a very good buying opportunity in the coming weeks, maybe 1 month or maybe 2 months from now. The timing points to it probably happening around the May or June FOMC Mtg.
The way I am seeing things at this point is that the General Markets have had a spectacular run in 2017. If they are topping or even just going to consolidate, Big Money is going to seek out a nice low to put some money to work. I will obviously be covering this more & more as ‘time’ rolls by. Let’s look at precious metals…
FROM MARCH 16 – I was showing CYCLE TIMING, and when the next ICL should be due. Please read the chart
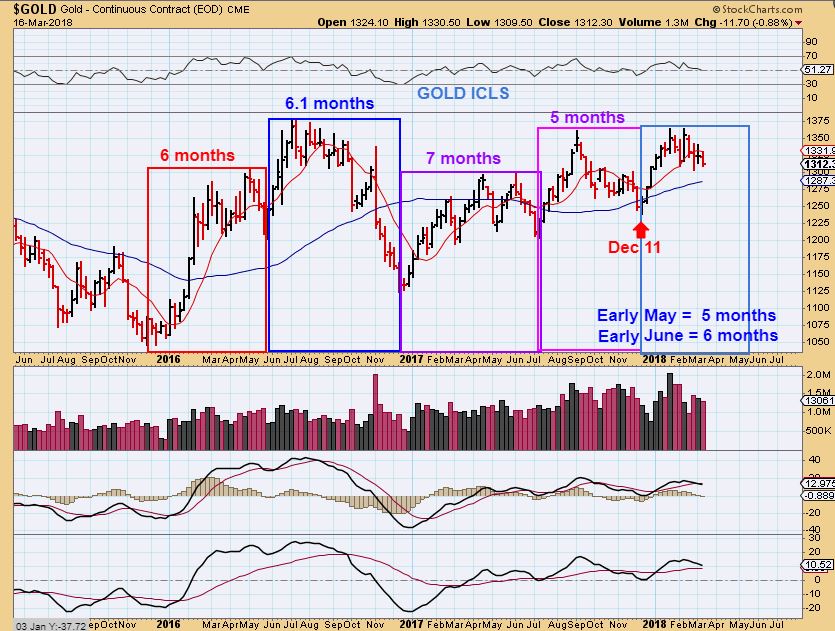
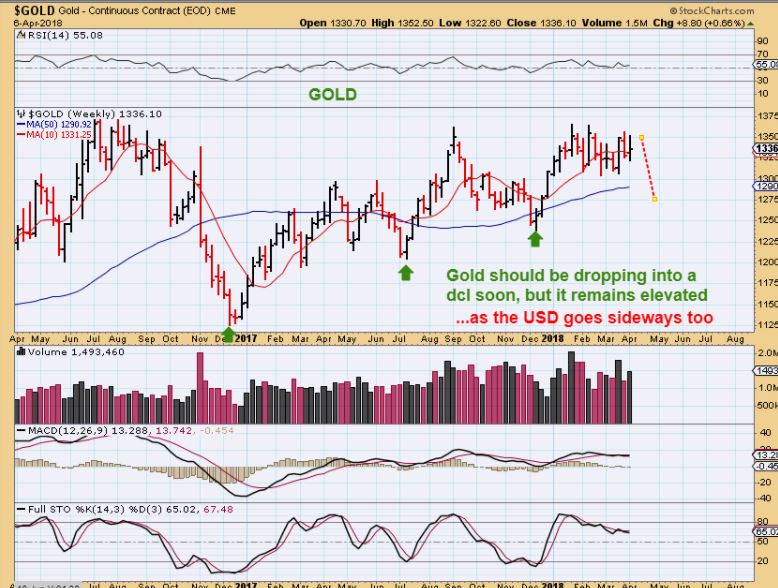
GOLD WEEKLY – We bought the DEC lows (The ICL) and soon I am expecting Gold to drop into a DCL & another ICL too (Intermediate Cycle Low). Gold has shown strength week after week since the recent Buy signal it the Dec ICL, but I think we dip before we break out.
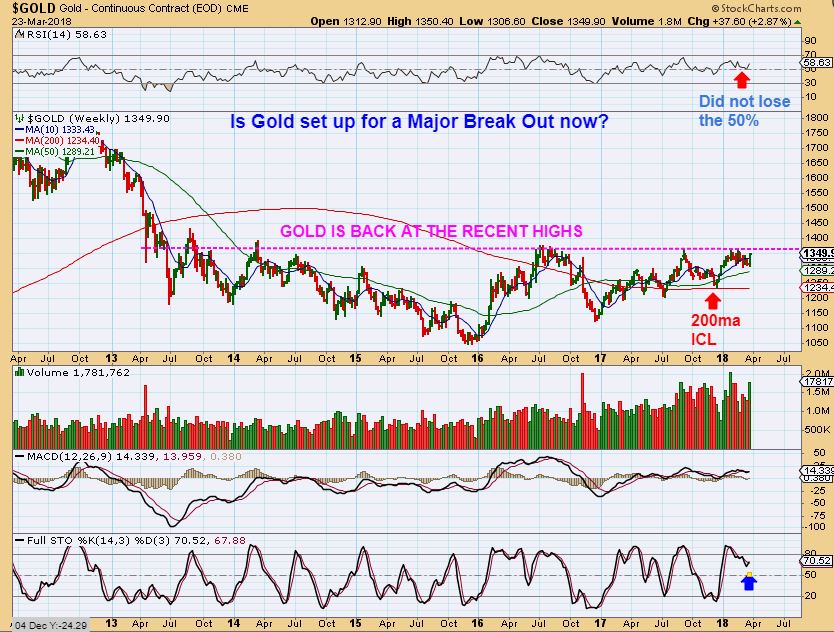
GOLDS WEEKLY LONG TERM BULLISH BASE
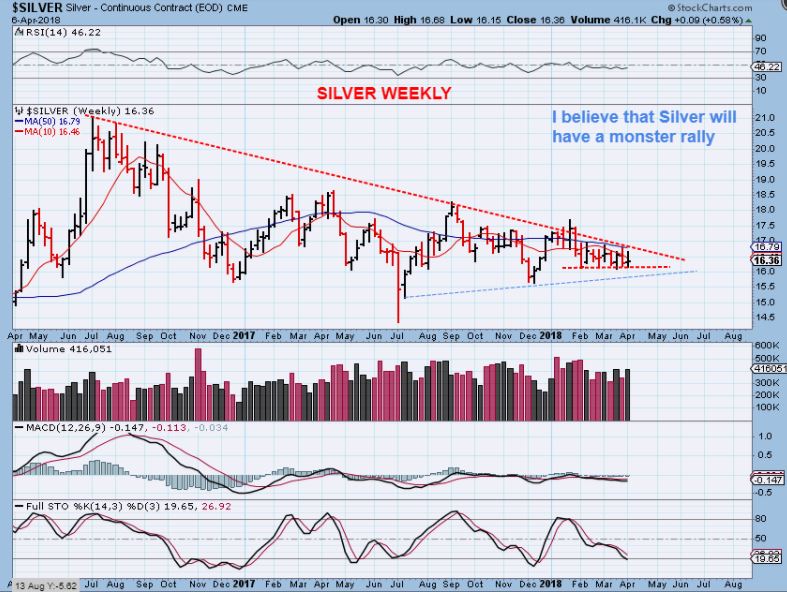
SILVER WEEKLY – Silvers COT is SO BULLISH and this tight squeeze is building up energy to carry on with a sustained move. It COULD do a false break lower first, but I DO NOT think that the extended move is going to be to continue lower. I am expecting Silver to do a major run higher.
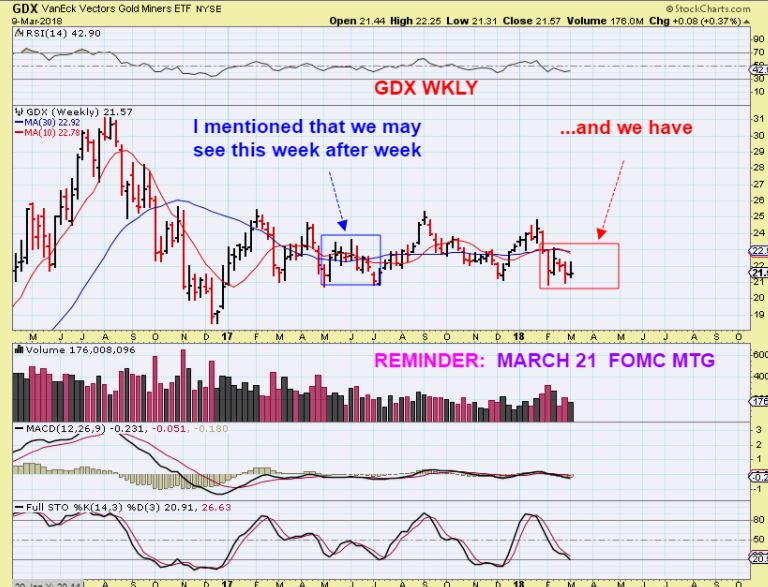
GDX WEEKLY #1 – This weekly sideways chop is exactly what I expected after the Miners did not break & launch higher with Golds Dec ICL. I said that miners would be very difficult to trade. Let’s review that chart from March 9th.
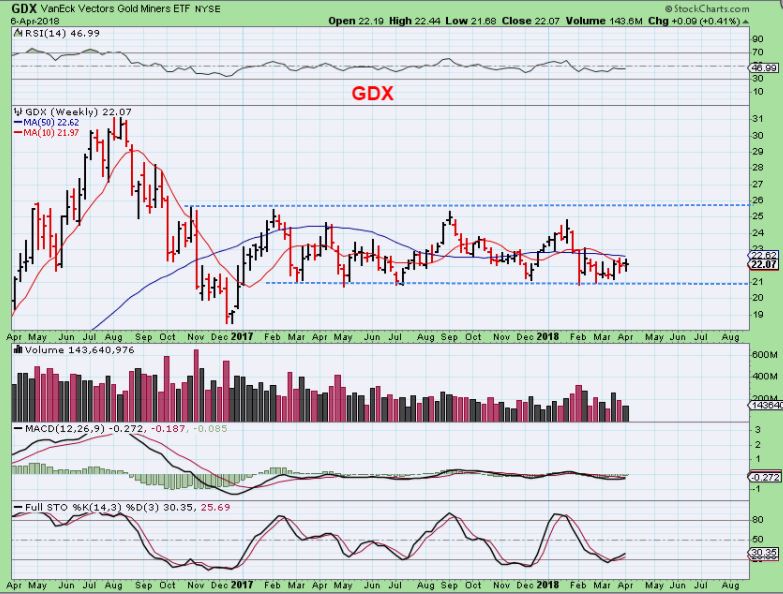
I HAVE TO ADMIT- When Gold bottomed in December, We bought a lot of miners, I showed a lot of bullish set ups here, and I had to expect that Miners would outperform Gold in a real Bull Run. Well, they did put in some nice gains in the first few weeks, but then continued this long sideways consolidation.
So on this March 9th Weekly chart, I pointed out that the SIDEWAYS CHOP (blue box) last year was probably going to repeat next ( red box) , UNTIL MINERS are truly ready to break out and produce a BULL RUN. See the chart below vs today, and that IS what we have seen.
GDX WEEKLY #2 – So you can see that we did only get the sideways chop, but what about the Bigger Picture? I believe that if the General Markets begin to top, chop, or consolidate 2017 gains, Big Money may be interested in this sector. Will we see THIS SHAKE OUT next? Maybe, but…
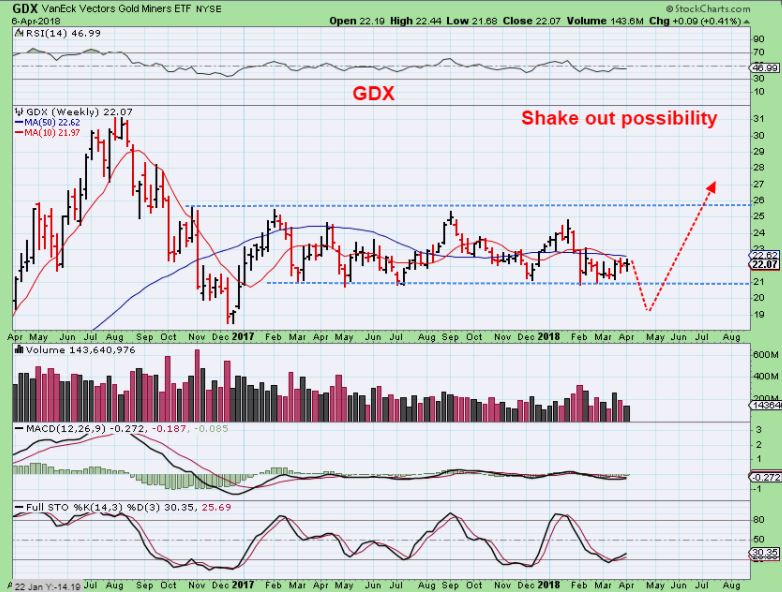
Have you also been reading everywhere that ” EVERYONE wants to buy that shake out dip that is coming in Miners???” I am a contrarian by nature. If Everyone is waiting for that dip, I would not be surprised if it takes off without them.
GDX WEEKLY #3 – Right now – Traders are bored to tears with this sector, and each ‘bounce’ is going no where, so they dont buy into it. Most are now just waiting for the ‘shake out move’ shown ABOVE. BELOW, They wouldn’t see this move for what it is, until it breaks above $26.
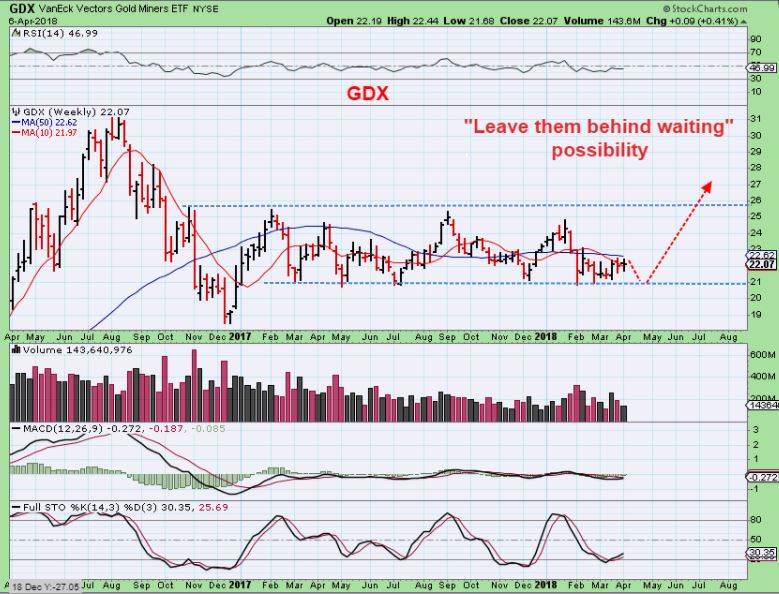
As you know, I have been and I will continue to monitor this sector, and we will be ready as the lows for Precious Metals get closer. I use many different methods combined with my own proprietary indicators to get us in at the lows. We bought the Dec 2017 lows, The July 2017 lows, etc. Most importantly, we caught THE LOWS of 2016, and that was a very strong rally that lasted for 6-8 months. Many of our positions were up 100% -400%, even 700% in 2016. This will be no different if this finally breaks out & runs, but for now? This consolidation in Miners is likely to continue until Gold puts in an ICL.
Again, I will be watching all of these sectors going forward. The daily reports cover all of the day to day finer details, while the weekend reports like this one generally covers most of the Big Picture Views like you see here. If this is the ‘bottom of the Ninth’ for the General Markets, even if they are just about to continue to consolidate recent gains, this could also be where the 2016 Game in precious Metals resumes moving higher. We’ve had a few slow innings recently, maybe even a rain delay, but the heavy hitters may be on deck and ready to go to bat. If that is the case, we will be ready to Play Ball too!
Thanks for being a Chartfreak with me, and enjoy the rest of your weekend!
Edit for non-members: Thanks for reading along, I hope you’ve enjoyed the weekend big picture review. If you would like to sign up for 1 month, a quarterly, or yrly membership, please click on the link below. I usually have 5 reports per week, with the daily reports covering daily market activity and stock set ups if conditions favor it. The we have a weekend report similar to the one above. I also believe that an outstanding opportunity is approaching in the Precious Metals sector, and will be covering that extensively in the coming days and weeks too.
CLICK HERE
~ALEX
April 8th – Bottom Of The Ninth? 
 April 10th – How Low Can We Go?
Scroll to top


Good morning, Alex!
Do you consider today as Day 14 for miners?
I recall your starting a daily count at the beginning of a break from a triangle, just curious if that’s still valid
Yes, the count is correct, but as I have mentioned – I dont use it as a dominant feature for Miners at this point. When triangles form – it often messes up cycle counts in various ways, and If Miners are not really tracking Gold – I use cycles for Gold & other methods to try to gauge what Miners are doing.
As you’ll notice- Miners are not following Gold, or they’d be at the highs with Gold. I’ve mentioned that I simply wouldn’t expect Miners to close above the 200sma, and if they do, they are strengthening when Gold should be ready to drop into an ICL. They could then possibly be starting to lead gold.
This was down for awhile. It just came back up.
Same here
We had to change the title & try to reload (So it is POSSIBLE that an email alert might say that there is a new report, but it was just us re-naming it so it would load). It was a glitch
It looks like the same title.