Is Bitcoin A Bubble Or Not? Blockchain Part 2
My last public post last week discussed Bitcoin & Blockchain trades. They have been absolutely explosive, some trades running up 300-500% or even more. On Monday (in my premium section) I then went over some of our current trades, and discussed the idea that Bitcoin could go parabolic and then crash down, so caution would be warranted.
Does a parabolic move and crash mean the end of Bitcoin? No it doesn’t, so before we get into a debate about whether or not BITCOIN is in a bubble, and whether a ‘Bubble’ phase means that this is the end of Bitcoin or not, please read on and then see how you feel.
The following is part of my Monday morning follow up on some of our Blockchain trades, and then I covered BITCOIN at the end of this premium report. You can skip right to the end to read about my thoughts on a BITCOIN BUBBLE if you wish. I am now out of some of these trades.
.
IMPORTANT NOTE: I started to write Mondays post on the weekend, and at that time BITCOIN was $7800 – $8200. BITCOIN just about reached $10,000 this weekend and on into Monday morning. We are now in an area where caution needs to be exercised. We may have a little more time with these trades, but maybe use smaller positions or trade less positions going forward, like possibly 1 or 2 blockchain trades & not 4 or 5 different positions like last week. I will explain my bitcoin thinking in detail at the end of this report, trying to answer the current question, ” Is Bitcoin in a Bubble?”
I also have been warning that as these trades ( Like RIOT) get extended, they will eventually stop and drop, so as a reminder, this is not a ‘BUY & HOLD’ for a month type of trade. These are starting to pop 30-60% a day or more. You must lock in gains on the way up or at some point, or you will risk giving it back. I sold RIOT in layers on the way higher, as mentioned in the comments section. Then I sold the 2nd half of my position at $23+.
.
THE TRADES AND THEN THE POSSIBLE BITCOIN BUBBLE
.
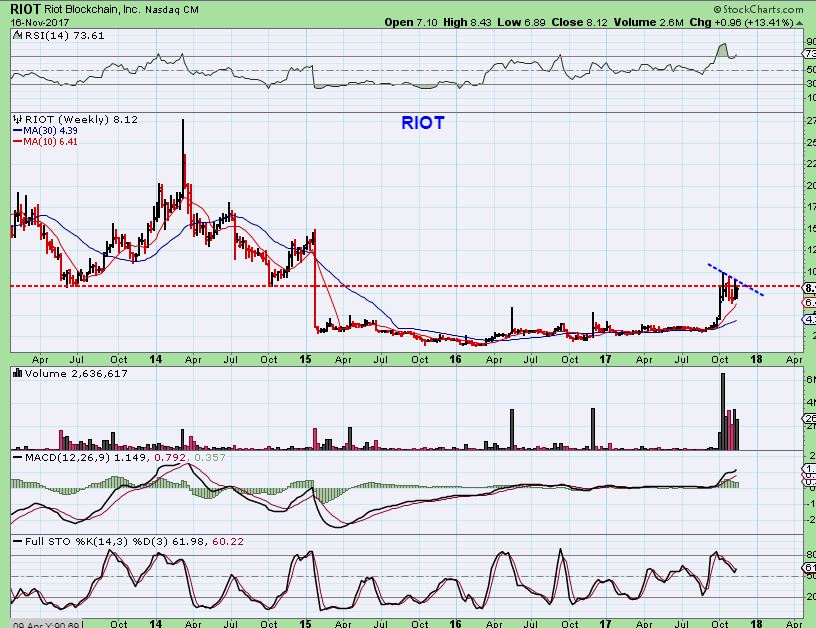
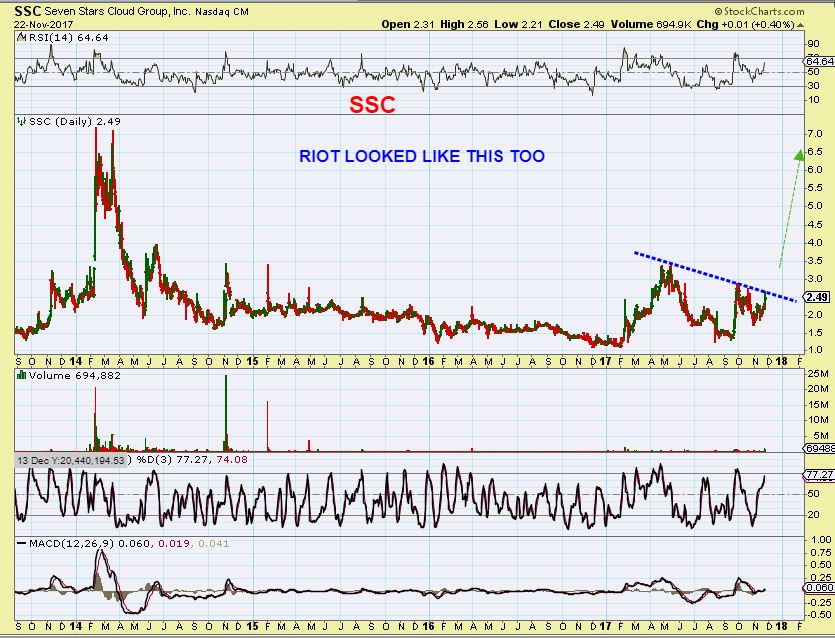
I used this chart to show how SSC looks a lot like RIOT did when I was first pointing SSC out. We bought this trade in Riot, and now know that RIOT has run up to $23+ so far. Picture RIOT at $23 now on the chart below. Wow! So now let’s look at SSC, which looks similar to RIOT …
SSC – This chart looked similar to the RIOT chart above it in several ways, so my advice last week was to buy it now or as it breaks higher. I mentioned that I owned it already too.
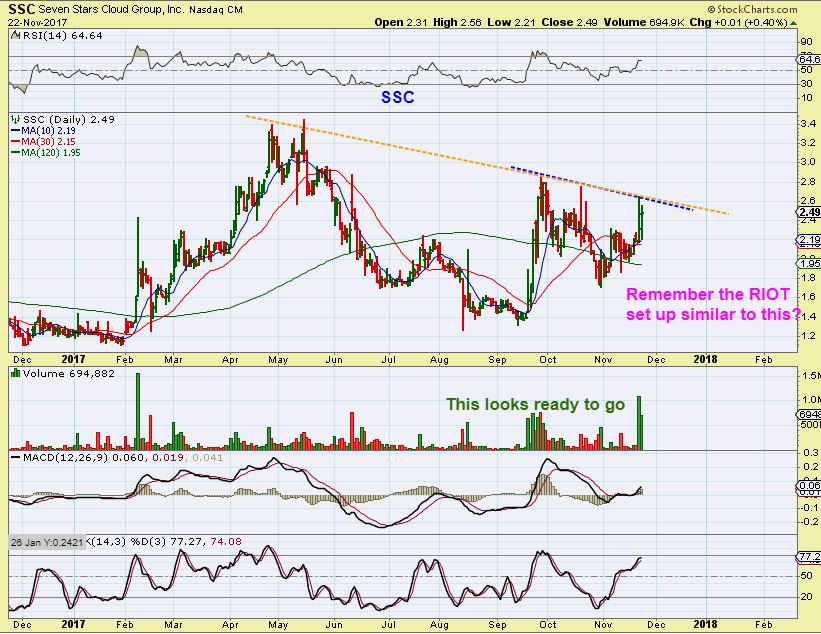
SSC – So this was the close up at $2.49, again buy it here or buy the break out.
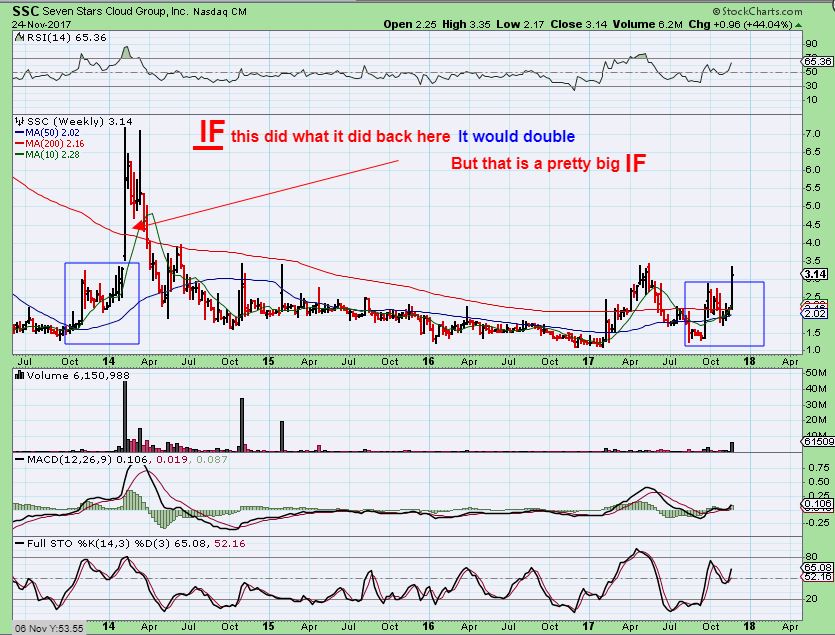
SSC – It just broke out on Friday, now above $3 and I expect higher price. This is a weekly chart and now I am comparing now to the run of 2014. It is SO difficult to recommend it now, since it just popped from $2.49 to $3.14, but if it acts like Riot, it will just keep running. If this surges like it did in 2014, it is a double even from here. NO GUARANTEES, DO NOT GO “ALL IN”, but it may make for a good short term trade.
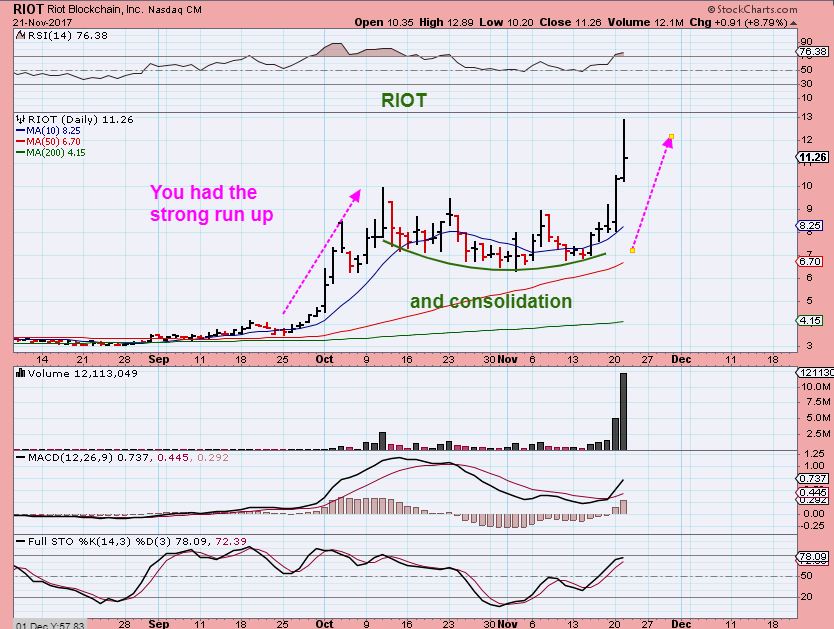
Now I want to use this chart of RIOT from an older report to show the break out taking place from that sideways consolidation. Again, we now know that this ran straight up day after day to $23+. Can we find a ‘similar’ looking set up? We are looking for…
1. A run up
2. A consolidation
3. a break out in this blockchain group?
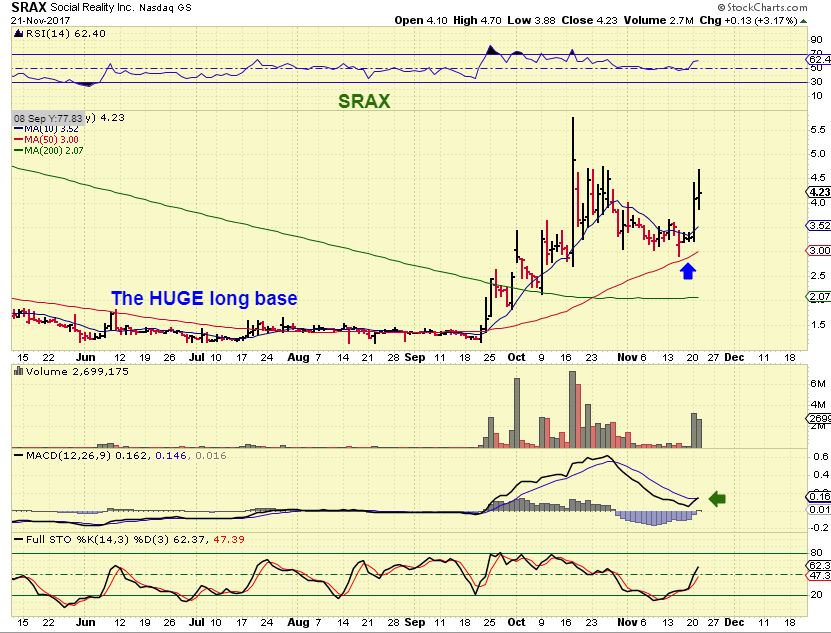
So I posted SRAX as a similar set up here ( and mentioned in a prior report that it was a buy and that that I bought it earlier near $3.50). It was s till a buy at $4.23 here. How is it now?
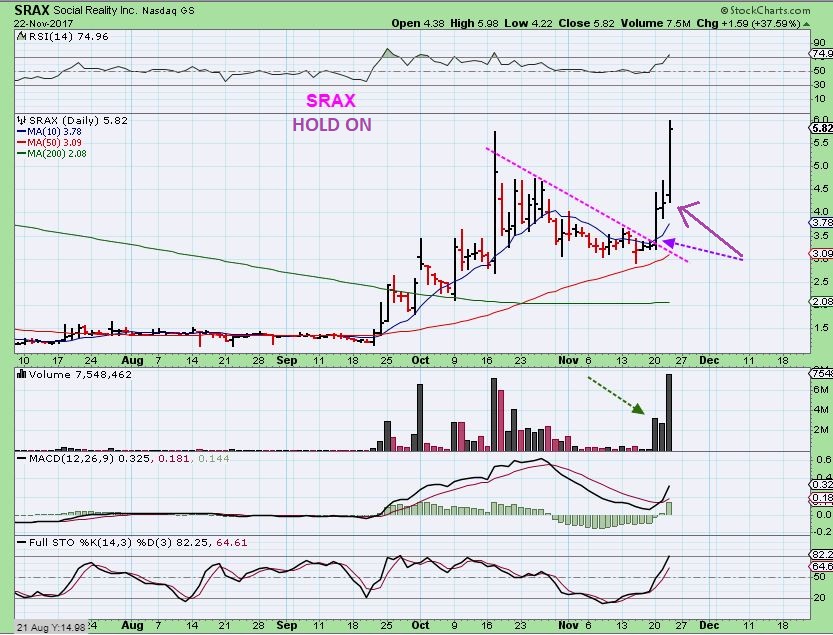
On Wednesdays report I said to ‘Hold on” to SRAX, because it was acting like RIOT, now up ROUGHLY another 38%, almost at $6. This obviously wont last forever, but …
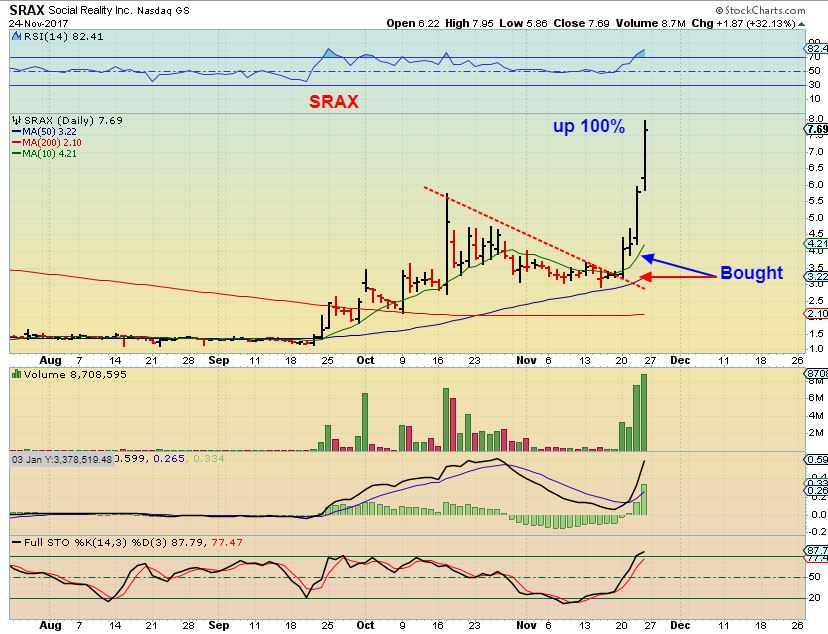
SRAX – It was up another 32% Friday, 100% from the $4 buy at the highs of that day. This trade is more than a 100% gain. My point is simply that this sector is on fire and if you can catch them low in their bases or breaking out, you may get some nice gains before this ends. I always recommend that one sells a chunk on the way up, and let some ride.
ARE THERE ANY LOWER RISK TRADES LEFT that still remain low in their bases?
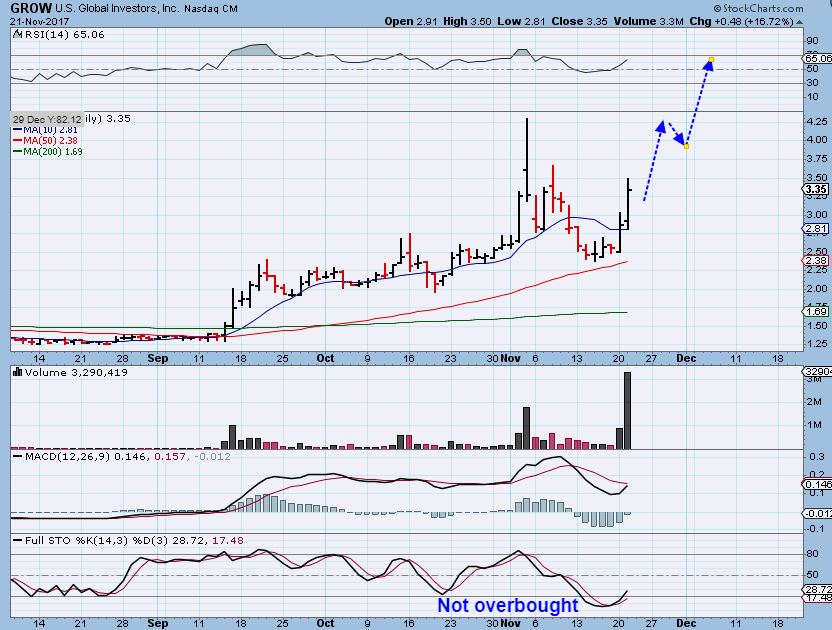
GROW – This was GROW and the set up looked great. It actually dropped 7% the next day after I recommended it with this chart! Why it acted that way? I do not know, but it was a great buying opportunity, because …
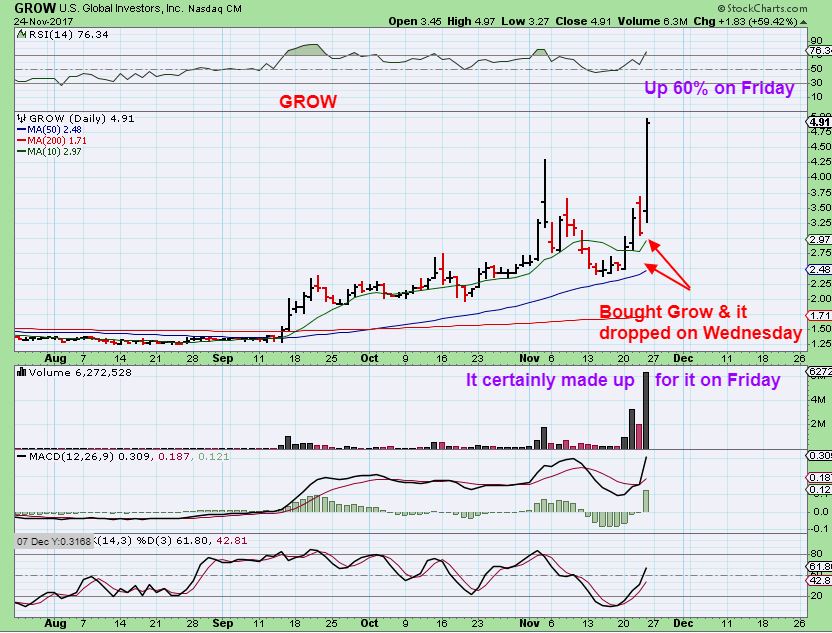
GROW – After that drop on Wednesday, GROW popped up 60% on Friday. This looks extended price wise, but look at the stochastics and we know what RIOT did…
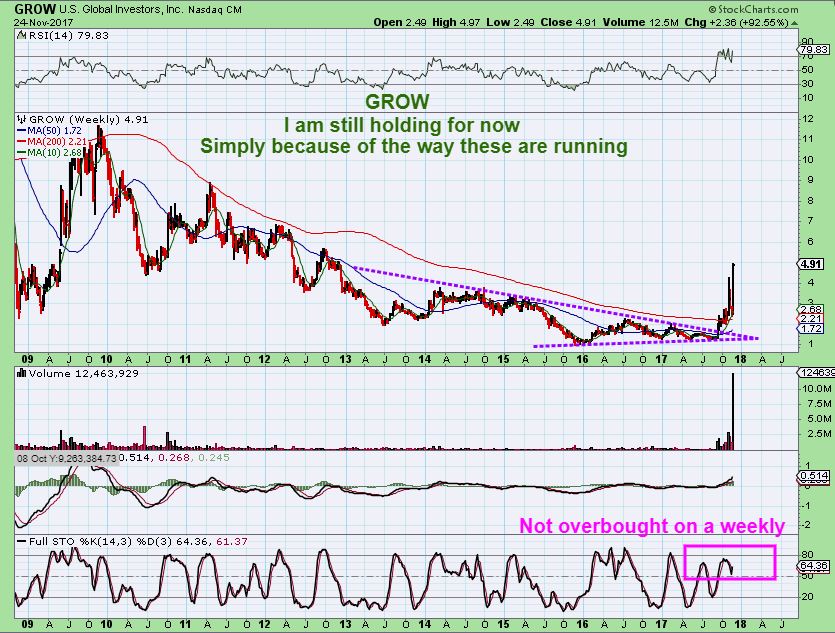
GROW WEEKLY – I’m going to let it ride for a bit more to see what it wants to do, but I may sell chunks on the way up.
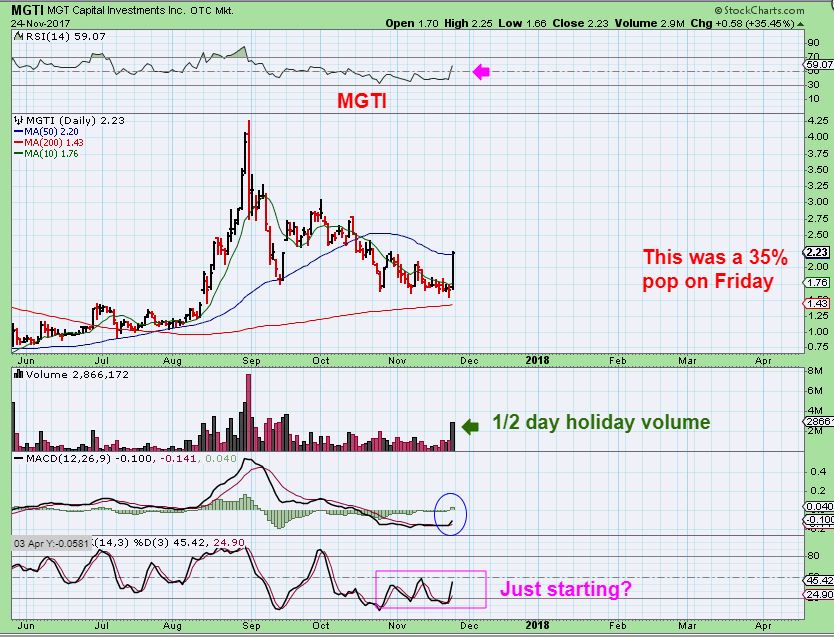
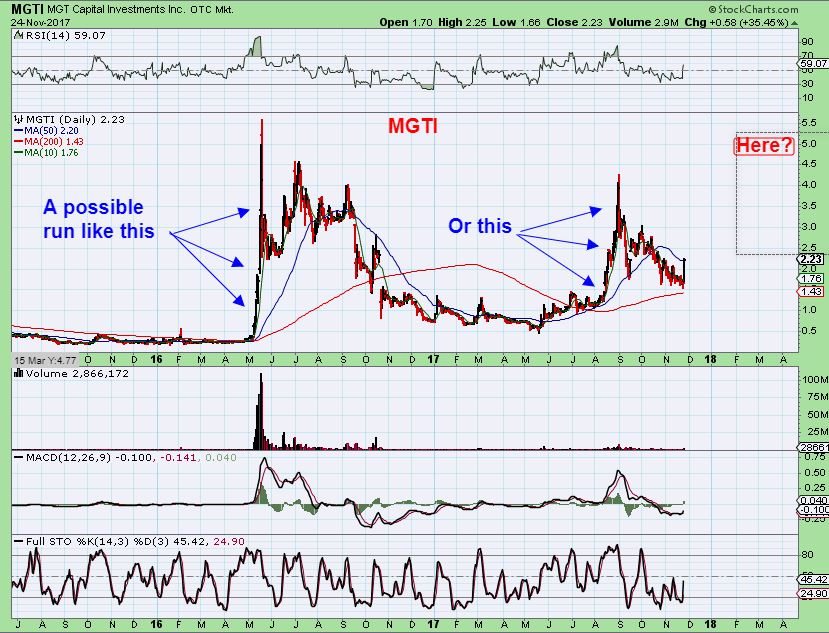
I bought MGTI as it broke out on Friday, and I posted this in the live comments section. This really looks to be just starting out, so IF the sector stays hot, this could run nicely. I bought it around $1.83-$1.85 and captured & posted this chart, and then it took off further.
MGTI AT THE CLOSE– So it then closed up 35%, but I think that it has further upside. It closed right above the 50sma. This is a buy if this sector remains hot.
MGTI – I just wanted to point out the run that it made last year too. At $2 now, it could run to $5 if that repeated, and I repeat… “IF”. If a Bitcoin buble grows and pops, this would likely follow.
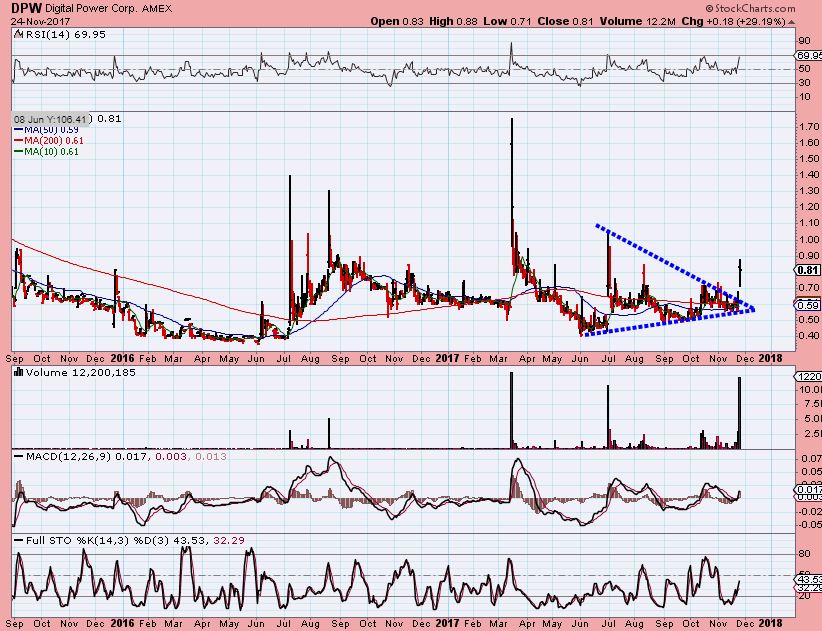
DPW – This POPS and drops often, but with a runaway move in BOTCOIN, this may get the follow through now, since it is a long base. This could get as explosive as MARA really. Speaking of MARA, I mentioned that last week….
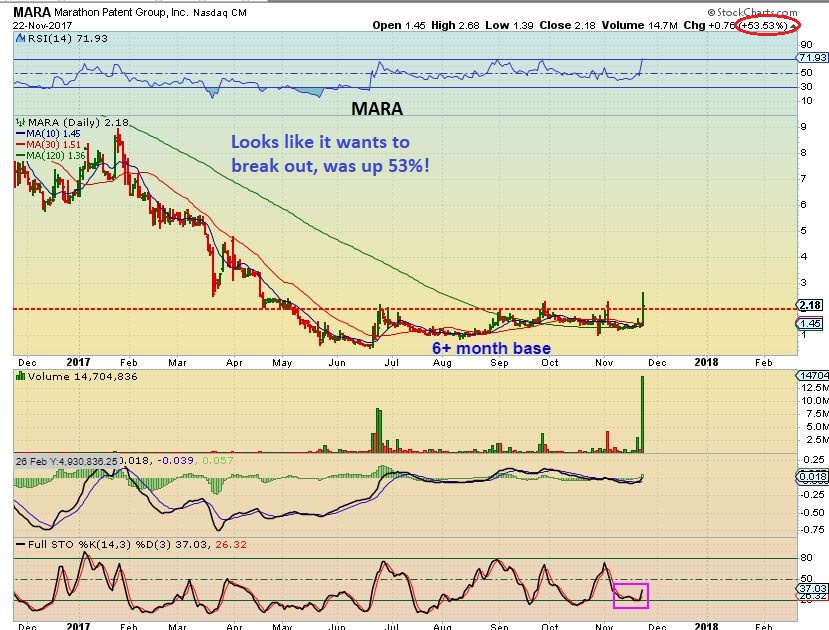
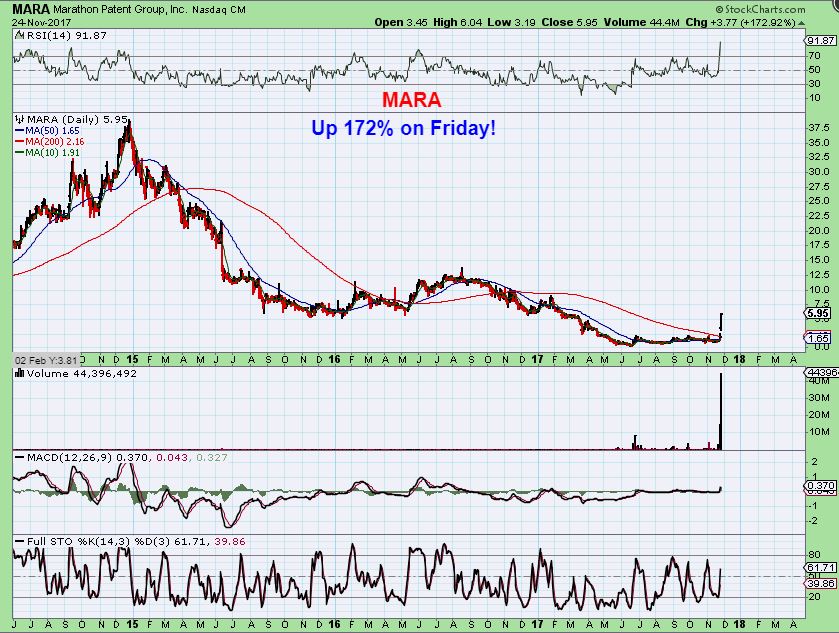
MARA – I pointed out that even though it was up 53%, this was a particularly explosive looking set up. This is very hard to buy when it is already up that much, but this had some strong characteristics and was just breaking out of a 6 month base. At $2 on this chart, it is hard to imagine that it ran to $6 Friday, but …
MARA did hit $6. Huge potential upside is seen here, but potentially dangerous now, up over 200% in 2 days. Sell some, ride the rest.
So I have pointed out a few trades that seem to still be moving higher. They may extend here for a bit, until Bitcoin tops, but we also now may already be close to a top in this 10,000 area. Last week we seemed to have more time when Bitcoin was 8,000, but now it is hard to say how much time there is. That said, this report is also being written for those already holding positions as a cautionary note. Please read the end of the report for more important info if you are trading the blockchain type trades. Enjoy your Monday trading!
.
~ALEX
.
THAT was the Good news. Some of these stocks that we are currently holding in block trade have already doubled, tripled, etc. And some of these, like RIOT, have done this in mere days! The Bad news is that when the music stops, the stocks may drop just as sharply. So These trades are not buy & hold, these are faster trades, that is what I called them from the very start. Lets discuss BITCOIN itself.
.
IS IT A BITCOIN PARABOLA, IS THIS THE END? Yes, it is getting parabolic, but that does not mean that this is ‘THE END’ of Bitcoin forever. I’ll explain…
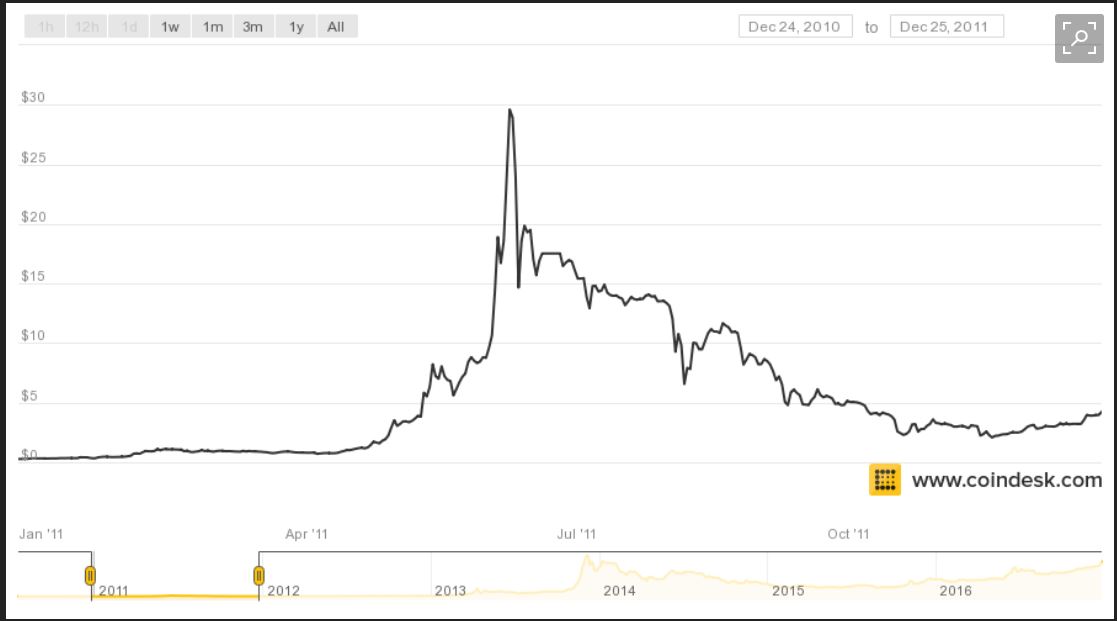
Look – a Parabolic Bitcoin run in 2011 from 20 cents to $28. Wow! That was a bubble that was extreme and Definitely due for a crash back down. Was that the end of Bitcoin? 🙂 No, but you did not want to just BUY & HOLD during that run. Dropping from $30 back down to below $5 was a killer.
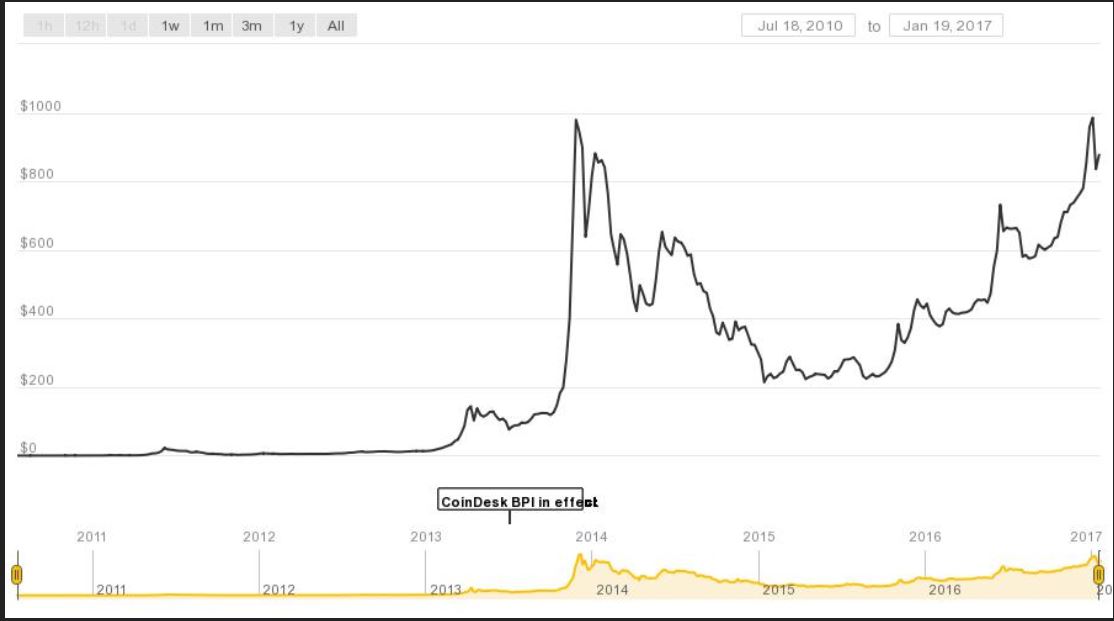
Ok, here is the BITCOIN TOP for sure, right? I’m sure many said that. That run to $28 is hardly visible here, and there was even a parabolic run to around $150 too, but here it ran straight up to almost $1000 in 2013! It then crashed back down for a year. Done? Was Bitcoin is a hoax? No, but you didn’t want to ‘ BUY & HOLD’ through that corrective period, that is for sure. $1000 to $200 was a killer.
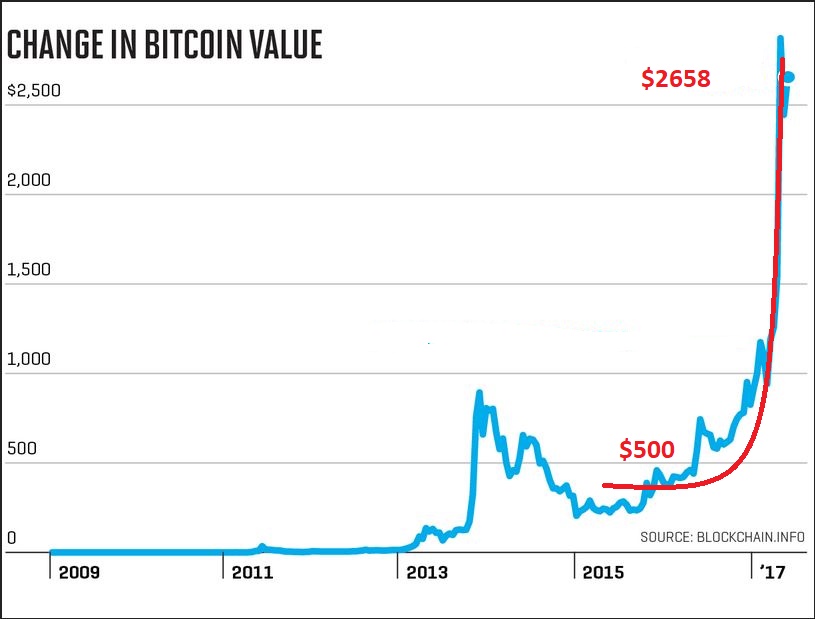
BITCOIN – Wow a parabolic move is clearly seen here too, BUT….that was only ‘$2500 Bitcoin’ heading into 2017. We know that it has still been climbing even higher. That was not the end of BITCOIN either. Look at that run to $1000 in 2013 on this chart and you’ll see that this is just part of the process. This is a fierce bull run, but my point? It can be a terrible to buy & hold.
DO you see the above run to 2658 that we just discussed on this chart below? After a correction, it ran again, and again, and again. Now it is starting to look parabolic and is really getting up there. So we see from the past that the following correction or pull back off of the top can be a killer to just buy & hold. The next real correction or drop could be a very sharp one too. We need to be careful here. FAST TRADES, not buy & Hold.
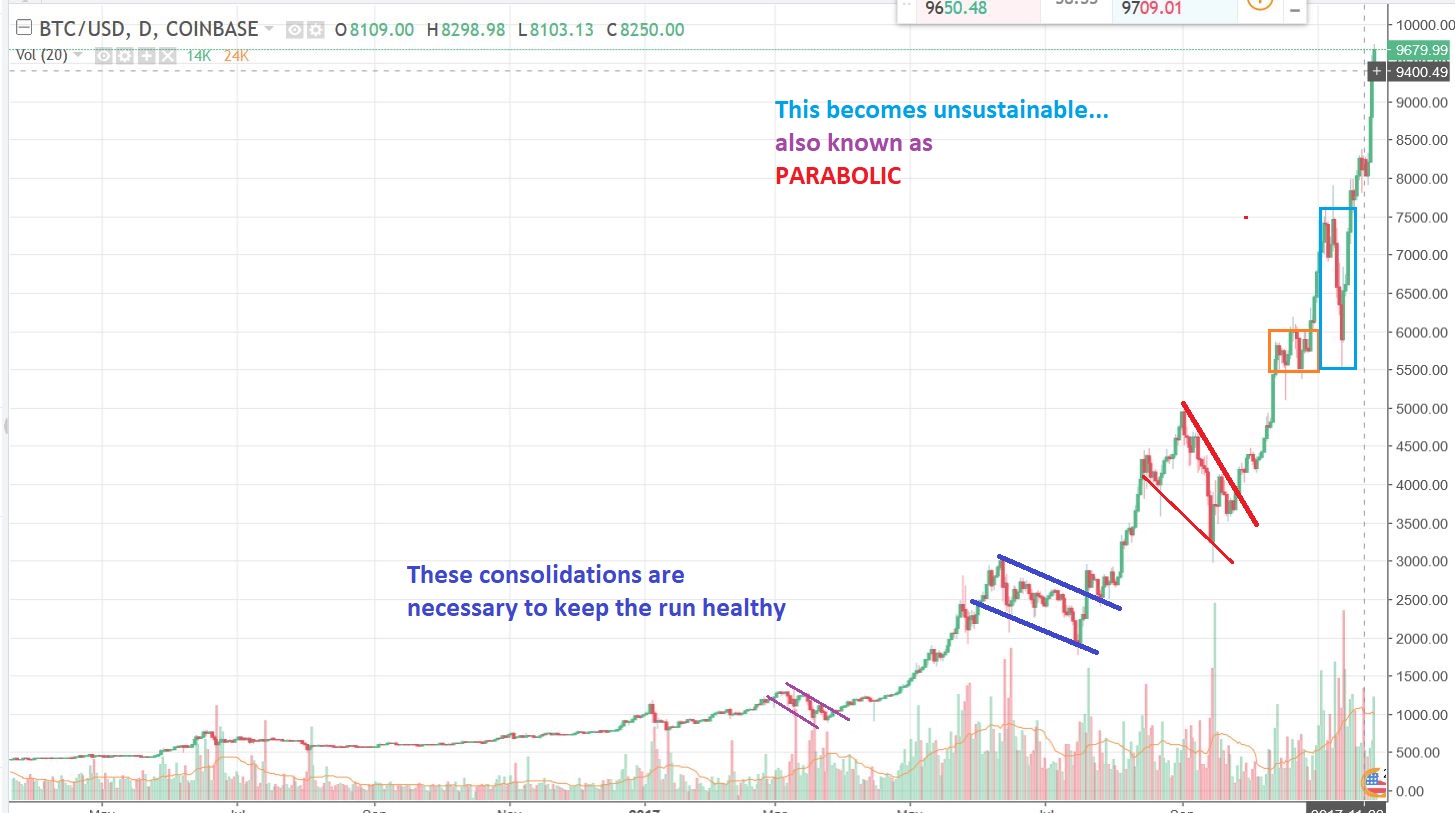
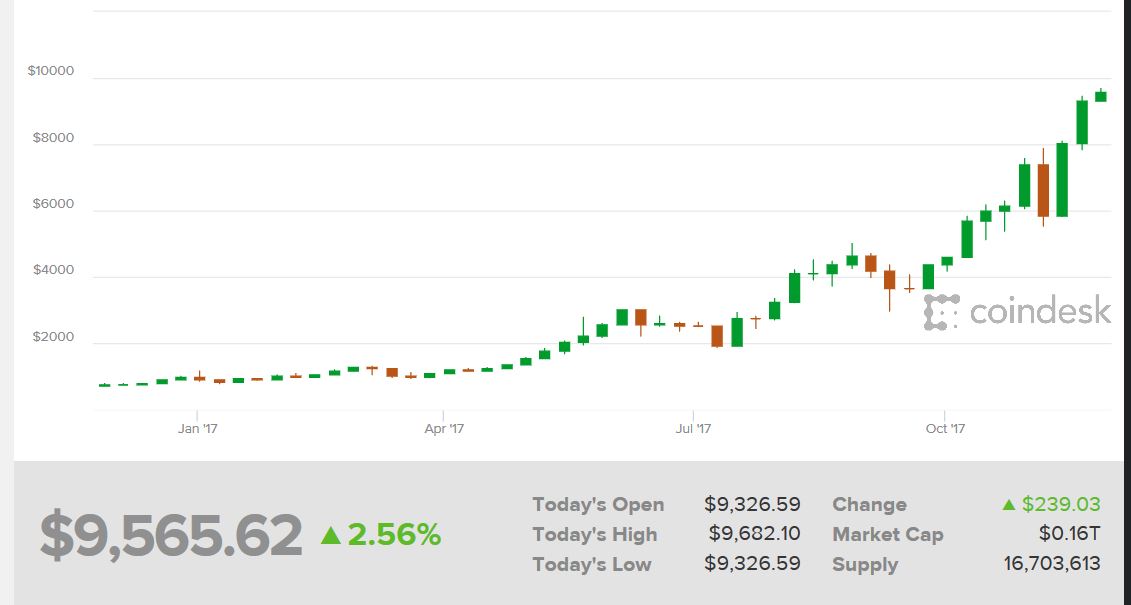
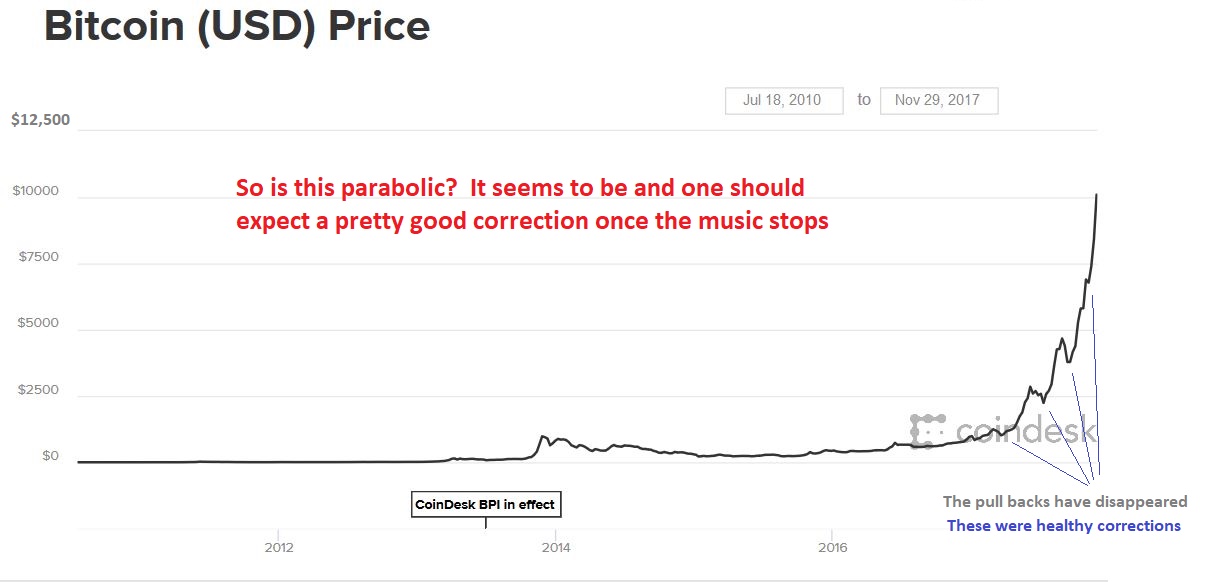
1 year BITCOIN #1 – This Bigger Picture chart shows that run to $2658 into June. Then it consolidated sideways into July, and ran to $5000. Then it Pulled back to about $3000 VERY QUICKLY and many called this the death of Bitcoin. Next we saw a run to 10, 000, 11,000, 12,000???? This is where we are now. $10, 000 and then a drop? $11,000 and then a drop? The ILLUSION is that this doesn’t seem that steep on this chart, but wait…
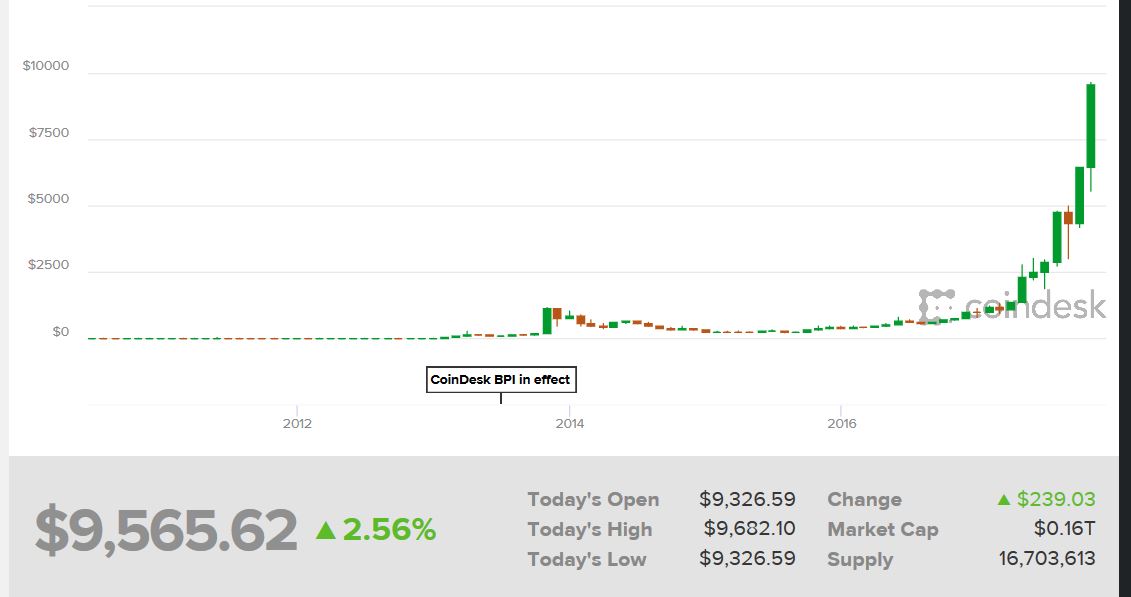
BITCOIN NOW#2– This is actually a VERY STEEP INCLINE on a 7 yr chart and could exhaust soon, top out , and correct sharply at anytime. It could rapidly run to $15,000 and then POP – we just do not know. Those other parabolic moves pale in comparison on this chart, don’t they?
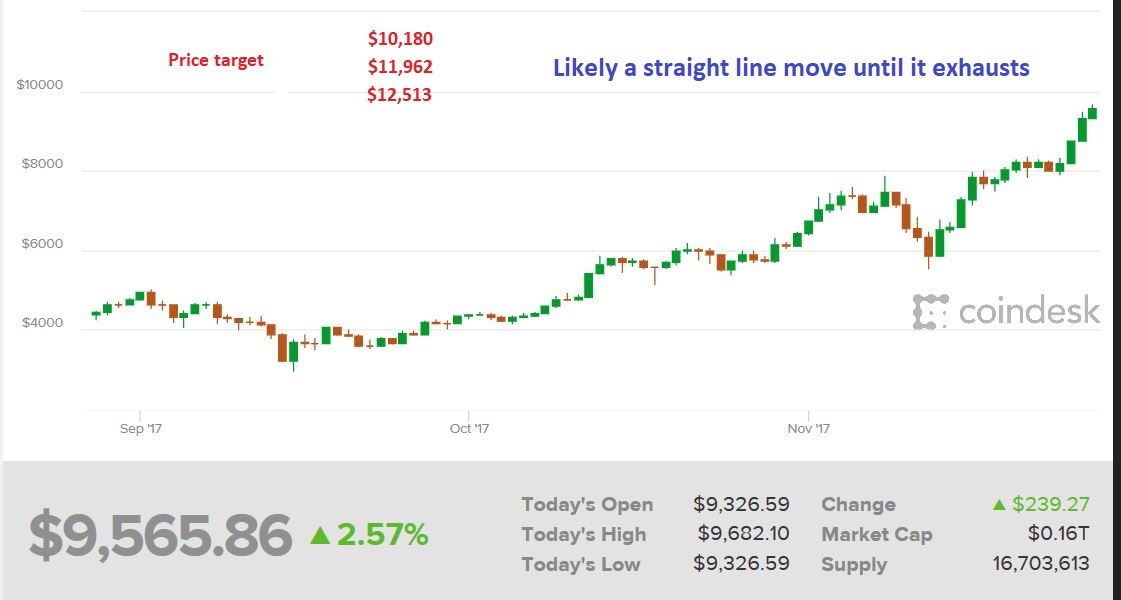
BITCOIN NOW#3 – These are potential targets using a formula that may or may not work in parabolic moves. We’ll see, but I see initial targets of $10,180 ( and also $10,435) – $12,513 as possible. Anything beyond that gets VERY parabolic. Many thought that this couldn’t go much higher than 2000 or 5000 yrs ago, so you see how these things stretch.
This is BITCOIN Monday morning as I post this report. That small v-shaped sell off from $8000 to $6000 gave Bitcoin another ‘charge’ to run higher. I just saw MARA above $9 premarket , congrats to buyers of Mara last week. It was $1.50 Wednesday. This is getting ridiculous, and this move just cannot last forever. And by the way, RIOT hit $26 and has now dropped to $21 premarket on Monday. I am out of RIOT.
So Yes, Bitcoin can continue to run. Yes, it does look like it is forming a parabolic run that leads it into and out of the Bubble Phase. Some people get upset when you say that Bitcoin is a bubble, but we are not saying that it is the end of Bitcoin. We look at the past parabolic runs that it had, and we see that they became ‘Bubbles’ too. They corrected and off it went higher again. That old saying “Sell the rips and buy the dips” is how the Bitcoin Bull has been running. 🙂
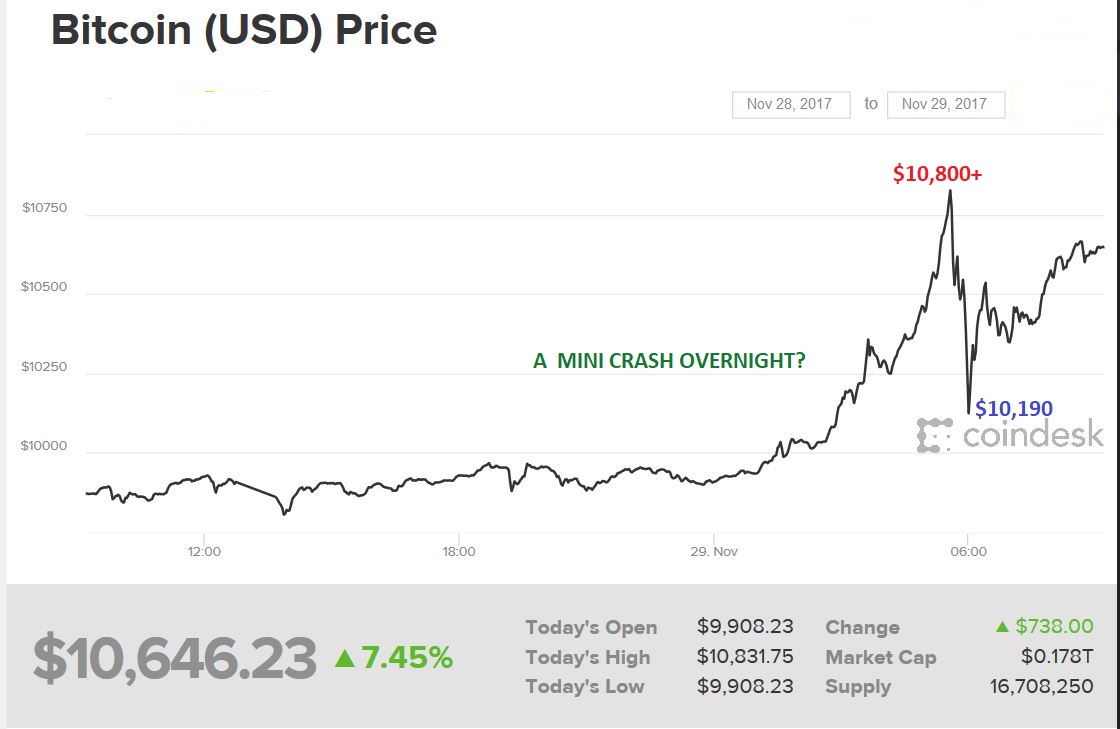
UPDATE : Wednesday Morning BITCOIN – a spike to 10,800+ ( Now even over $11,000).
It does look parabolic to me now, but where it will top is still up for debate. We dont see the healthy corrections along the way anymore, and that is when price accelerates and tops out. When the music stops, the price should drop.
You can see on one of the charts above, I did have $12,513 as one extended price target, but these do get unpredictable. If you are trading in this area, it is looking more and more like a Bubble, procede with caution. Use and Honor stops, and take some gains off the table so that Mr. Market dos not take it away from you one night , if Bitcoin starts selling down the way it was bought up on Tuesday night.
When Bitcoin drops, what Pops? Precious Metals? I am constantly watching that sector and I think that we are approaching an interesting area there too. I have been calling for a pullback in the Precious Metals sector since September, and it could happen going into the Fed Meeting. Maybe my reports and research, added to your analyses and trading, would be helpful? I believe that the Gold Bull may be ready to run again soon too. Thanks for being here at Chartfreak!
Chart Freak Premium
Chart Freak members receive up to 5 premium reports per week covering a wide array of markets. Come and join the ChartFreak community as we trade the next run in the Gold Bull Market and various other trending sectors.


