Let’s review the weeks market movement and see what is likely to happen next week.
NASDAQ -We still haven’t dropped into our ICL, but you can see that the NASDAQ has basically gone sideways all summer. Price is where it was in May. Is this reversal ready to move price higher out of this consolidation?
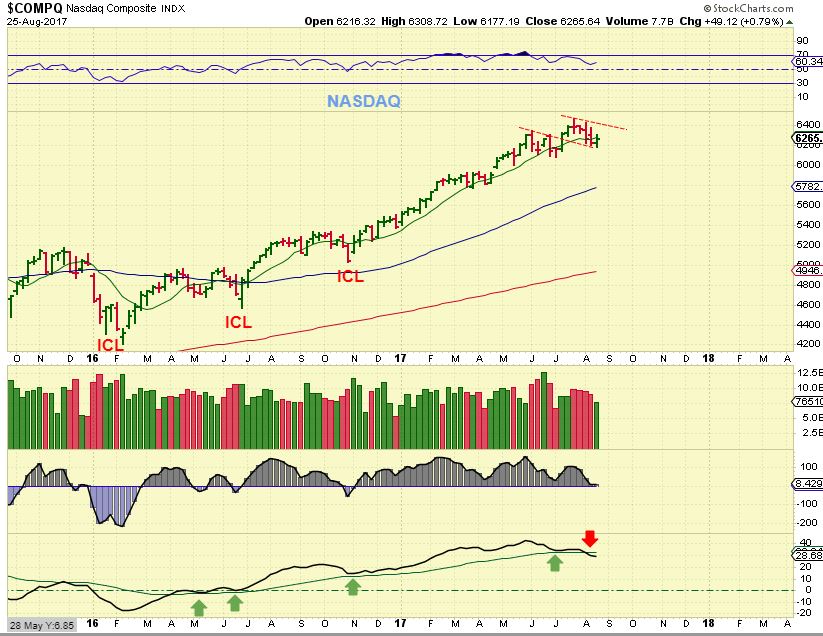
Well, we are within the timing for a DCL on the daily charts, but look at that lower indicator on the above NASDAQ chart. This sideways move has internal weakness, so the next daily cycle could roll over too, if you buy the reversal here, use a stop.
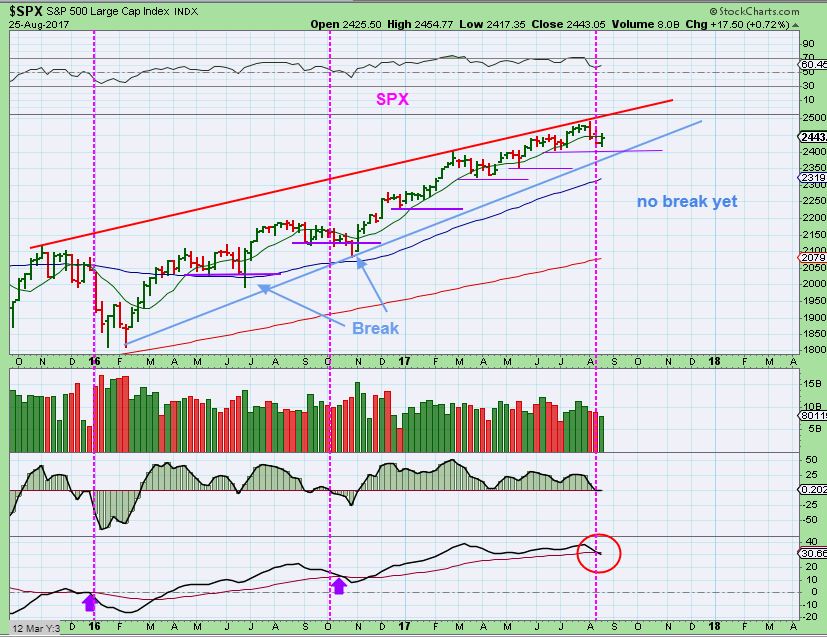
SPX – We do not have a failed daily cycle to give us a drop into an ICL, and we are overdue. As has been mentioned in the past, we are either going parabolic soon ( starting a steeper incline) or this will roll over. I am about to get a cross down on the lower strength indicator, so it needs to climb immediately with this weeks reversal, or it could drop further. Again, USE STOPS if you enter.
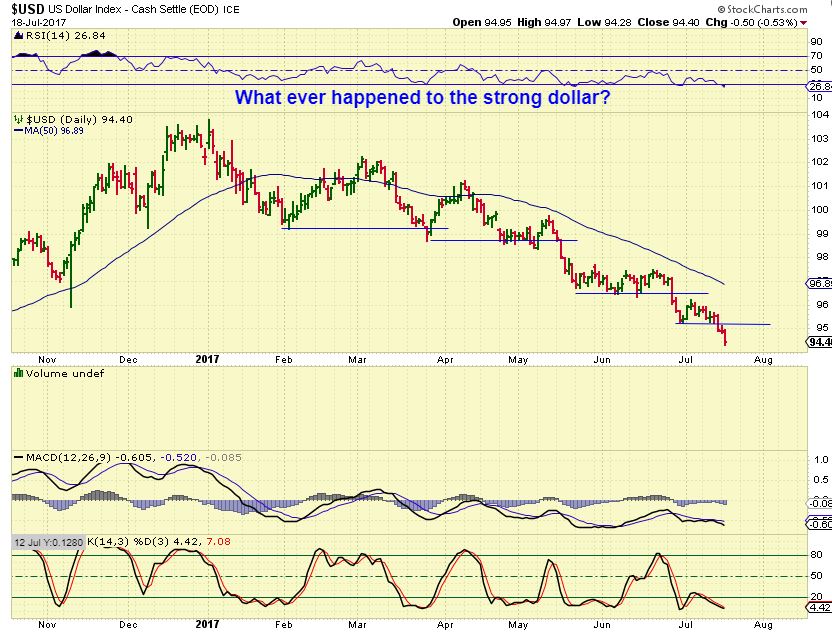
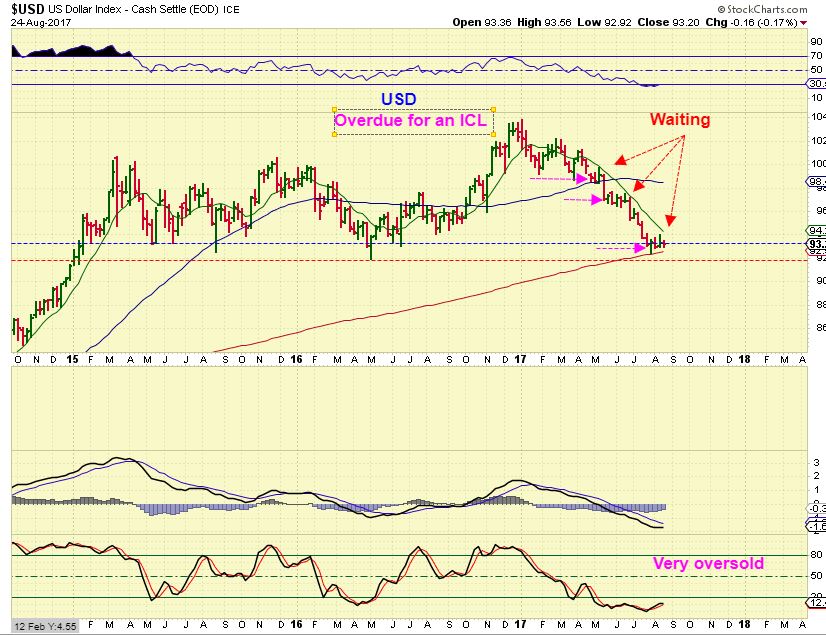
Back in July I pointed out that the dollar just seems to gather enough strength to move sideways and then drops again…
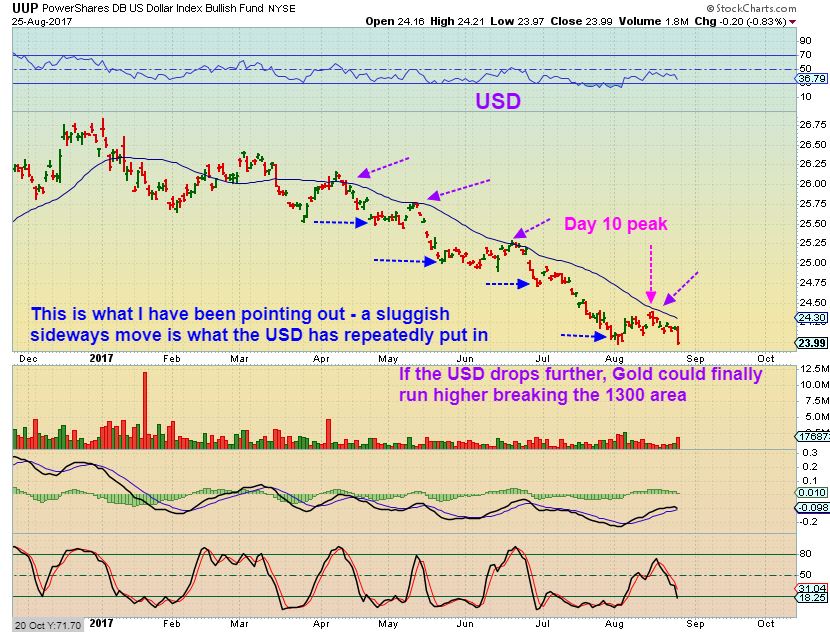
UUP – Currently that pattern hasn’t changed. WE ARE DUE FOR AN ICL, so I keep that in mind, but at this point, if this drop continues, GOLD could break the 1300 mark. Please read the chart.
USD – The USD is overdue for an ICL, and I thought that we may have seen one, but if the USD loses this support? It could drop lower, bounce to give us a back test, and then continue to drop as quickly as it moved higher in 2014. I’m watching the USD, EURO, and YEN.
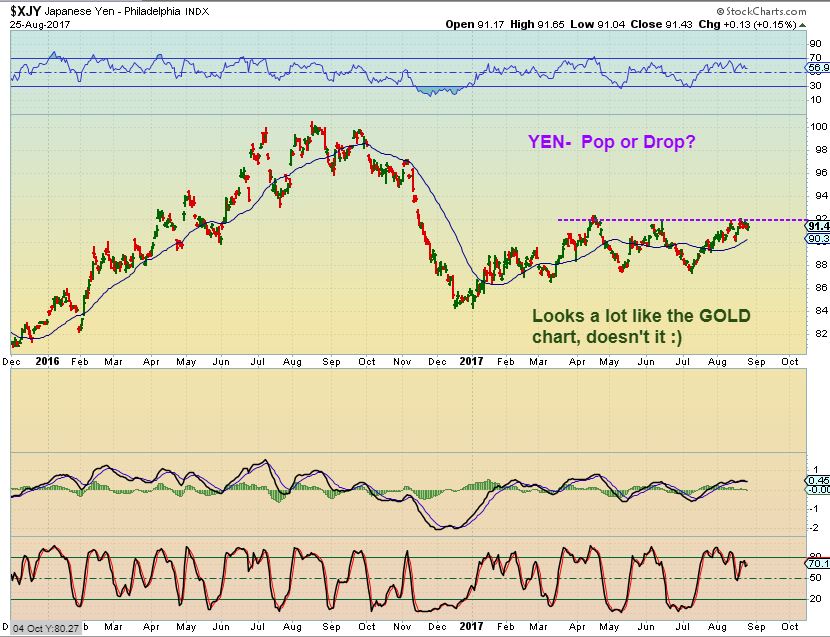
YEN -Similar to Golds moves
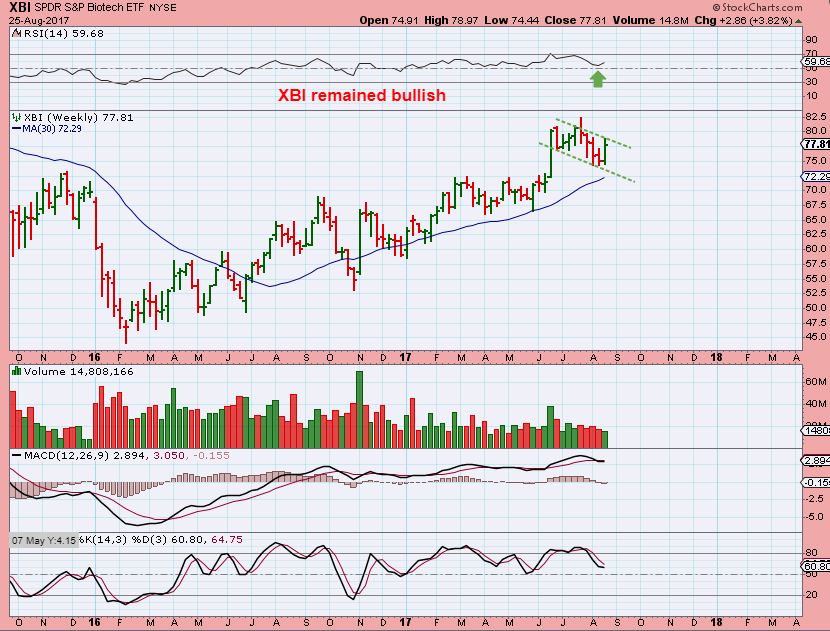
XBI– Biotech had a healthy looking pullback after breaking out, and a nice reversal last week…
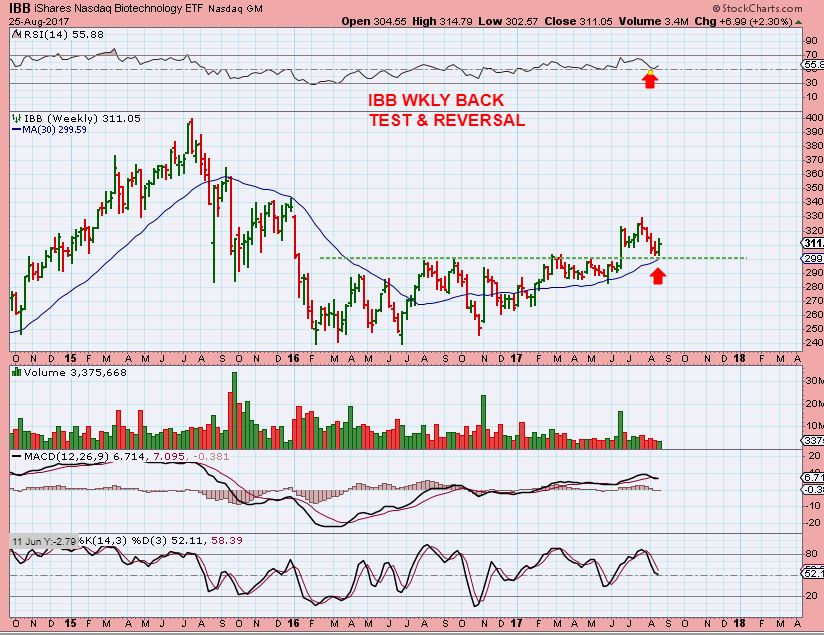
IBB – Thi chart of the IBB shows it as a normal back test to the recent break out and then a reversal. Biotech looks set up to move higher again. Almost a perfect tag of the 30 weekly MA. Textbook TA.
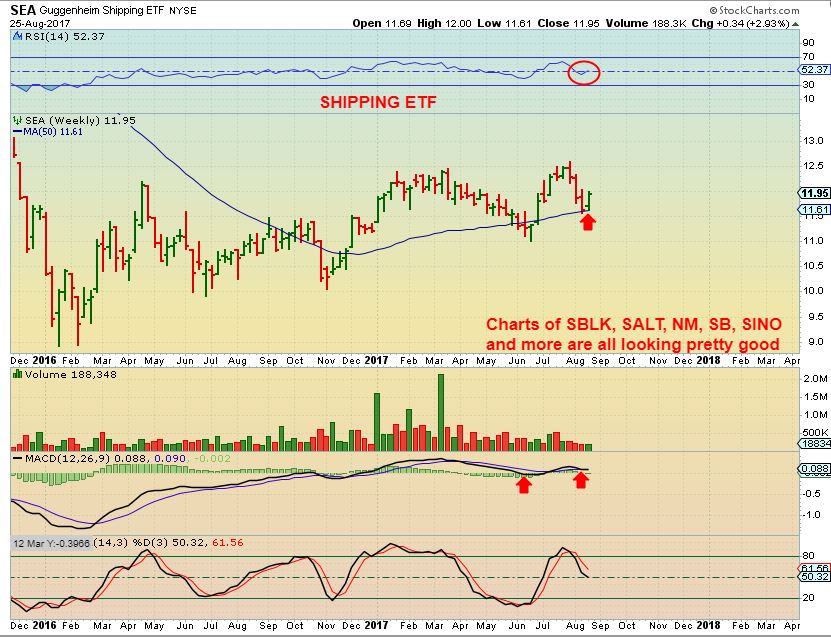
SEA – I was scrolling through my Shipping stocks on Friday and mentioned in the comments that some of these are actually now trending higher steadily, and others are breaking out. Look at charts of NM, NMM, SB, SALT, SINO, SBLK, EGLE, etc for examples. This Shipping etf SEA put in a reversal at the 50 weekly MA and also looks good.
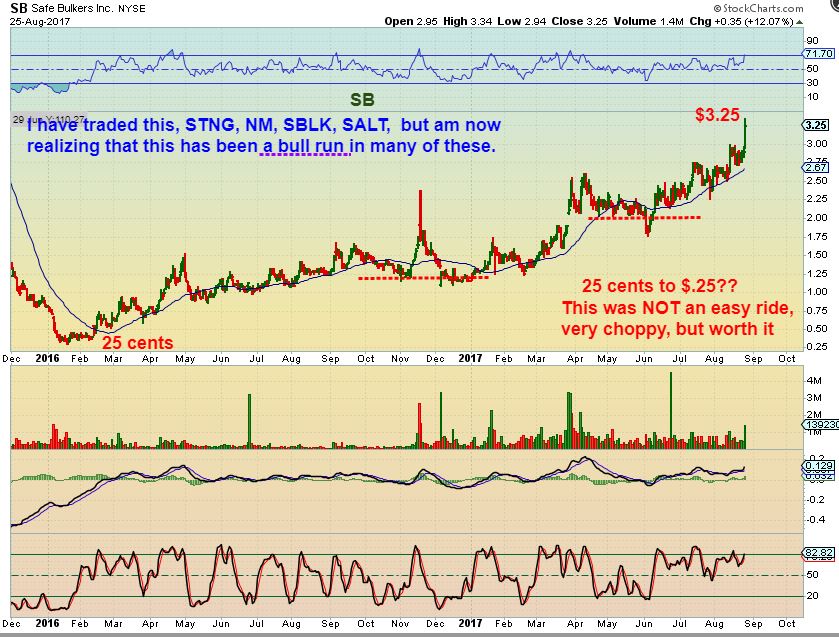
SB– As an example, SB went from 25 cents to 3.25!! HUGE MOVE, but that was not an easy ride. Much choppier than NAK, and I see a few here that often express their Hate if the ride in NAK. I’m going to discuss that at the end of the report. Please look at this run, NOT AN EASY RIDE, but it is up over 1000% in 1.5 years!!!
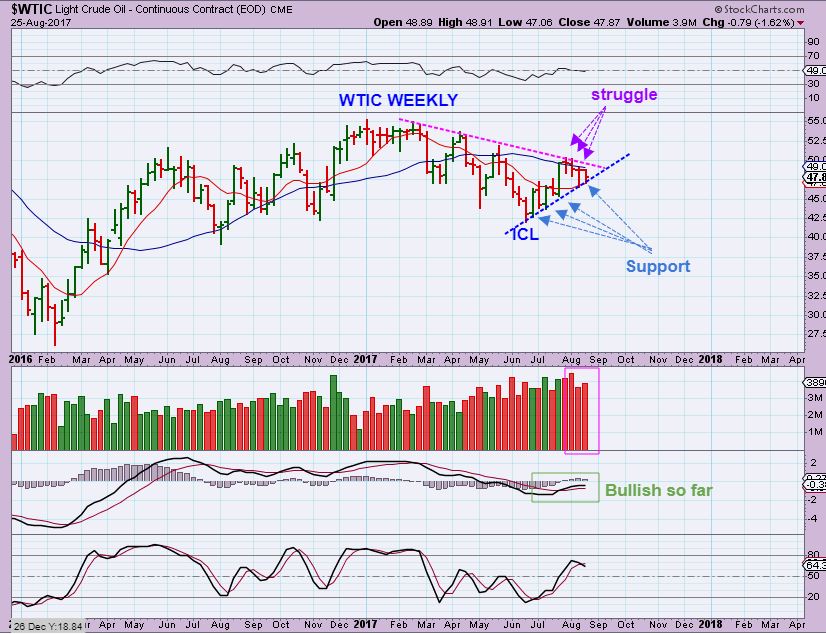
WTIC- Oil, in my opinion, put in a DCL, ICL, and a YCL in June, but has run into resistance. I am hearing that the hurricane in Texas has shut down many rigs, but I don’t know if this will affect the price ( Supply & Demand) of Oil or not, but it needs a good push to break out here.
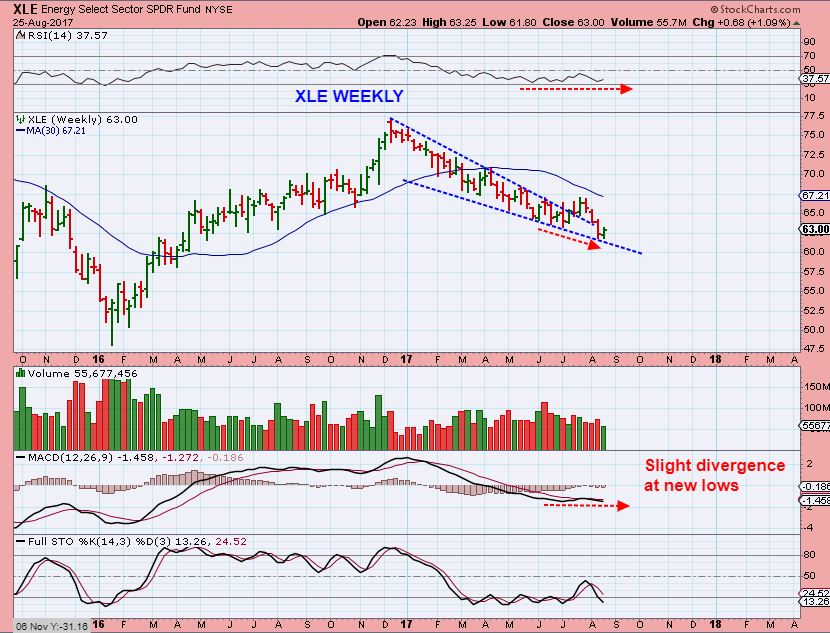
XLE – The OIL/Energy stocks put in another reversal. I have been clear about how I feel in this sector. Thoughts like “buyer beware”, and “enter at your own risk” come to mind, since even that last convincing break out rolled over and failed. I am not holding anything in this sector currently.
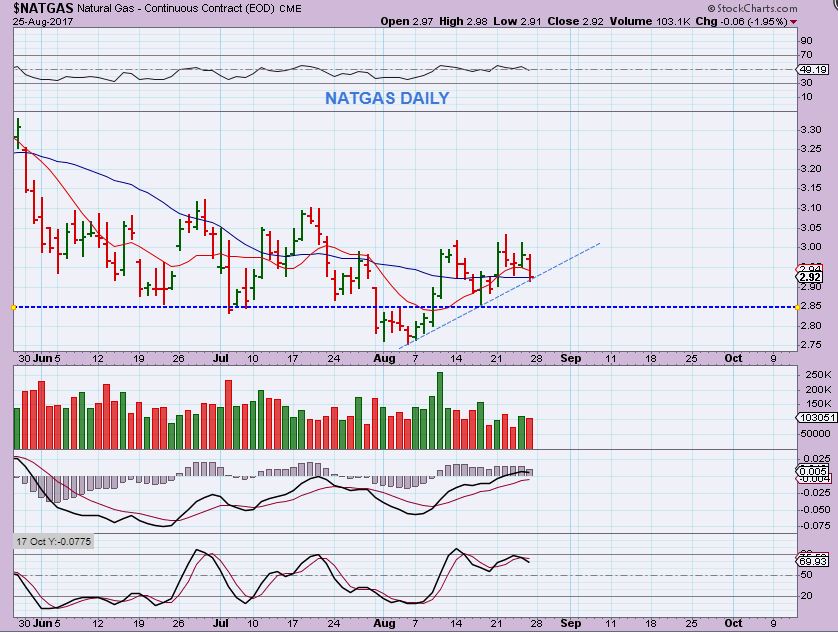
NATGAS WEEKLY – The same applies here. I haven’t personally taken a trade in Natgas, because it has been choppy and sideways for weeks and months, but I have been asked to cover it for those that trade it. It has been very choppy on a daily chart
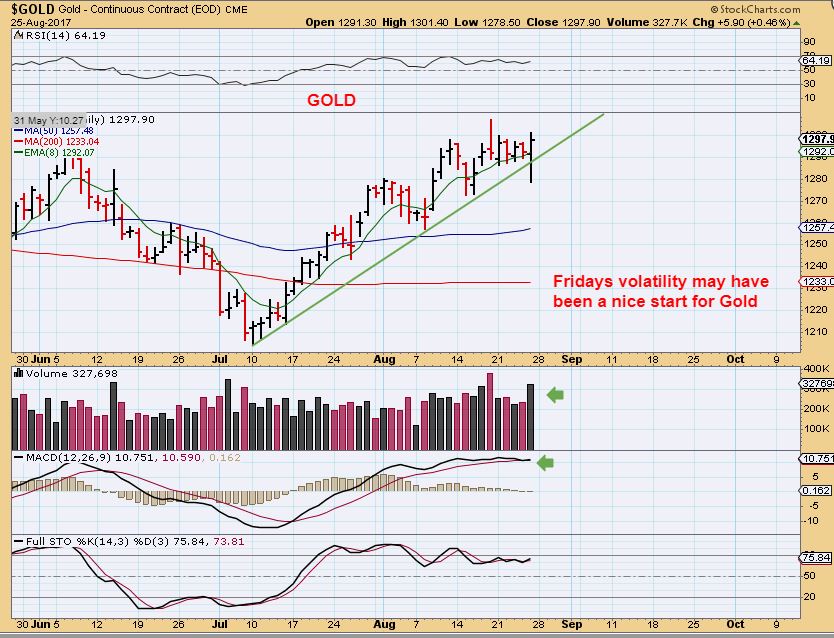
GOLD, SILVER, & MINERS
Gold was actually in a triangle leading up to the Jackson Hole Meeting, and it reached the apex and had to go somewhere. This was my 1 hr & 2 hr charts Friday morning.
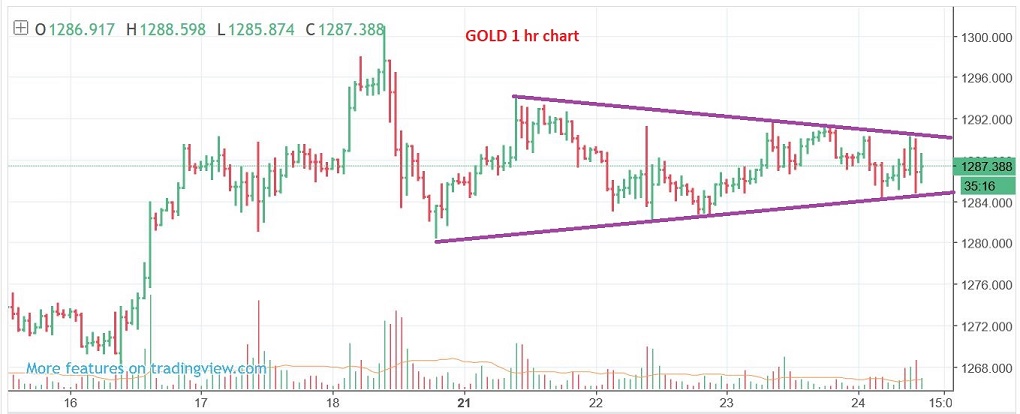
2 Hr Gold Chart as it started to break out. This looked really good, and then…
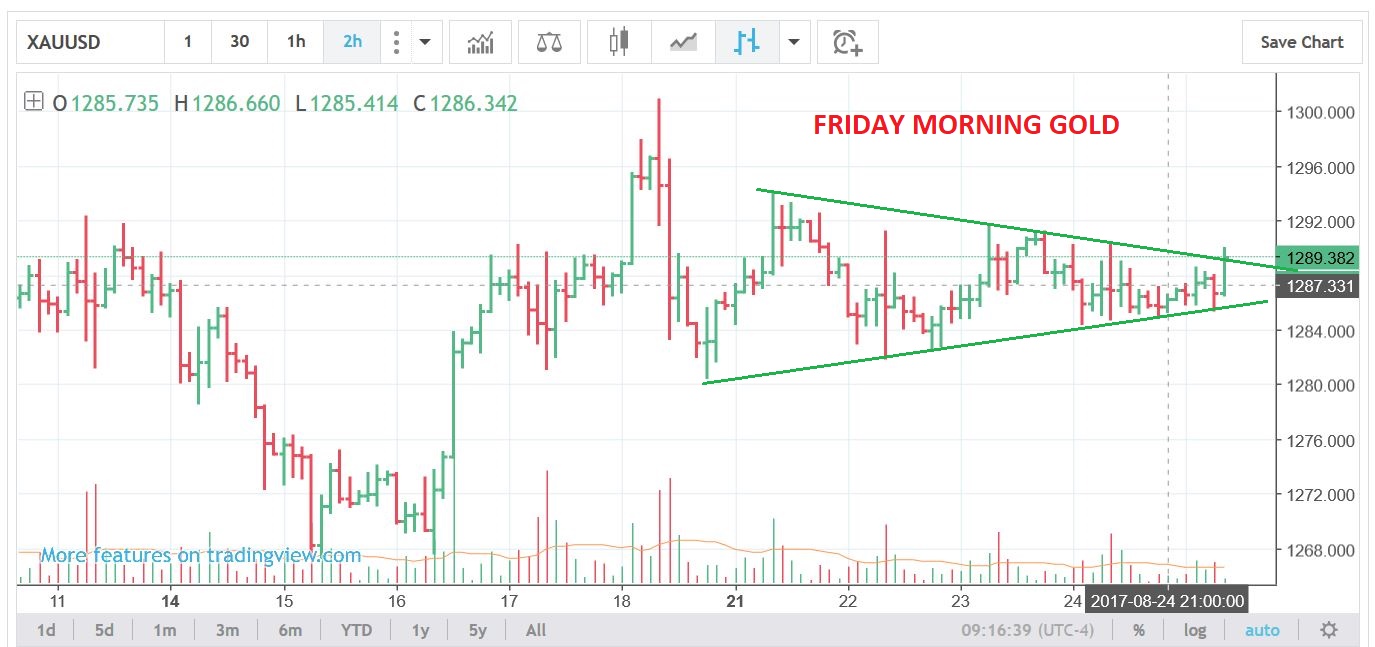
GOLD – Was this the “Pulse” of the Jackson Hole meeting? Gold went crazy on Friday, shooting straight up rapidly breaking out of that triangle, and then dropping just as quickly, no doubt shaking out any that waited to buy that break out. As the day went on, it finally ended up stabilizing.
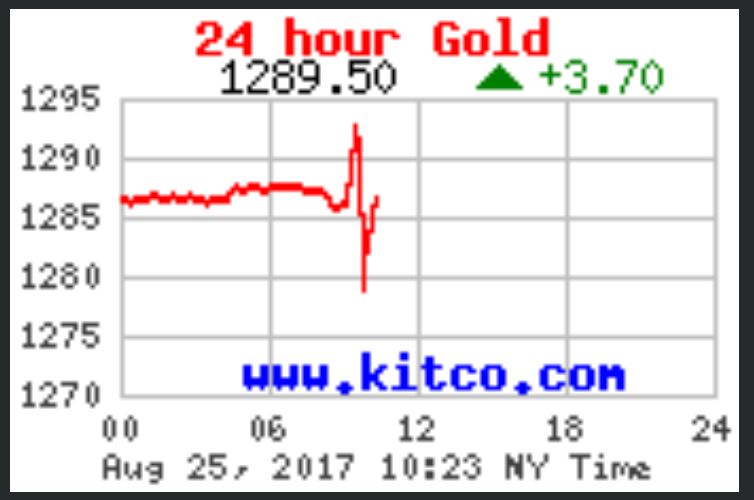
GOLD – So the price action doesn’t look like much on this chart, it just looks like it sold off and closed higher, with buying into the close. That may have been a shake out and Gold could continue higher next week.
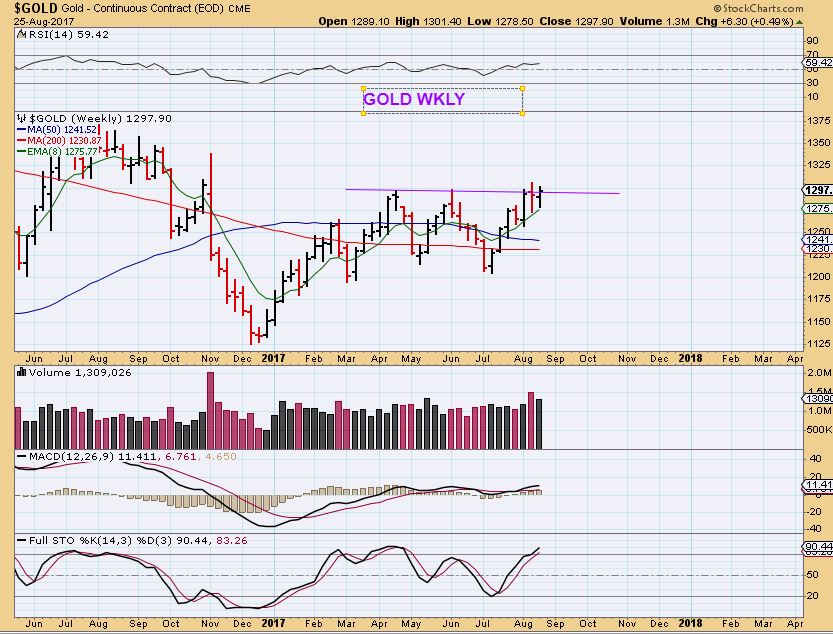
GOLD WEEKLY – This looks a lot like the YEN chart, and it does look like it wants higher price.
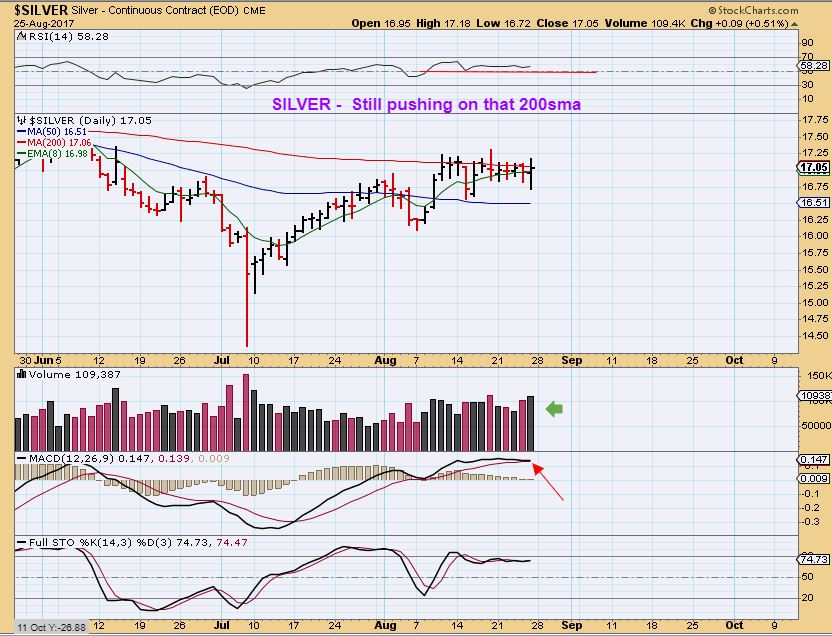
SILVER- Silver also looks like it wants to push through that 200sma
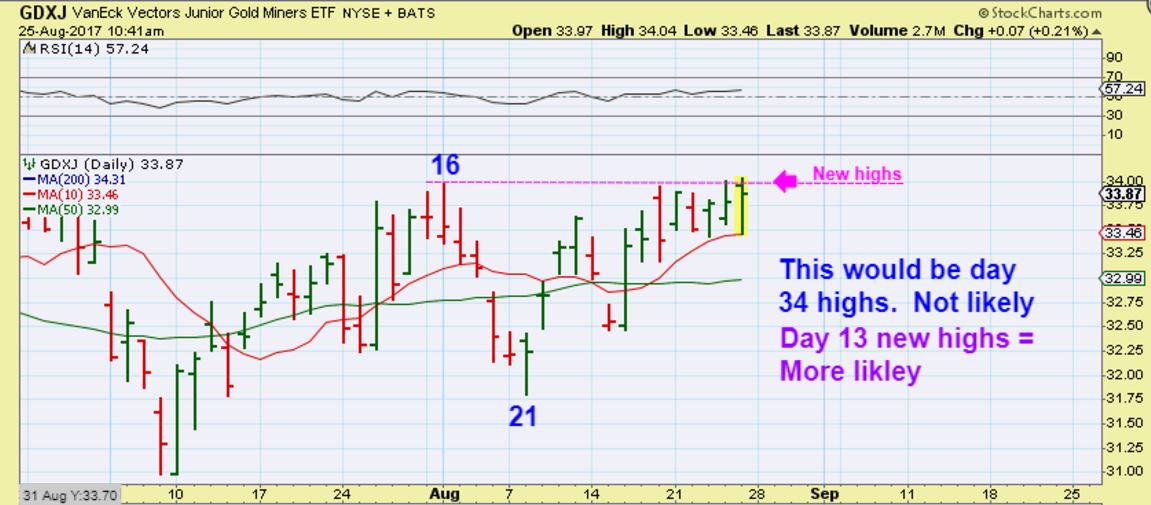
GDXJ – On Friday morning I noticed that we hit new highs, so I captured this chart just to say… ” Is it more likely that this was day 34 of the first daily cycle making new highs? Or more likely that a DCL came in on day 21 and this was day 13, new highs?
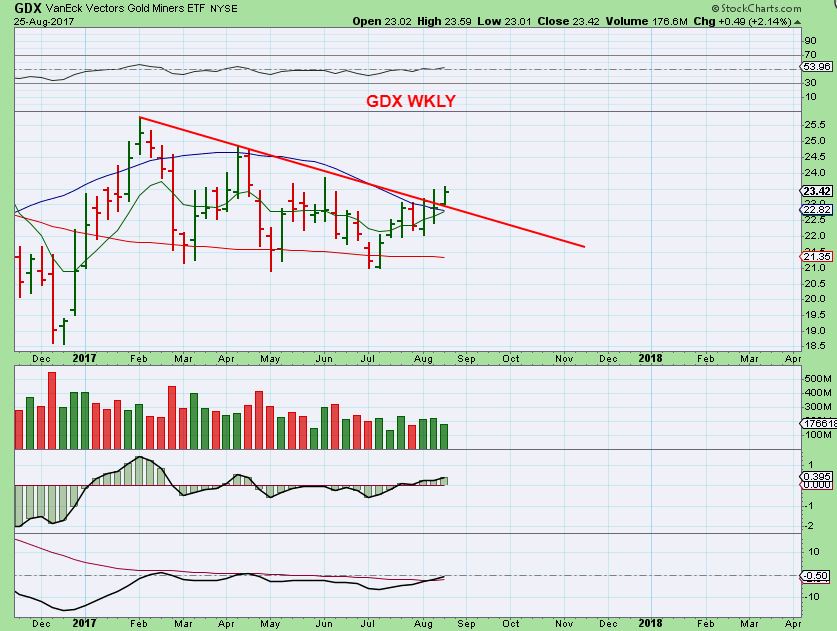
GDX WEEKLY – Either way you want to look at it, it looks like a slow motion break out in Miners and this is bullish. My longer term weekly strength indicator at the bottom is crossing higher for the first time since it crossed down last August 2016.
That is our weekly wrap up, and not much has changed in each sector. I am still liking (and own) Commodities like IPI, TGB, NAK, SID, GMO, HBM, CENX, etc, and some Miners ( and I didn’t cut my leverage yet, based on the triangle, not cycle counts). The General markets have put a swing low in place, but we are due for an ICL and one needs to use stops if they buy the swing. I have been bullish on a run higher in Oil since the ICL in June, but Natgas and Energy stocks have been a bit too choppy for my liking ( yet).
Now I am also seeing the Shippers & Biotech sectors perking up again. For those that wish to trade in that area, I may cover it a bit more in the coming days. I do understand that some traders may just want to stay focused on Miners or commodities, since they look to be playing out as expected. Others here do like to trade ‘trade bullish looking set ups’,so I will probably cover some of those interesting set ups in the coming days.
Enjoy the rest of your weekend, and thanks for being a Chartfreak!
~ALEX
SB – Just another look at that stock that is up over 1000%, and many probably would say that they wish that they just bought & held on. “Get it and forget it”, right? However, as a reality check for us, me included … Look at the steep drops where I placed red lines. Shake out type moves. Honestly, would we have held on? Riding a bull is NOT as easy as everyone thinks. This was a very tough ride, but obviously very rewarding. I use bullish charts like this and AMZN, AAPL, NFLX, etc as a learning lesson…
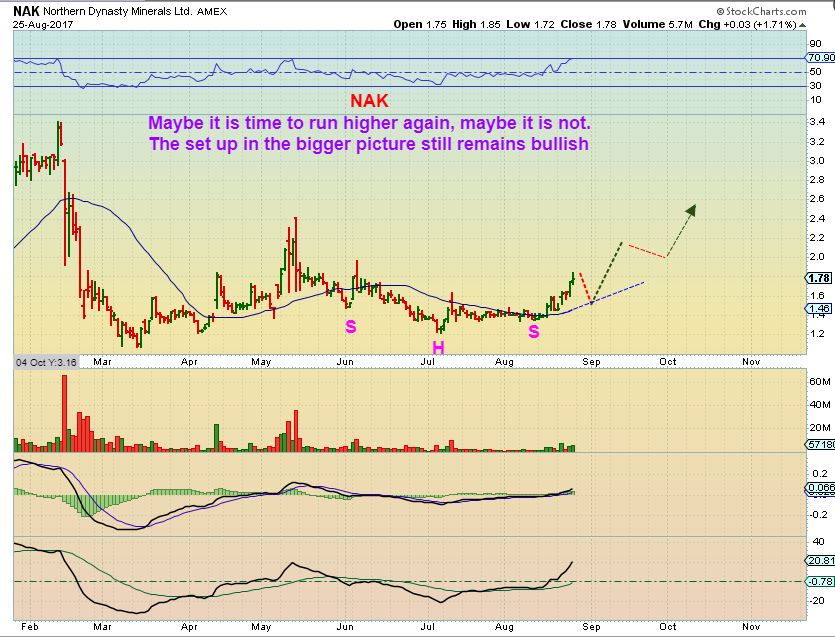
NAK– Remember this bull ride? Most here remember when I was loading up (and others were too) on this at 35 cents+ and adding at $0.40 plus and 0ver 50 cents etc. The run was GREAT, but even that first run shook people out along the way when price was still under one Dollar. I remember many many emails from people warning me that NAK was going bankrupt or had no potential. They wrote the same thing in my ‘comments’ section, and the Bull continued to climb that wall of worry. Well, eventually NAK ran too steeply into the $3.50 area and I ( many of us here too) ended up gradually selling a solid portion near $3.40, $3.20, and finally a drop under $3. Now NAK is breaking out from a steady consolidation, and I (and others here again) have been accumulating around the 200sma and again now by the 50sma. It is still putting in higher lows in the bigger picture and could now continue higher over time.
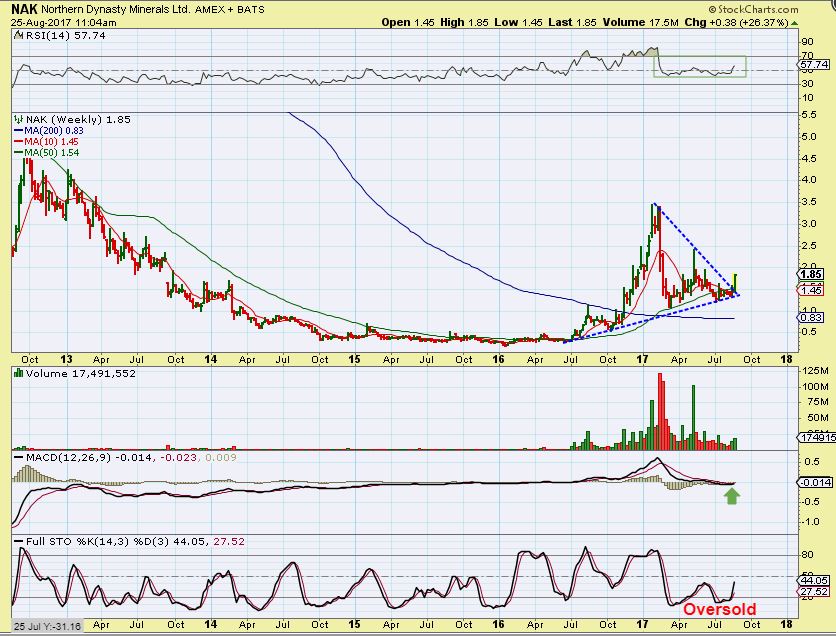
NAK WEEKLY – So this is a break out last week, and I think that that Magenta line is acting as longer term support now. Did you Buy, Sell, or Hold? If this gradually returns to former highs of $3.50, forming a cup, it is a 100% move from here and still acting like a bull. It could be a gradual climb.
I personally think that NAK could be bought out by a big Mining company, especially now with the EPA working with them to permit them to dig in. Imagine a big Mining company like NEM, GG, ABX, etc looking for a smaller company with solid reserves in the ground?
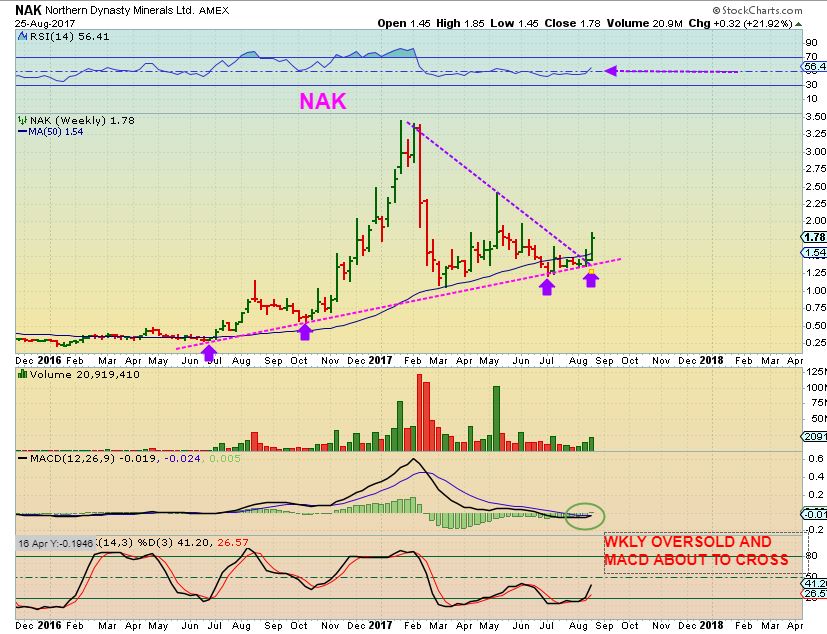
NAK – I try not to worry too much about the smaller wiggles when the potential over time is so great. At the 2008 lows, NAK ran from under $2 to $22 and there was no Mining taking place then either.
NAK – Maybe we are seeing some baby steps for the bigger picture again?
August 25th – The Waiting Is The Hardest Part 
 The Weekend Walk Through – Aug 27
Scroll to top

Supermodel walking on his catwalk 🙂
Lol…..
Obviously worthy of GQ exposure.
I think that could be my brother 🙂
Interesting strength indicator on the bottom of the weekly GDX chart, care to share the basis? Solid report as usual, glad to be 51% invested in miners and looking to add to the profitable positions. I´m also happy we avoided the debacle in energy, another newsletter writer many here are familiar with has blown up his subs again sitting in the ERX.
I am not entirely convinced we are heading strongly higher from here in miners, but only because the COT report, and it seems many are already longed up and dreaming of the profits they have yet to earn. Also, the un-named newsetter guy mentioned above that blew up in ERX is also now loaded with miners, and after telling his subs GDX would break December´s lows, which never came close to happening. If we do get a shakeout any time soon, I will use it to get fully invested quickly, and if GDX only drifts higher I will keep nibbling on the way up. Other than the COT and a lot of people already long, I am very bullish.
Good luck this week!
I keep hearing about the COT, but as I have said in the past, it is NOT a good timing tool, and I have seen higher smart money short in the past, and so has everyone else, but people forget.
Wait until we see the COT next week ! : )
Over 1300, ladies and gentlemen. 🙂
No rise in oil, yet, with the hurricane/flooding , but certainly to be expected in gasoline prices.
I’ve read where there could be lower demand for crude because of the refinery shut downs and higher demand for refined products.
Energy is in such a strong downtrend like miners were until 2016, that it wil take some time for it to turn higher in any sustainable manner, in my opinion. I might be wrong, but I am staying away until the OIH triggers a buy signal on my monthly charts (long term), and it´s not even close at this point in time.
In fact, I was really tempted to start buying the washed out big name drillers last month, like ESV, RIG, etc, and only didn´t do it yet because of that chart. So far, I am very, very happy I stayed away.
Alex, if we’re around day 13 in the 2nd DC, aren’t we limited in how many more days we can go sideways or up or does the triangle formation change the cycle thinking?
Well, limited to what though? Lets just say that a day 23 peak is possible – that would be 2 weeks of possible upside trading, right? This sideways movement can lead to a quick run higher and then a possible back test for a dcl.
I usually cut leverage around day 12-15 or so, unless I see things lining up for more upside. Right now, if gold pops above $1300, I would imagine that it could run to $1320 – $1350 or so.
Are you getting drenched with Rain in your part of Florida too? I saw a tropical storm down there earlier too, but Texas certainly took the spotlight with those massive rain amounts.
Thanks Alex. I’m leveraged now and want to see if I can hold it longer for more upside. So I hope that happens. Yeah quite a lot of rain here, but nothing like Houston.
So I am still holding mine too, but it is based on the possible triangle breaking out on GDX – GDXJ is now tagging the 200sma, which I expected would be resistance. If Gold can break out, it may too.
I do not usually hold leverage beyond this point, but I’m up enough on it that it will just be less gain if it drops.
And if Gold does run above $1300 and peaks on lets say day 20- 23 before starting a dip into a dcl, I’ll definitely be lightening up on the way higher, but individual Miners I would probably just hold on . They can resist a gold dcl. RGLD, IAG, FNV , etc have pretty much been doing that – marching to the beat of their own drum.
Good explanation. Thanks!
Alex how did you play CENX – did you jump right in after the earnings hit?
Actually Ron, sorry if I gave that impression, I didnt buy CENX personally in my account. I traded HBM & Jumped back into TGB, SID, etc , and CENX has done well ever since dropping drastically to the 200sma, and then regaining it & the 50sma, but I didn’t grab that one .
I think I was just mentioning it as a Commodity ( metal ) Stock that has done well after earnings. Sorry if I gave the impression that I bought it.
That’s my misunderstanding – I was just wondering in relation to some of the PM miners that got knocked down on earnings.
Does anyone keep a list of lithium miners? I have ALB, ATU.V, CRE.V FMC, LAC.TO, LIT, LIX.V, NLC.V, NMX.TO, ORL.TO, SQM.
WWR (previously URRE)
Thats a better list than mine 🙂
Now it’s yours too!
aww .. so sweet … ;o)
#SuckUP
and you can play too M!
https://uploads.disquscdn.com/images/788d5b0c9709bb3b32cf021c76c291c87ac30967545d0dc8a082e849331d53c9.gif
Did I ever share the story of MGXMF? It broke out & is currently dropping to back test both the 50 & 200sma.
They have patented a way to recover Lithium from waste oil, and this could be big down the road.
It takes throw away waste oil & makes it useful. It is called lithium recovery and they also call it their PETROLITHIUM PROJECT
Take a look at a 1 year chart
LIXXF
AXU has now popped uover the 200 day MA, one by one they join the party.
and ALO
i like TGB and Goro …. too
Just grabbed some of that this morning. ALO
you’ve probably noticed.. but no *MVF* from DNR at the moment
yes.. she bit me .. i had to break up w her.. she’s still my friend… we’ll catch up again at summer camp **absence makes the heart grow fonder… ;o)
I’m still half in OAS.. and she has ragged me around a little.
likely a dumping if she breaks the lows here
looking very similarly poised (on my bigger charts, at least), are GPL GSV SSRM and maybe GSS
For me, I really like some of the chart set ups, but volume is lacking in many of these jinuors at this time.
THM for example, I really like the set up on a 1 year chart, moving over the 50 & 200sma. Also it is up almost 5% , but it traded 5000 shares in the first 1/2 hour?
At 55 cents, what does it take to push a 55 cent stock up with 5000 volume? $2500 . Someone could sell 10,000 shares and ruin a good thing.
BVN is putting in a stealth climb?.. advancing on average 1% or so, every day for last 7 days
NAK – it can just keep going here : )
IMMU breaking out.. again.
hey Bay.. TRXC isnt looking half bad.. maybe a that gap close you were suggesting is possible
I like it
+17% so far … nice.
Shippers bought friday not quite so nice
LOL yuppp Im feeling that pain today as well
IMMU looks nice over the past few days. I like several Biotech set ups
OMED looks good.
I bought OPHT – trying to front run a move higher – huge drop & lay off last Dec, but 3 month chart shows improvement.
And I hate to even mention APHB, but it also has that LONG base on a 6 month chart and keeps popping
ZIOP trying to recover, EYES popped 10 % 🙂
VSTM still climbing that 50sma, but no real signs of life yet , CGIX weekly is interesting
Etc etc
Does anyone remember when we traded KITE hear around $40? Boom today
Oh my gosh. Yeah I sold somewhere around $50-$52 last year. 🙁
Bull runs are hard. A famous trader said that once!
gamble time – I don’t have any idea how to be successful at options – none, and Kenny doesn’t seem to be around to ask, so I took a tiny stab at TAHO March 2018 $6 calls
WOW, 7.89PE and 5.43% yield.
if you call out to him … he usually magically appears………….
*or insult him in my instance…………
tehee…
Yo KenDawg…. step away from the pool bar and help a brother out….
https://uploads.disquscdn.com/images/8048aba200f80772129176d9c83003f575df5edc8e65045a1c1c158f013ae67d.png
oops .. wrong pic… im in MVT planning mode………………………….. 😀
Well, we´re not getting the fireworks we would all like to see in the miners, but can´t complain with them going up a little every day, either. We will see how they act in the next pullback, meanwhile we inch closer to that golden cross in the moving averages of GDX, which should complete this week sometime as long as miners don´t get unexpectedly smashed. Maybe it will be the next cycle higher that really gets going to the upside?
AXU pop today.. – some are doing well, others still charging..
USAS.. dang… but no volume as well..
YGE Shaping up after a long downtrend. Finally able to Break over the 200sma now.
Hi Alex,
If oil drops a bit more…are you still in the camp that it is not a failed cycle but extending out the DCL. Thx
I feel that it would be still the first daily cycle , because it didnt break the down trend line, and it would be a peak on day 2 after such a strong run out of July lows. It wouldn’t make sense for those reasons, but I still think that I would stop out & re-enter if I was long to be safe.
Alex, what are your thoughts on AKS? Thank you.
It looks to be bottoming and todays pop is pretty good follow through.
It should get tot he 50sma, and we’ll see if it can break it, todays volume so far indicates that it has a good chance of doing so.
GOLD go BOOOMM
😀
I had been watching it on the 5 minute, 15, 30, 60, etc – it just kept pushing & dropping, pushing & dropping, then finally the dam broke 🙂
Now we need some short cover & follow through ( From everyone that got scared away or went short due to the COT article writers.) 🙂
Looking for a Miner, GSS broke the 50sma and landed on it Friday in a back test. I bought today at the 50sma
Wish I bought more now.
REFRESH- SWEET!
https://uploads.disquscdn.com/images/7e76fc8037e55b6133f3295255d49129b26c334153bc4c6ec8efd876e8b3324f.jpg
mmm mmm mmm ……………. DELISH
there go the SA shorts, run you little buggers
Chart is picture perfect with MA’s bullishly aligned, 10dma above 50 dma above 200dma.; sweet!
I spoke too soon!!! 🙂
GSV just popped a weekly PSAR buy signal, first time since Fall of last year.
Again, thanks for the reminder on GSV. I was literally getting ready to cut it today lol and now up 11 cents on it
I may be foolish, but I am taking a shot at DUST here. Short interest is my biggest concern on GDX. But short term GDX looks extended to me. False breakout? Dollar downside getting exhausted as well. Seems pretty lopsided out there. Willing to take a little drawdown on this. I know I am lonely on this trade…..Be well all.
Maybe wait for a reversal? Just to be safe.
These break outs can get a lot of short covering
Thanks Alex. I think I will add here and add more if it continues tomorrow. My other positions are LABU and TQQQ, so I feel ok today even with the drawdown on DUST. The COT will be horrible this week, and I have been burned too many times betting against that. GDX daily now near past reversals on the RSI and stochastics, GLD there as well. Folks are just giddy.
Gotcha. ( Though I am bullish ).
And GDXJ blew through that 200 MA like a hot knife though butter. Several of the silver juniors kicking butt, like EXLLF and AXU.
Also, the SIL etf just flipped a buy signal on my long term charts after being on a sell since February.
MUX looks strong here…and finding Resistance at the 50sma. Alex and I picked MUX up at the Weekly 200sma and the 50 Day sma is resistance. can’t get any more perfect.
i was talking to her this morning…. asked her if she was gonna come screaming back w/ a vengence…. we shall see ….
I always liked and did well with MUX, just waiting for it to pop the buy signal on my long term charts, getting close. The good news is it has already triggered a PSAR buy signal on the weekly charts.
MUX looks very good, no one is saying MUX-SUX today 🙂
Do you remember that day when GOld dropped Monday $10 and Tuesday $10 & I mentioned buying( or at least watching) the ones that held up or were green, they could be leaders.
Refresh for 2 charts , this is just 1 example of the ones I posted back then
https://uploads.disquscdn.com/images/b5492c1b774ea71e11d3b71cf4c666a82ee734fb64fc0a32f1889814c1a094d2.jpg https://uploads.disquscdn.com/images/50cc8763581bd12c6c74dff90392869ce152570896d4c0124ba4bc4524d6ecc9.jpg
It’s a beautiful thing! Inverse H&S : )
I do! Interesting how some – MUX, AG just now set new lows while SA is WAY above Jan lows!
She keeps climbing! (GOLD)
So do our accounts : )
Shot u a quick email boss.
OK
Awesome day – it finally arrived. The miss-step was selling in early Aug – even though I bought back in near the same prices, I had to build that cushion again. Had I stayed I would have been more heavily invested now. But I learned lots along the way on this trip – so far – thanks CF – fun to be on the right side of the market for a change.
Thanks Ron – It’s never an easy ride ( well, maybe Jan 2016 was easier ) , I always get emails of reports of why we should be selling, but I try to stick with the over all picture and set ups. It has been pretty good trading in Commodities and even miners the past few weeks, and it could get a lot better fro Miners once the desire to accumulate comes back.
Choppy if we get a back test, but I think we could start seeing trending higher type moves.
GDXJ leading the way. JNUG up 10.3% so far NUGT up 9.9 % …AND CLIMBING
Ive been adding along the way JNUG, NAK, CLF. Do you think its early enough in the cycle to keep adding? SA, GORO, AUY etc.
I’m looking at many Miners and the set up in some are just starting to get going, they are just moving up off fo the bottom.
Miners ( GDX & GDXJ) were in a triangle, so I have been looking at it is a triangle and less about cycles, but even at that, the cycle could top in a week or day 23 or so- who knows.
A dcl in the future could be a back test of the triangle
Let us know if you add. I’m not long enough but if we gap open again, probably not gonna want to chase.
I added GORO Yesterday
Gold now the highest it´s been since the election. 🙂
MUX is up over 9%. he’s on fire.
It’s going to change to MUX_ROCKS : )
No… Never lol
NAKKY dropping back.. chance to reload (i hope)
Dipped my toes into a leveraged etf that should move 2x the silver etf SIL, more or less. SIL flipped to a buy on my long term charts today along with all the others I mentioned today. I´m not going too heavy bc I hate buying into up movement, when we get a pullback will add to my individual names and hopefully pick up a few others (ones that were weak if they don´t pull back too much and start showing relative strength, like MUX).
Though I a not involved in the recent laggards like EXK and AG, it´s good to see them join the party. This move looks solid, no pulling back today, just up then sideways before up again.
I agree, I like to add of the dips and at support levels, but I actually added to GSS today at the 50sma , it hasnt broken out yet. I also added to DRD
refresh – was just going to tweet this out
https://uploads.disquscdn.com/images/7820f4077aec00bcdac1c46887cc021467172d073d7409893af0ce53cff5abef.jpg
looks good!
Anyone here used to follow Screwtape gold blog?
many moons ago i set up a chart (back to 1980) based on STs discovery that 10yr treasury yield measured in Silver, was inversely proportional to Gold in $.
TNX:$SILVER must be bear for $GOLD bull.
hadnt bothered revisiting this chart for many moons.. just out of interest i looked today.
it had reacted at the extended trendlines right on cue
https://uploads.disquscdn.com/images/f12af2673192519e02b8455547abb960ebc53c226c5d8e1a30c2871885ed0efc.jpg
funny u spoke of DNR…. hmmm hmmm hmmm … let’s see it….
#Proof
Wow, quite a reversal candle on DNR
its reversed a 3week indi downtrend on my hourly.
OAS likely doubled bottomed the lows today too.
was that the end of energy bear?
Maybe for some of the energy stocks, boy is trading going to get fun if it has.
It’ll be too hard to choose which buy set up to take though.
*not a bad problem to have 😉
Did you see VGZ today? I heard you mention it last week.
MANY of these juniors are popping & running.
CDE is recovering, AG popped, TRX VGZ, MUX, EXK.etc
yes … annnnnd cough cough cough .. .i think i feel a cold coming on and should stay home for a day this week .. couigh cough cough…. 😉
#Meow
i had a strange feeling that EXK was going to have a quick recovery…..
Me too, and still more to come.
This can lead to good % gain trading & even riding buy & hold
yes… dang AUY… theyre poppn all around.. i sure hope we have continuation ……………………….
i hope to high hell that we get that staggered situation.. where we can cycle in & out, with at least some miners always on the up.. like last year
and energy …. 😀
***juggle 3 oranges to make juice, while frying up some eggs, flipping some pancakes , taters, and bacon … ohhhh mmmm bacon……………………..
yeah..and not forgetting energy of course.
but how many, was it, are dead to you? 🙂
… REXX and HK kickd myA$$ pretty darn good….
i was possessed … ha ha ha trying to pick the bottom
#SoLastYear
*i hope i never do that crap again– spank me if i do ….
wait … NO DO NOT BRING OUT THAT GROSS IMAGE!!! ………
nope.. that was you(catwoman) spanking Alex(batman) and Bill(robin)
I am starvinLeeMarvin …… gotta bring home the bacon and fry it up in a pan…
hmm.. maybe BLTs tontie? ha ha
BLTs??
Still need to add, only a 1/2 so far for me
don’t ya just hate that 🙂
paralysed by too much choice
bring it ………..
instead of breaking something by talkin bout it… its a rare case of fixing
LOL – I do that all the time with NAK. As soon as I write that it could just keep running, and it was up 6 cents, I look and it is down 2 cents.
Well, I could always come in and mention it.. then stop Maria out
HA HA HA
Actually for certainty, need to get Cason to buy it
HAHAHAH
LoLoL.. just be absolutely sure..
(I really hope Cas had a good profitable day in miners!)
HA! No DNR for me. But how about MUX finally leaving the “UX” out of SUX!
Remember this when NSU popped and I mentioned that EXK had a similar set up .
The recovery begins : )
refresh
https://uploads.disquscdn.com/images/f34c71cecc27a3a1b8d5b2aceb238951af4a8a007f45369f9392594a475148fb.jpg https://uploads.disquscdn.com/images/167a8a7dd017177ec060266407405d55597ed6a60d8d5e812d62baa883a085ab.jpg
In it to win it!
SBGL man I missed this one too
how do ya figure u missed it…. what if it continues along as in the previous impulse wave… hmmmmmmm???
https://www.tradingview.com/x/jYdX8qzN/
Let me rephrase. I didnt add at an opportune time… And I hate seeing red lol
u get a gold star
To be honest Mama… Thats why I was so caught up in day trading… In – out move on.. Then I started playing with the freaks here in our sandbox and realized the gains are just as good with less stress. My only issue is, I find myself missing the good entries as Im still looking for the momo plays for the day…
annnnnd i used to LOVE swinging … and then got the brainy idea to try daytrading… nowww i STINK at swings becuz i cant bring myself to sit thru the corrections that I know are coming … 😡
LOL so what needs to happen is we combine our powers..
we go to Aruba for 26 nites? 😉
*all of us
I was jsut about to say.. Sign me up, but I hope its field trip… My wife wont let me play with other girls on the school yard anymore..
https://uploads.disquscdn.com/images/b6ead37867962e644c526923f990e9dca83989b98e83795096dd62942267721a.png
lol
Most Bulls get angry when they see red : )
#bullfight
Your going to look at DRD and say that one day too : )
Lol dont force my hand… becuase I added when U mentioned it.. Im tired of missing the ones u get in. lol
oh, no , now I feel ‘responsible ‘ 🙂 I actually bought it today, it looks to be moving out of a base, so we’ll see if we can get some follow through before you get bored with it ( or me , I guess that fits me too). lol
I only grabbed 500 sahres of this guy… Slow mover… Would like a larger position but Ill add as it moves higher.. Looking pretty good right now.. Days like today make me really wish I had been adding more miners these last few weeks for holds.
Not speaking to SBGL directly, but if my charts are worth anything, then this move in miners is just getting started after a one year break from the 2016 highs. If so you have only missed a few percentage points out of things that will be up 100% or 200%, and you want to be early to benefit from the compounding!
I cant/wont argue that… Its just s new thing for me to enter into plays and hold thru dips… When I learned to trade, it was always low floats, in and for 10-25-50 cent moves… maybe hold over night… This is new”er” for me. My retirement accts are good at it, but not my trading ones.
Some kind of do both, and it is a learning process. A bit more buy & hold in retirement during bull markets, trade the trading account selling rips and buying dips.
I had the exact same problem when I started out. I used 1 style only ( it worked) but not well during pullbacks.
thats my other thing… When Im playing a low floater runner, I go in heavy and get out fast.. With Miners (or our plays) I only go in heavy if I can catch them at a nice support line or MA, or Im adding light at bad areas and selling for minimal gains.. Work in progress I guess.
I grabbed another nice chunk of GSV at 1.75 today, not having any clue that things would spike the way they did today. It hard to admit but little GSV out of everything Imm holding has the biggest return/position in my act right now for miners.. Im not sure how I feel about that… I added some RGLD today and added IAG back but both in the IRA..
I sold my SID- taking profit. There is ABSOLUTELY nothing wrong with it. It looks great, I just dont like to hold more than 5-10 stocks & I do think that some of these Miners are going to pop.
SID has been good and still looks very good, its just that on this chart it MIGHT, MAYBE drift sideways to the 50sma and then break out above that 200sma. That would take time, so I cashed in to use cash elsewhere. I just want to say 1 more time, this is a great set up & there is nothing wrong with it, and it could even just burst higher .
If it does go sideways, I may even buy it back later for the break out through the 200sma.
https://uploads.disquscdn.com/images/0d62bd99462dff26abb0e98ddbad6a728a3921a83fa1a804500edcda6c21188b.jpg
The heavy buying into the close was great to see!
Really cranked up the volume total for today too.
GDX had over 77 million. Very nice
And GDX is trading up nicely after hours as well.
I agree, and many of the miners closed right at the tippy-top of the day, implying more to come in the short term.
NK launches at Japan – gold spiking – inverses spiking as well
Kudos to Alex for keeping everyone bullish on miners while many other “experts” were warning of a coming DCL/ICL. I’m loaded with NUGT/JNUG for the ride as long as it lasts. My weekly and monthly charts for NUGT/JNUG look bullish so I hope this UP trend lasts for at least a few weeks. I have not posted lately because I have nothing important to add, just follow Alex’s lead.
https://uploads.disquscdn.com/images/e2aa6da9d793853b01d2794602c7ede2f654dc00967565e8938c96563bca17f8.gif
Good trading to all!
Gold going off – nk missels smh
Remember when Euro was $1.05 and USD/EUR parity was an absolute given? Now at $1.20 overnight!
And boy did I have a pleasant surprise when I woke up this morning!!
I need to be more heavily invested than I am, but I do have positions. Had a stink bid in on JNUG for past week, clearly that didn’t hit. I know CF will get us the next good entry. https://uploads.disquscdn.com/images/87c6951fee18505451a04f7783a38b96f3ec1b2a4aa0f96e6bda9bae8dedf7c0.png
I was gonna go long gold at the DCL. Always was the plan and didn’t do it. Ugh!!
As in GLD Calls
This mornings report has been posted
EJ, it was in the report above
Both XBI & IBB were shown to be bullish