Archive for month: July, 2017
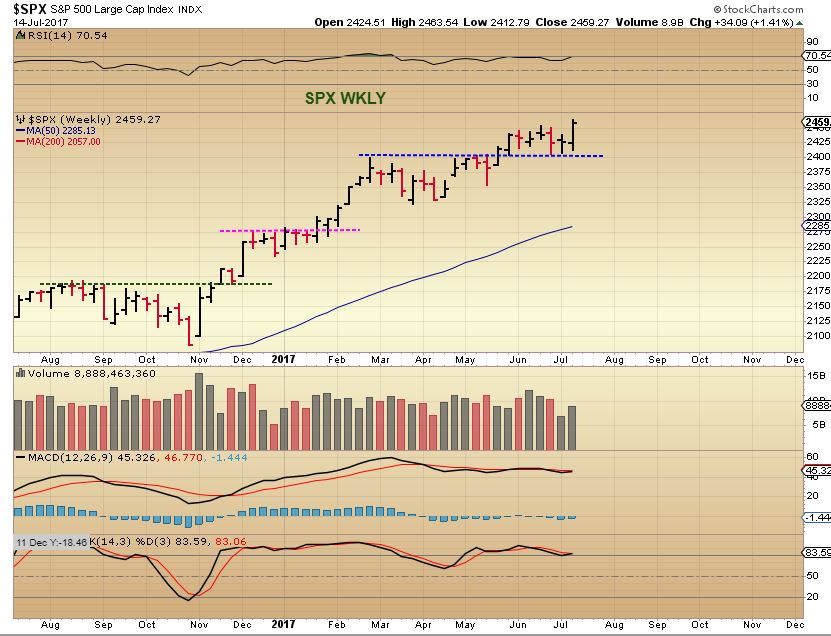
SPX - When we gapped up over that trend line ( Again, see April) and held above the 50sma, it was obvious that the bull market remains in tact. The SPX also experienced follow through last week. I'm not saying that we will drop soon, but that last Gap in April was filled at the next dcl as a back test of the break out. If we get more sideways movement than upward , that may be what is happening.

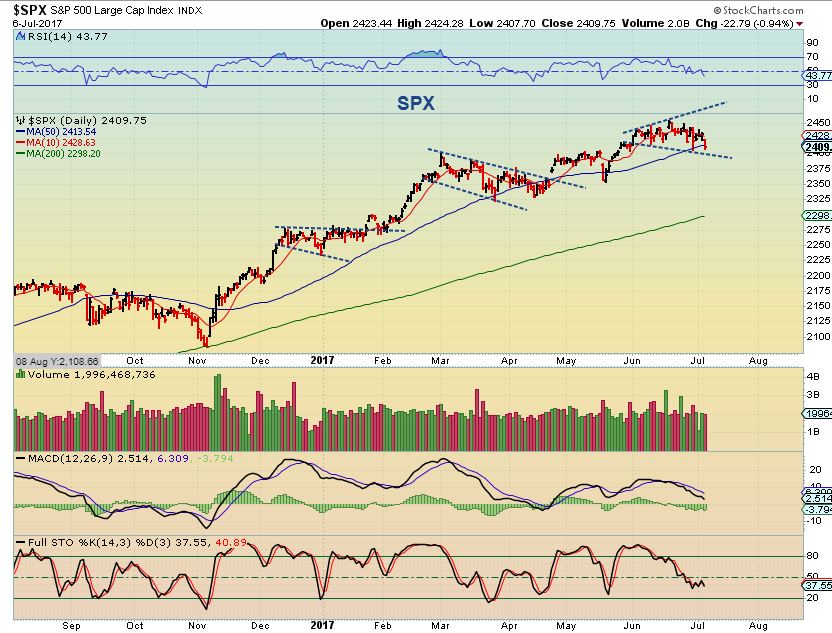
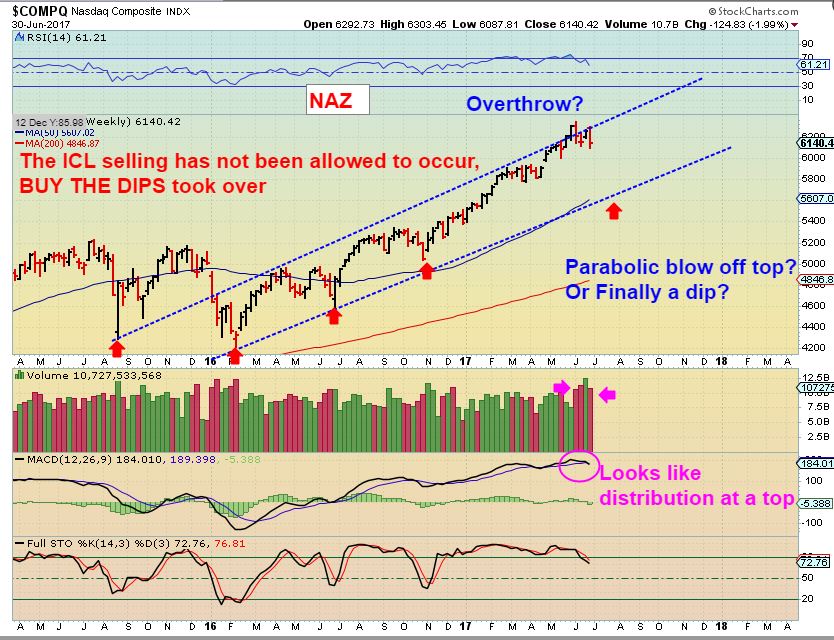
SPX WEEKLY - Bullish, though extremely overbought.
 Read More
 We traded LABU ( XBI, IBB) in June and made some quick gains. I believe that it may be time to go biotech again.
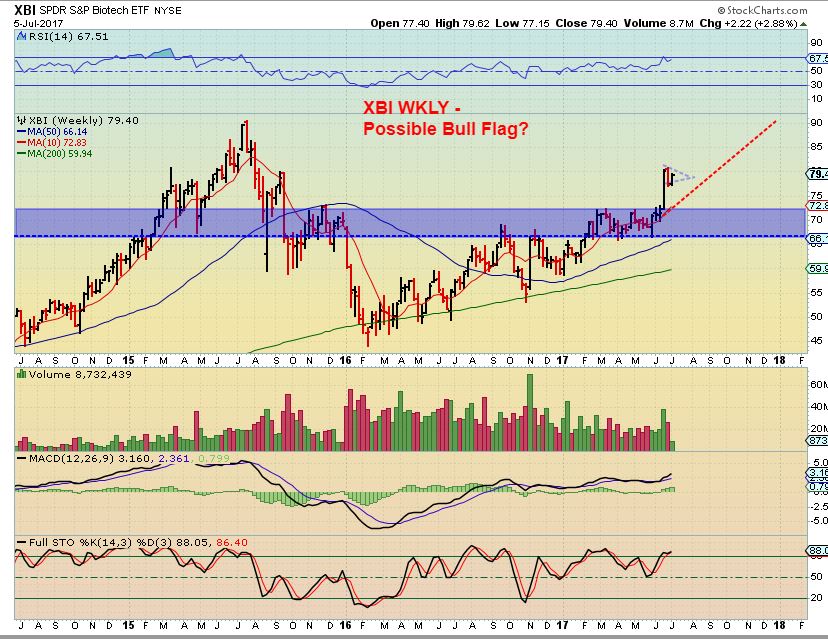
XBI - After a solid run higher from a bullish W pattern consolidation, the XBI & IBB has formed a bull flag. Both broke higher with increasing volume yesterday. This can be bought here with a stop under the bottom of the flag. I want to point out that this Flag MIGHT turn into a longer consolidation pattern too. See the next chart...
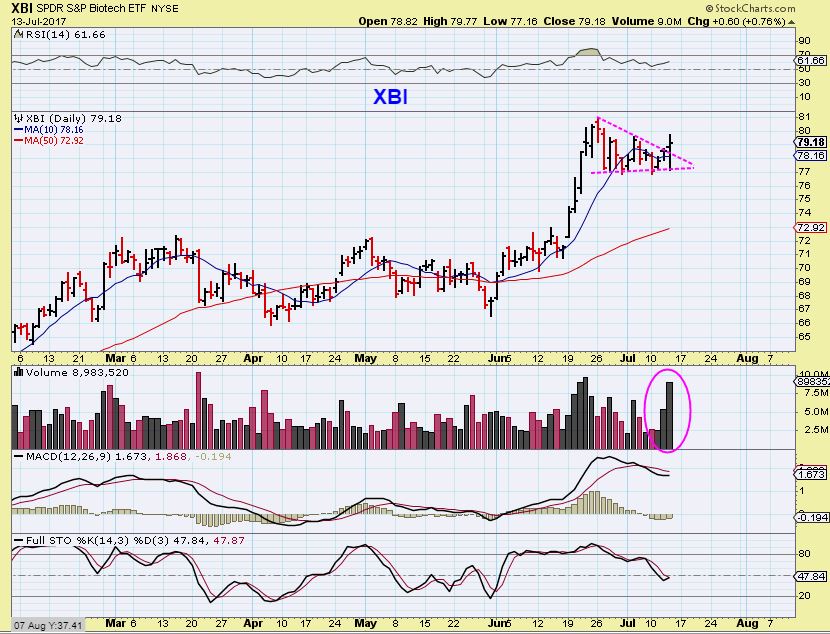
XBI JULY 5th - I noticed that some readers were shorting XBI & IBB in early July, so this was my chart from July 5th showing that a bull flag could form, not making it a profitable short. It could run sideways for weeks until the 10ma on a weekly basis catches up. My target has been the former highs around 90 .
 Read More
The climb is hardly ever straight up.
.
SPX - We were anticipating a trend line break and a close above the 10 sma to help confirm a dcl. We got it. The last time that this happened, the gap filled one month later.
 Read More
I've been posting a variety of trade set ups in the past few reports, and we are seeing some nice follow through. Let's take a quick look at a few Market Sectors and then discuss more trade set ups, and current trades in the works.
NASDAQ - The NASDAQ closed above the 50sma and the 10sma and that is a bullish start to a new daily cycle. We do need an overhead trend line break, but I wouldn't wait that long, I would go long on this close above the 10 & 50sma and just keep an eye on it until it gets a bit higher.

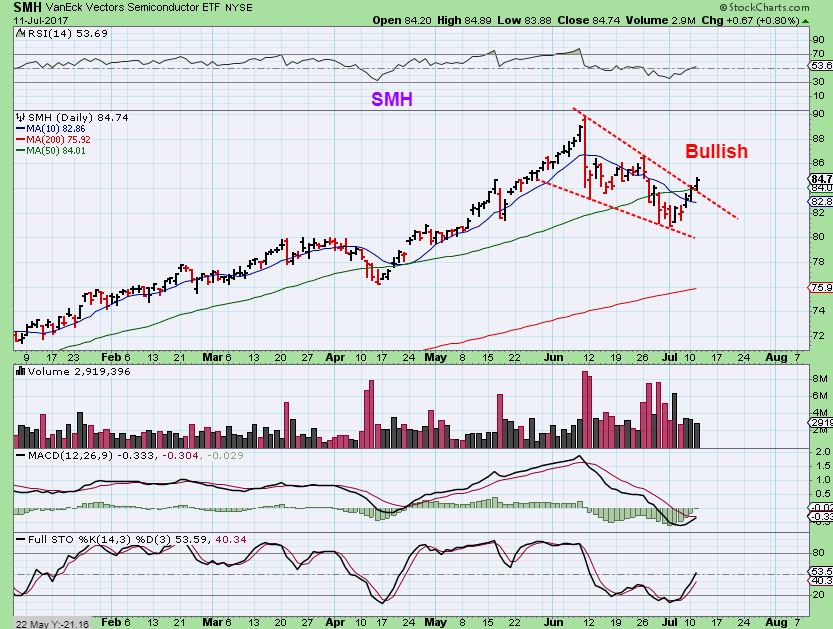
SMH - This is a bullish chart. It is ahead of the NASDAQ, because it did break an overhead trend line already. This is a buy here above the 50sma.
 Read More
This is a long report. I wanted to discuss Gold & them Miners in detail in this report. I have mentioned that I am seeing various interesting things in that sector over the past few weeks, so let's just briefly review the general markets and go right into Precious Metals.
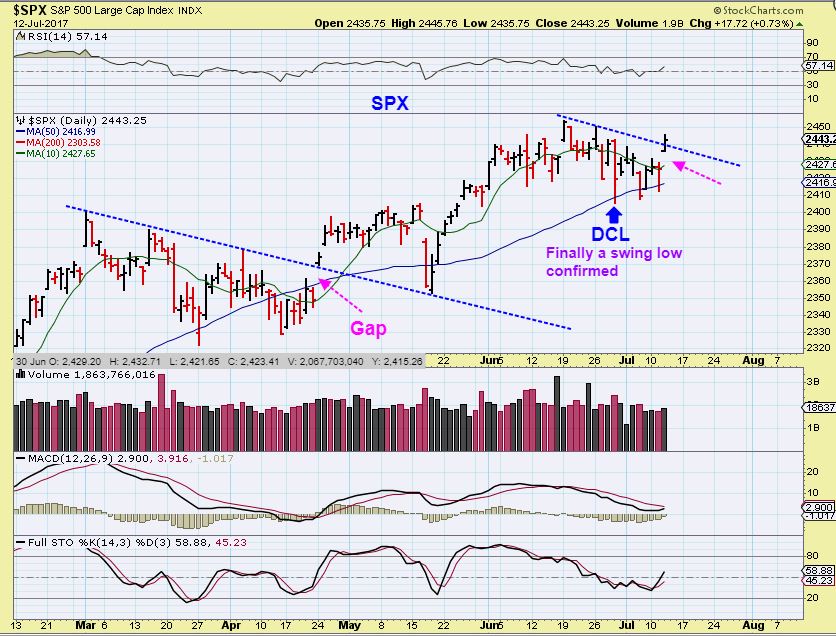
SPX - The actual lows were 6 days ago, and we do not even have a swing low in place yet. I would say that a close above this trendline & the 10sma should signal a dcl occurred, and then one could go long with a stop below that 50sma.
 Read More
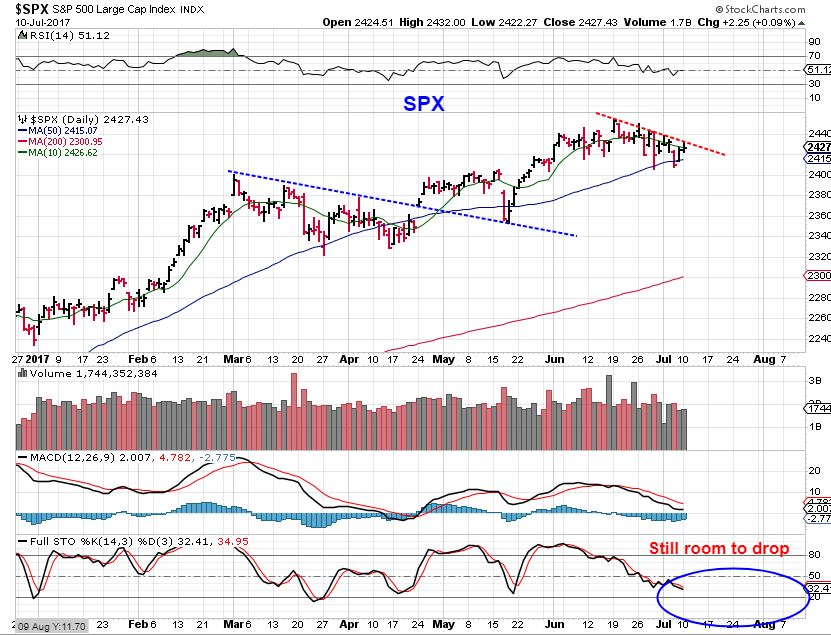
SPX - From Fridays report, this shows that the SPX could be forming a megaphone pattern as it sat around the 50sma.
SPX - Friday the SPX moved higher off of the 50sma, but has a new daily cycle started 6 days ago?
This is what I would look for going forward...
Read More It is Friday, the last trading day of the week. Jobs numbers will be released, along with the Natgas Inventory numbers. I like to remind 'traders' and 'investors' that today is the last day to be positioned heading into the weekend. I am holding several trades through the weekend, but I have been over 50% cash for a while, waiting for a solid buy set up to form in the Precious Metals sector. Enjoy your weekend!
.
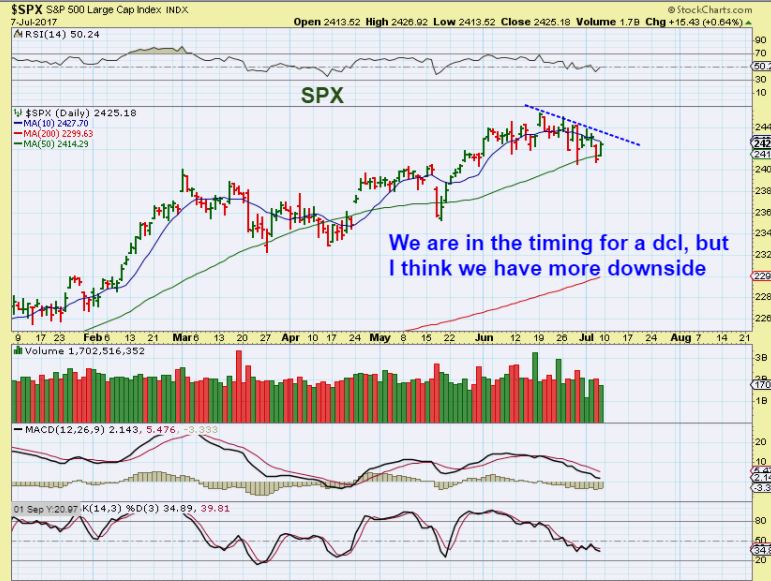
SPX - Closing below the 50sma could be a shake out. It was the last 3 times the SPX closed here. Either we sell down into the grips of a deeper ICL sell off, or look for a reversal and a close back above the 10sma ( not just the 50). Jobs numbers could affect the general markets.
Read More
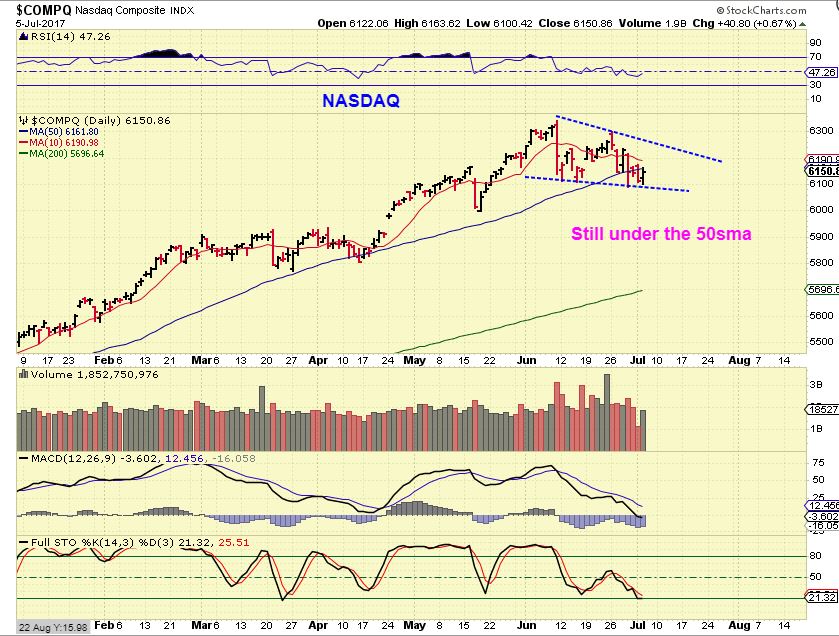
NASDAQ - We did see a small reversal , but we are still under the 50sma. I just don't think that we are there yet, so I expect further downside.
 Read More
 With only 1/2 day of trading on Monday in the U.S., wedged between a weekend and a holiday Tuesday where the markets are closed, I think that we can expect light volume trading on that Monday. Many people may have just checked out and gone away from Friday through Tuesday, so let's just discuss where we are with the markets.
.
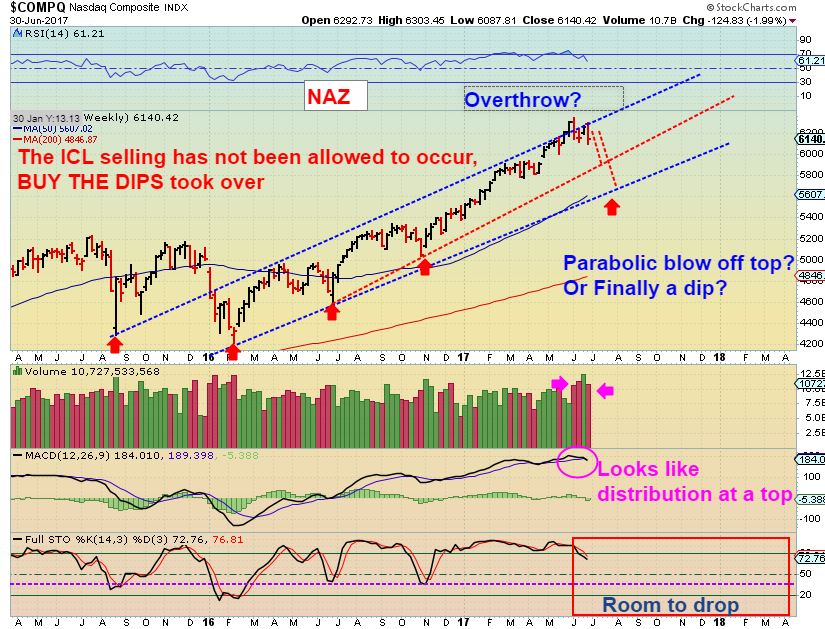
DJIA - The markets have started another sideways consolidation or pullback again, however...
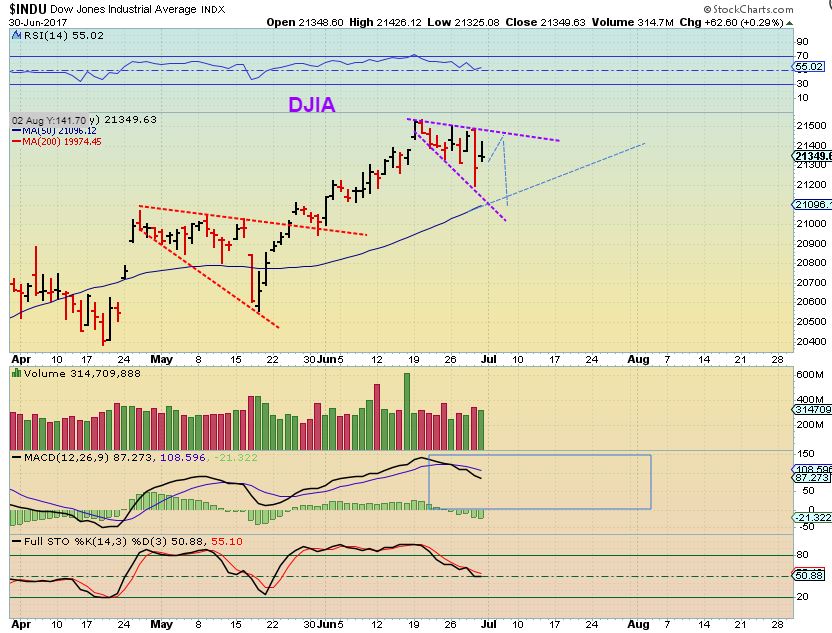
This does look a bit like 'distribution at the highs' with that heavy volume. Please read the chart.
 Read More
Scroll to top