
Feb 7th – She Caught On Fire
Look at a chart of SPX, DJIA, or even OIL and nothing has changed from the weekend report, so we are going to go right to the Precious Metals sector for a review of Mondays action.
.
Notice that the USD was moving higher for most of the day on Monday, but that didn’t hinder the gradual melt up that took place all day long in Precious Metals, right into the close.

For the USDs expectations, please see yesterdays report. The good thing is that the Precious Metals seemed to ignore the USD when it went higher Sunday night & Monday. Also please excuse any typos. This report is a lot longer than a normal Tuesday report and I will release it without proof reading. Thanks!
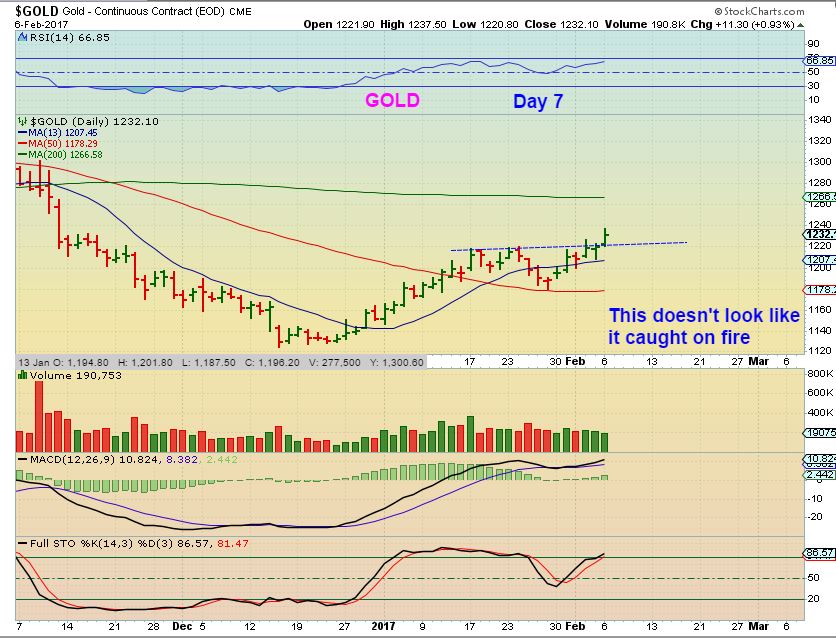
GOLD – I called this a DCL the day it tagged the 50sma, and I feel that this is day 7. I pointed out why I called it a dcl in last Wednesdays report. I started to point out many bullish set ups in Miners and many have been ‘re-added’ to our Dec low positions ( and many others have just held on for the ride). Doesn’t this look like it has more upside to it? I certainly believe that it does if this was only day 7.
I’m going to go right to GDX & GDXJ from here
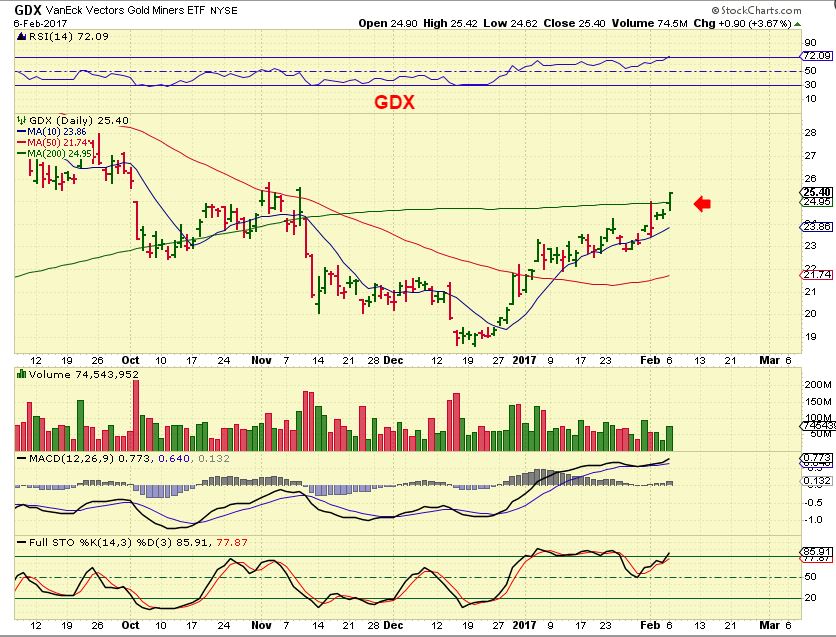
GDX – GDX broke out above the 200sma on Monday. Bullish.
GDXJ – This is what I wrote in the weekend report: A very Bullish set up – click to enlarge
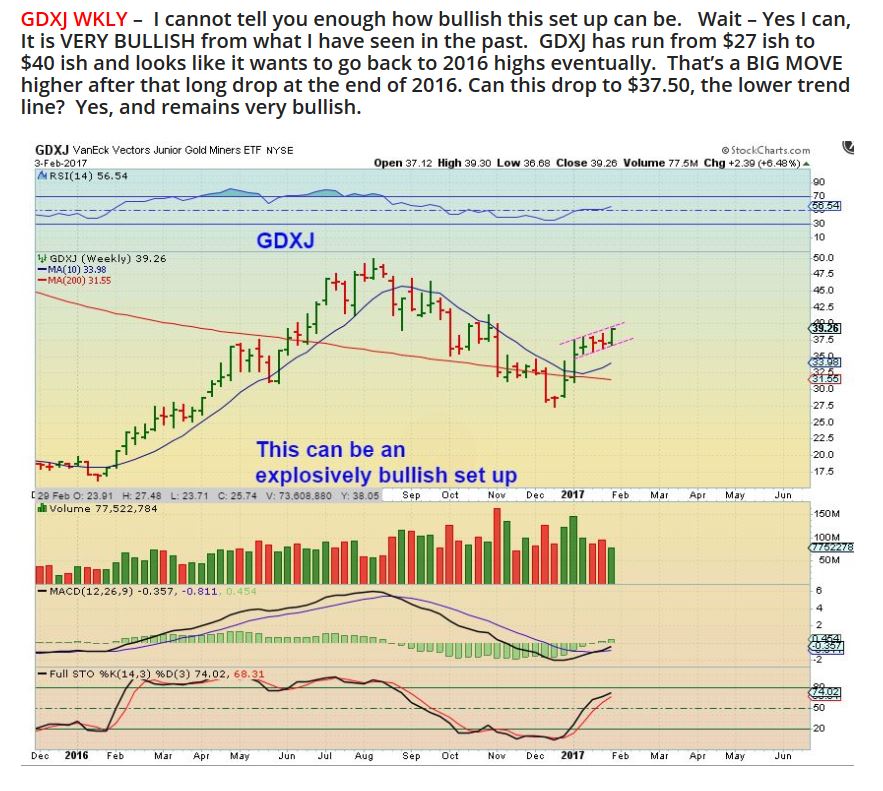
GDXJ one day later on the weekly chart, This is Bullish.
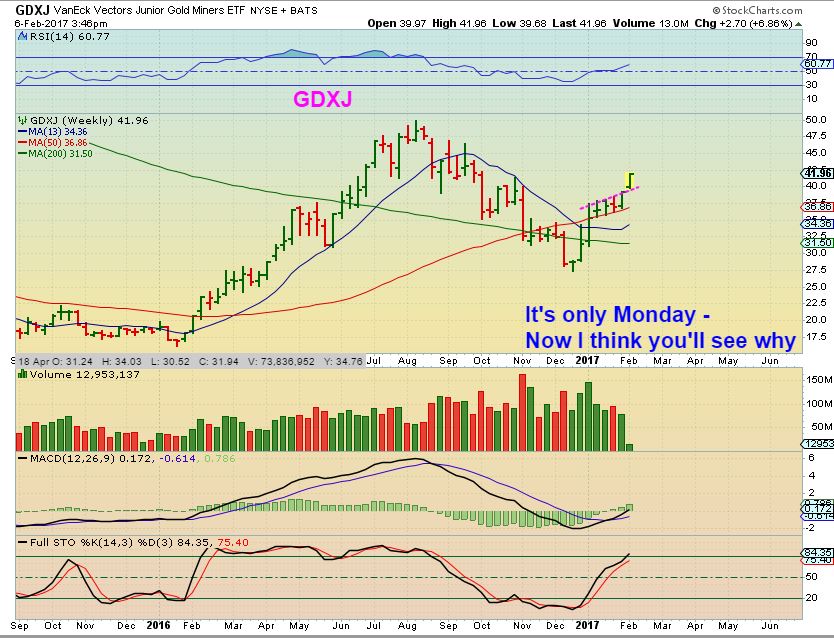
GDXJ was up over 7% on Monday.
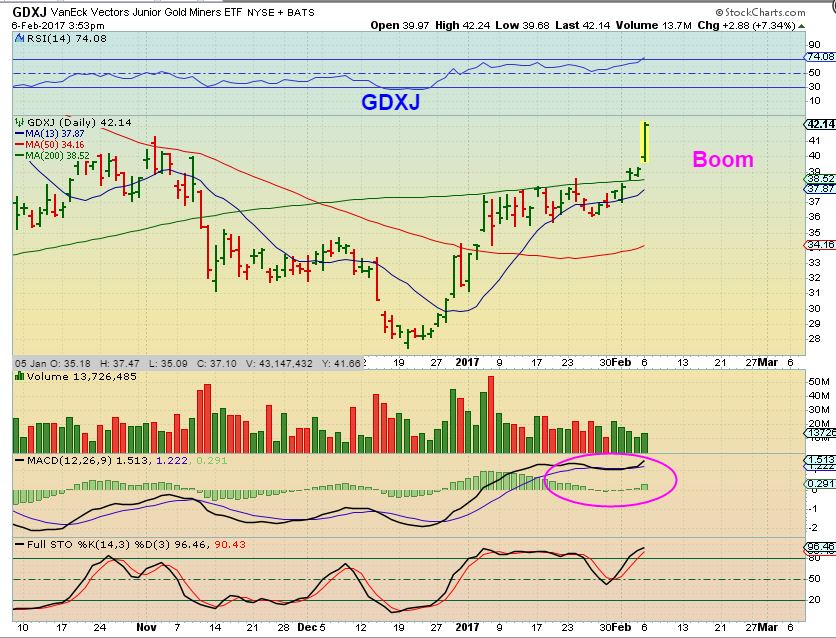
So from here I’ll explain where we are at and what to look for going forward. Like I said in the weekend report, we can get dips and swoons along the way, but I expect a continuation higher. I pointed out that some Miners are already almost back to their 2016 summer highs. If you have been following my advice, you still own Miners from the Dec lows, we didn’t get “too Cute” and sell everything, because this run should have several weeks of upside from the Dec lows.
.
Now I need to give a brief explanation of what happened with me Monday, and then you will understand the following charts. I was away Sunday night. Monday when I woke up and got to the computer, Gold, Silver, and the USD were all higher. I got home after lunch time and had about an hour before I had to leave again, so I started to collect ( screen capture) some charts of Miners that I watched and that were also really acting correctly in my eyes. I wanted to put them in Tuesdays report as possible low risk entries for any with cash on hand.
A problem arose: When I got back at the end of the day, they had all gradually continued higher in a melt up type phase. We will still examine those charts that I collected, and now I will discuss how they can still help us.
.
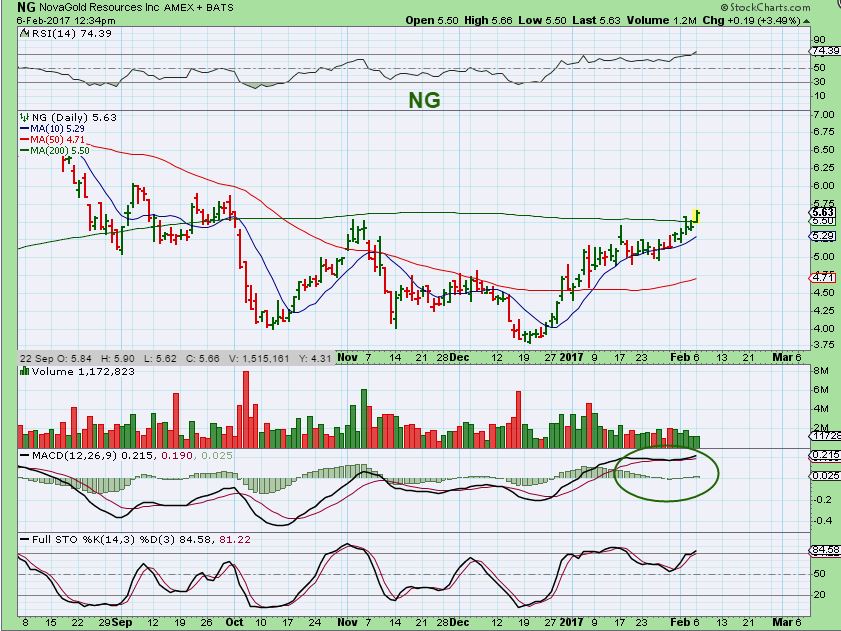
NG – At lunchtime NG was breaking the 50sma and I liked this if it closed above the 50. You can see the time stamp on the chart at 12:34. I thought that this should go into the report as a low risk buy if it closed here above the 50sma.
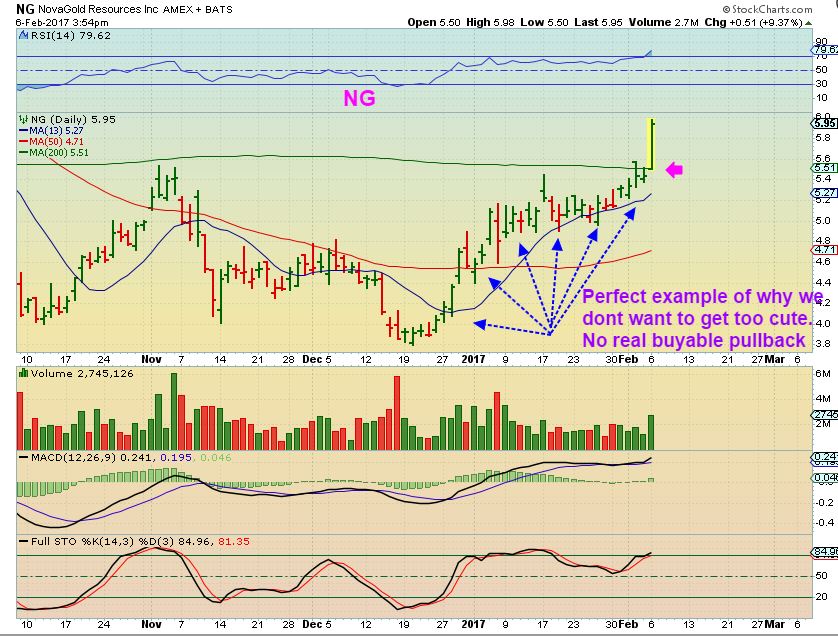
NG – I came back at the end of the day and look at how it melted up ( almost 10% now). It is now a bit extended short term. I still have higher price targets for it, but will it straight line shoot up there? Will it pause? Bull flag? Not knowing, I’ll use a different approach. Lets continue…
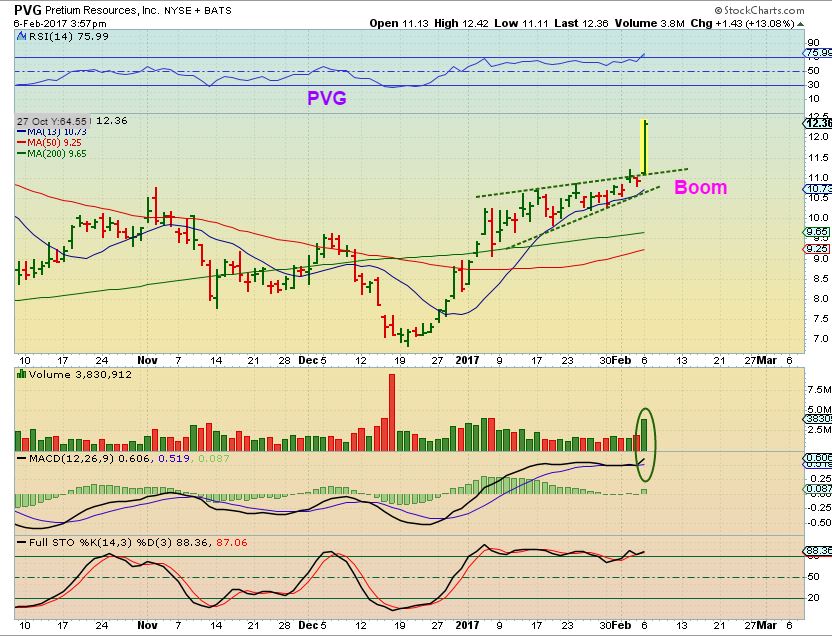
PVG – Another Miners that to me looked good here. Up 6% and breaking out. I captured this chart at 12:38 to recommend it in the report. Notice that it had no pull back. This will probably just keep running higher.
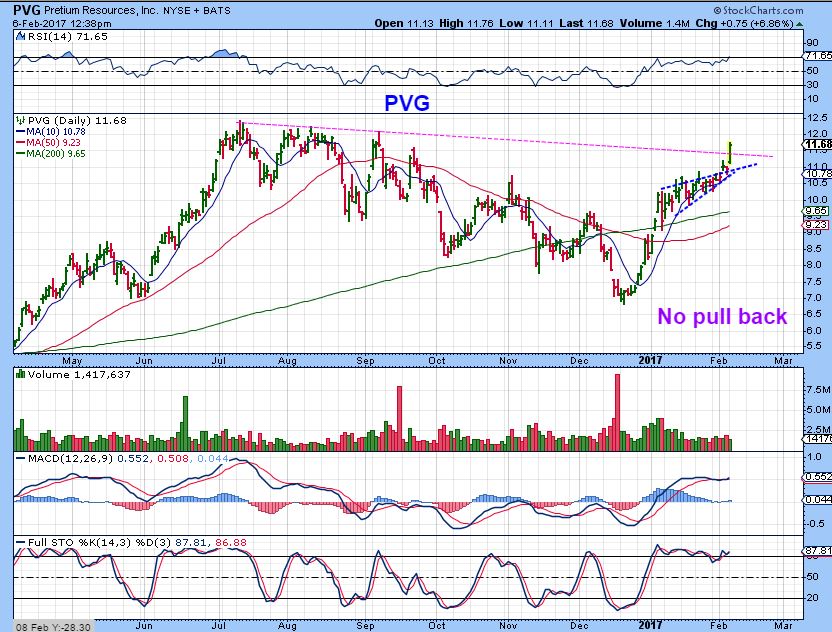
PVG – It closed up 13%!! How can I recommend it now, even though I do expect it to continue higher over time? It is more of a “Enter at your own risk, it could bull flag or pull back short term”, however it and NG are still useful charts. These are showing a sector is bullish and if you see a Miner breaking out Tuesday, you could enter before it just gets too stretched upward.
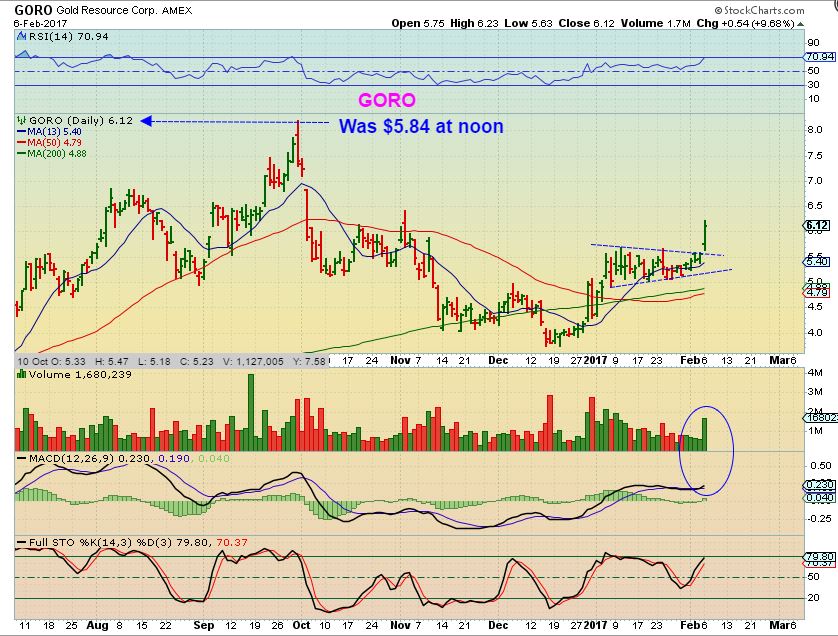
GORO – Captured at 12:32. Up 4+% , I liked it because not only is it breaking out here, it had the same volume for 1/2 the day that it had all day Friday.
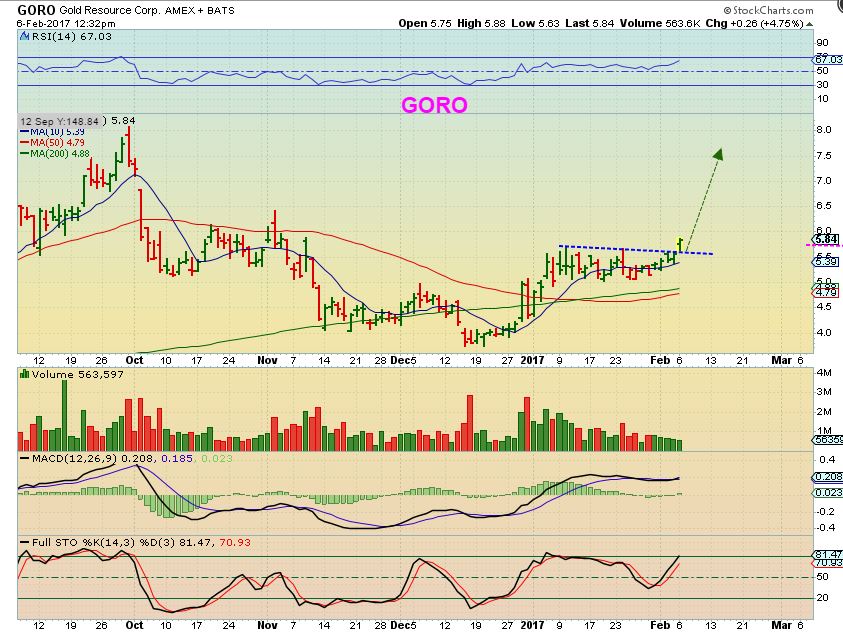
GORO – Then it closed at up almost 10%. It’s hard to recommend entering a stock up 10%, though I do expect that these could run to 2016 highs in time. AGAIN – these are good examples of what to look for Tomorrow if you are on the hunt for another Miner.
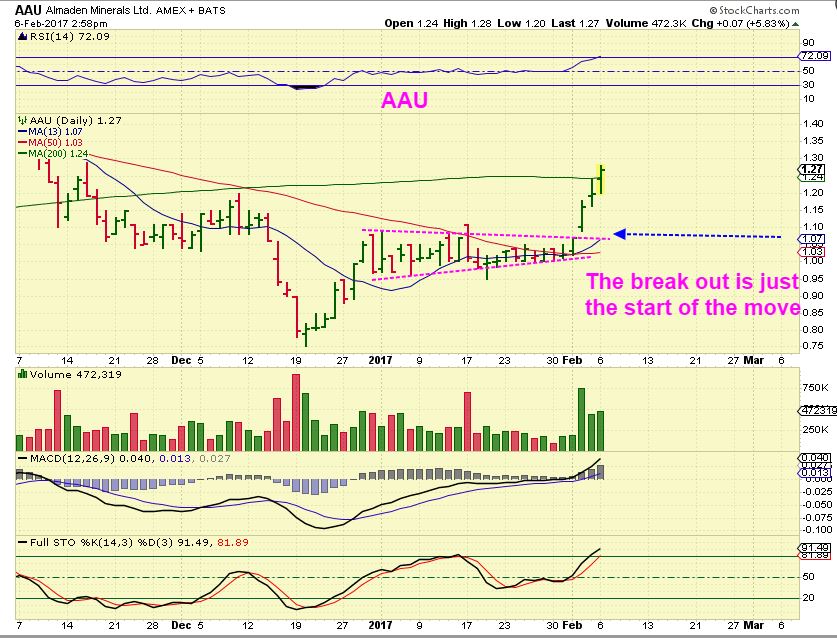
AAU– I wanted to show this Miner to make a separate point : The 1 day break out often is not the end of the move in a bullish sector, especially after a consolidation near a resistance point.
SAND – This was another one that I saw slowly moving higher at lunch time, and by the close it was up 8.22%. After a nice long consolidation like we saw in January, this can break out & run like AAU, but I still want to look for some that are possibly just getting ready to go.
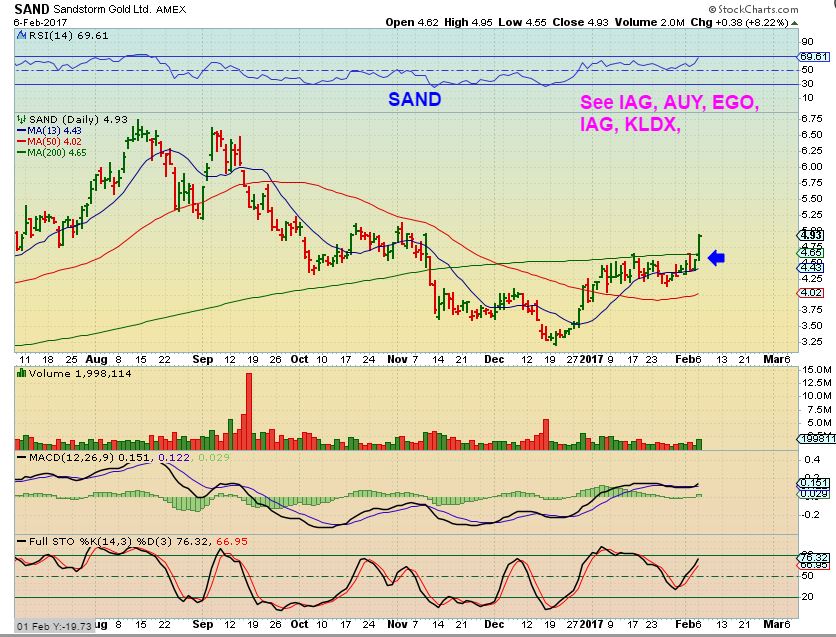
So the above examples can still be helpful. If you see one of your favorite Miners just about to break out above the 50 or 200 sma, or maybe it is already breaking above the 50sma, you may want to take a position. The above examples do show what I am expecting in the Miners. They are breaking out from the January consolidation and making great gains!
ALSO – I have others that started to break out and still look to possibly still be just getting going. Maybe we call them Laggers ready to play catch up. Let’s take a look.
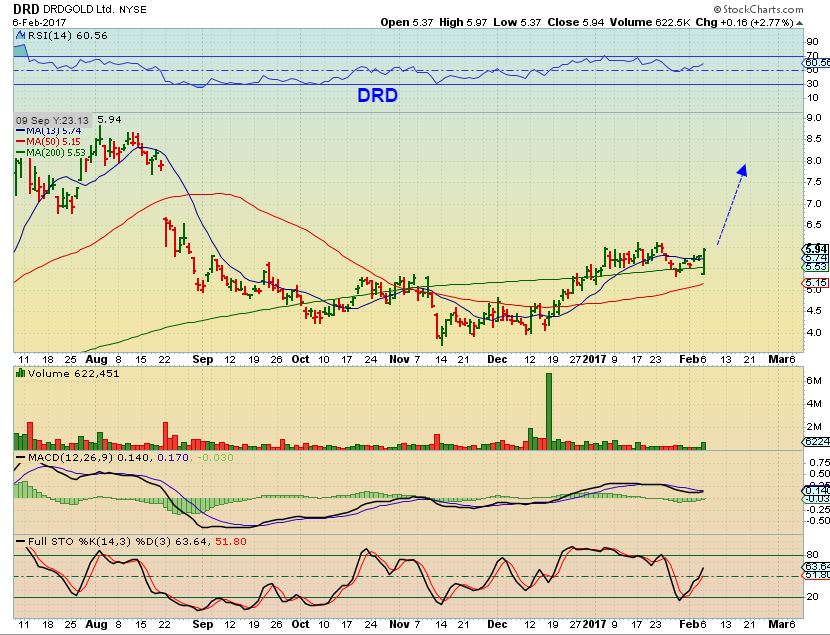
DRD – I saw this at noon and I could see that it gapped down 40 cents and was in the process of recovering. It was down 14 cents, but the weekly chart was a ‘buy’ the way I look at them. It almost landed on a double support area, and THAT was a great Buy area, falling on lightish volume. .
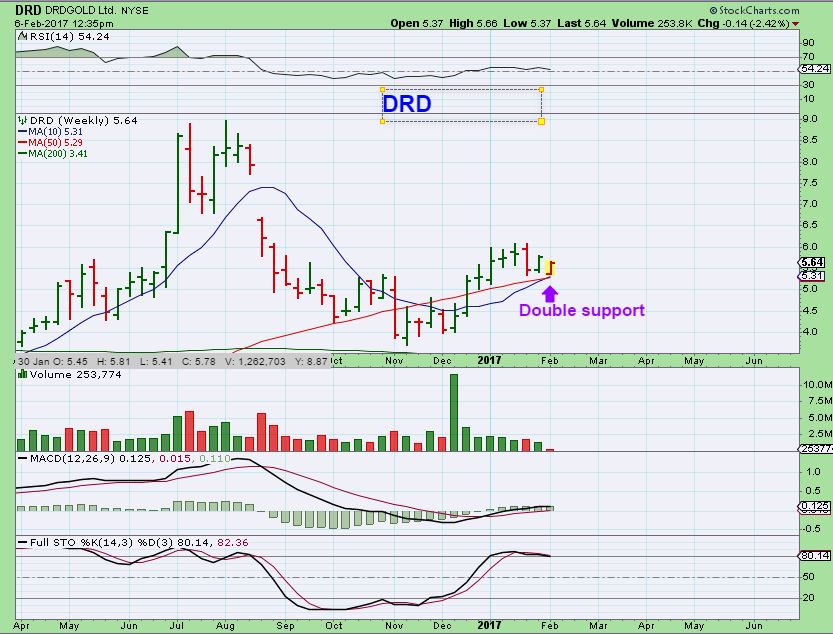
DRD – By the end of the day DRD was up 16 cents. Is this over extended? Not at all. With the shaky news out in the open, and this being scooped up, it could move much higher out of this long consolidation.
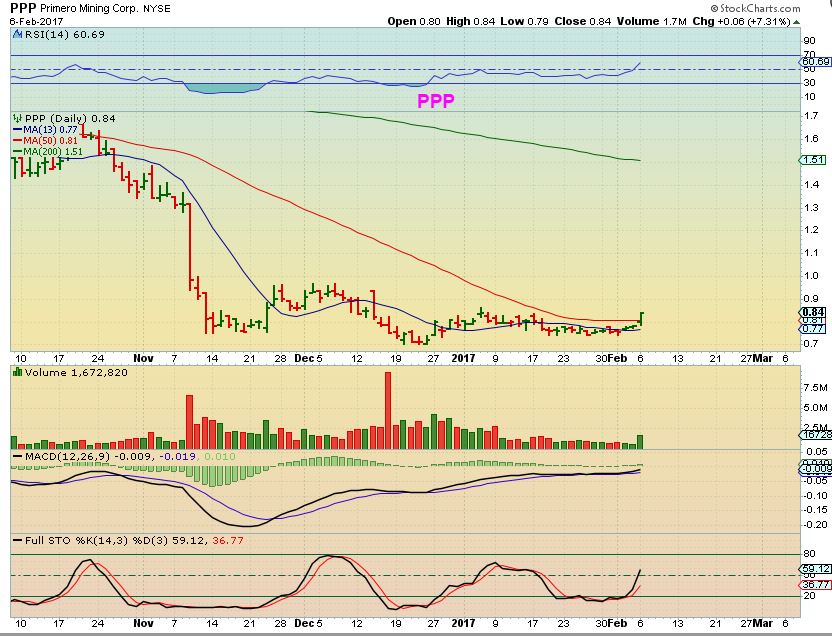
PPP– I have been watching PPP, and this was going to go in the weekend report. It didn’t go there because I was not happy with the dreadful way that it is acting out of the Dec lows. I wanted to see at least some sign of strength. This pattern did have me buying it at Noon Monday though, because it was just starting to pop from a wedge.
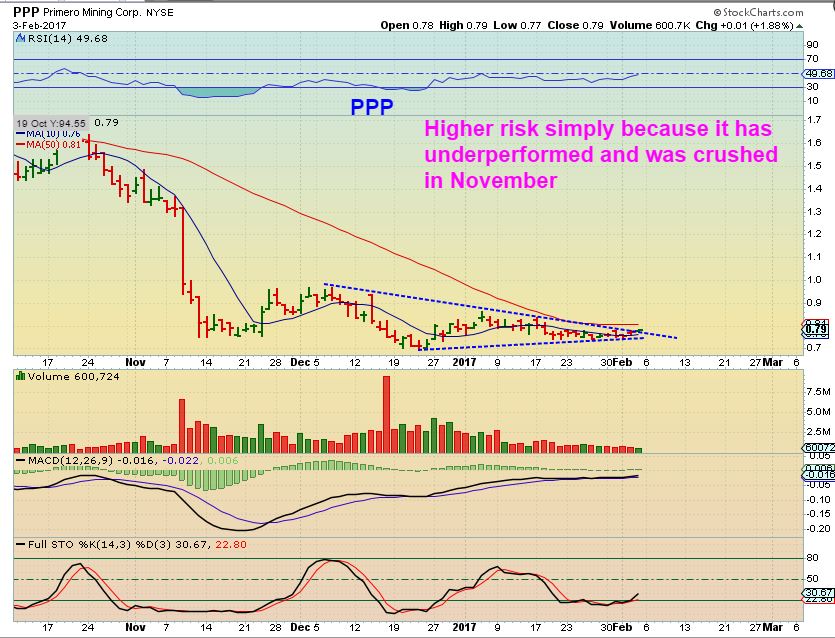
By the end of Monday PPP popped from the wedge and also moved above the 50sma. This looks like it could be ready to go.
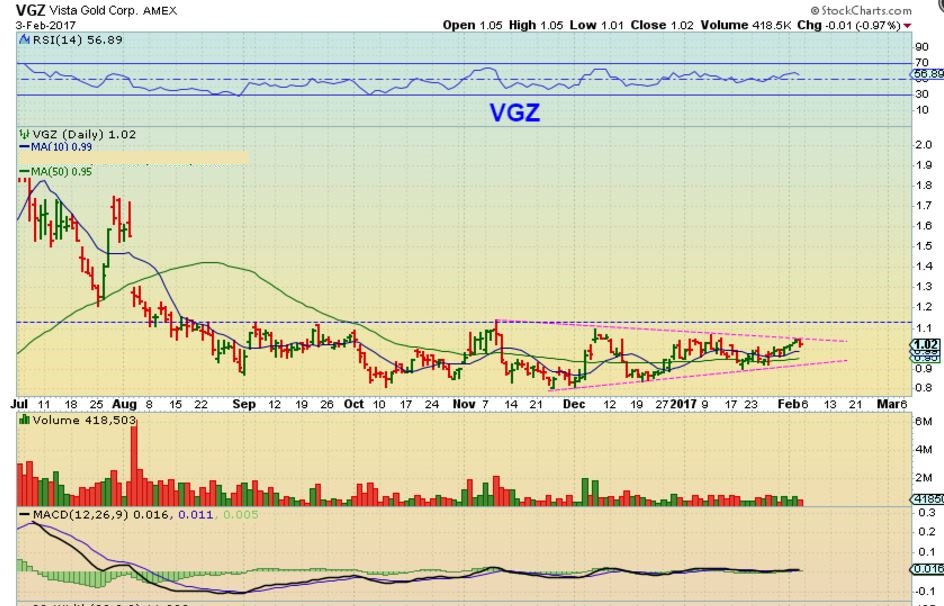
VGZ – Also from last Friday, this looks ready to break out to me. These long consolidations can be explosive, once they get going. UNTIL THEY GET GOING, they are BORING! This is actually an excellent base.
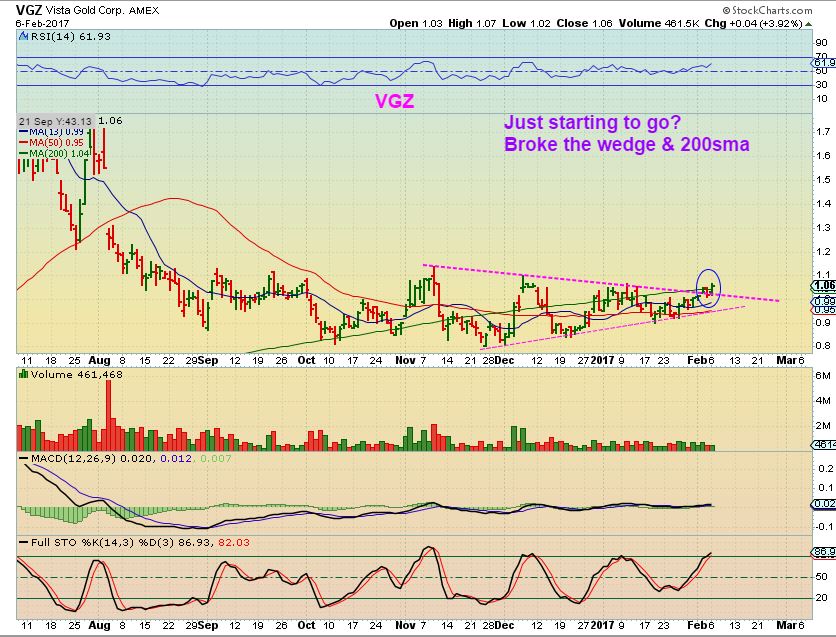
VGZ MONDAY – VGZ may be ready to play catch up.
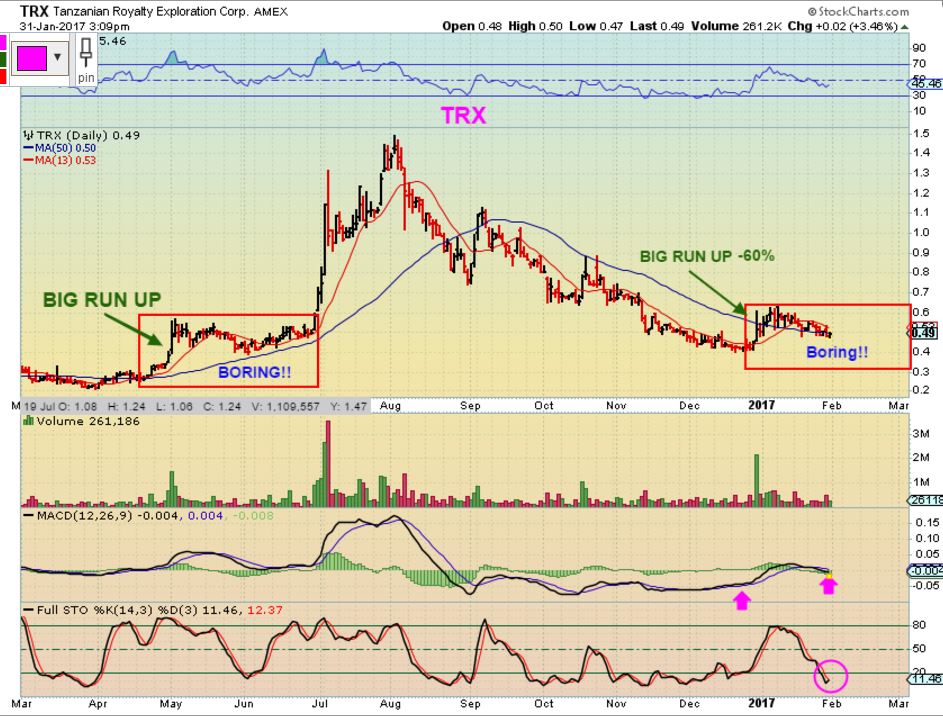
TRX – This chart is from the weekend report. I have been posting about TRX in almost every report for a week. I still have people telling me that this is not even responding to Golds move higher this time around, they say that it is dead, so let me review it again. TRX ran up 60% off of the DEC lows. I then recommended it again at the dcl.This weekly chart is bullish.
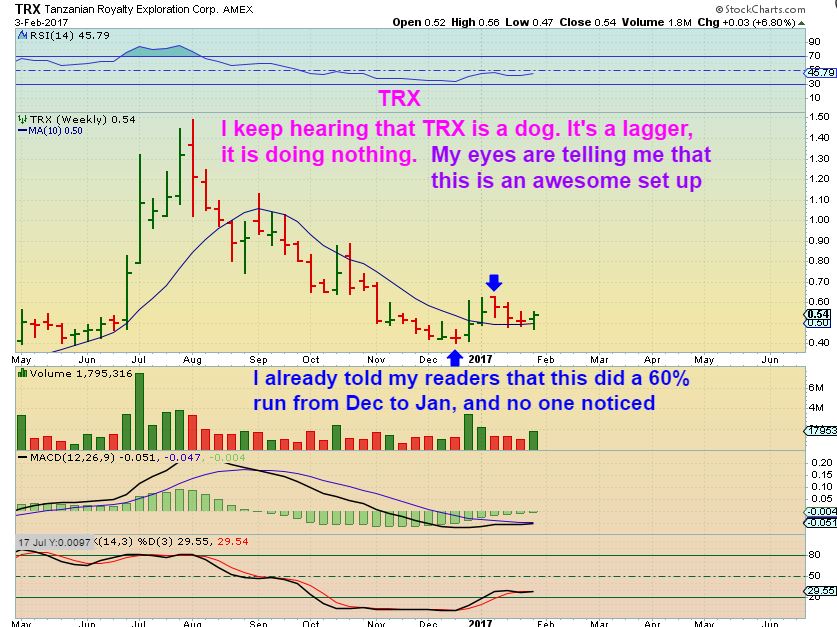
TRX since the DCL it is actually also up 20%. It was down at MID DAY when I checked it, and it closed up 8%. Yes, TRX was red at noon time, but this moved 10 % from Mid day Monday to the close.
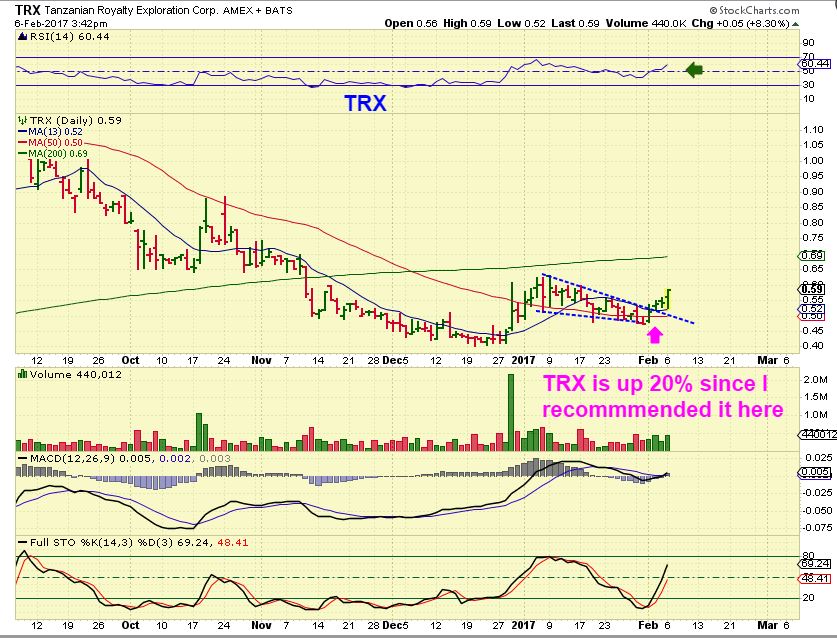
I posted this last week at 47 cents. It is up 20% from this point. The upside potential if this gets going is great. 100%? , 200%? More? Enough said, I’ll stop discussing TRX for now. 🙂
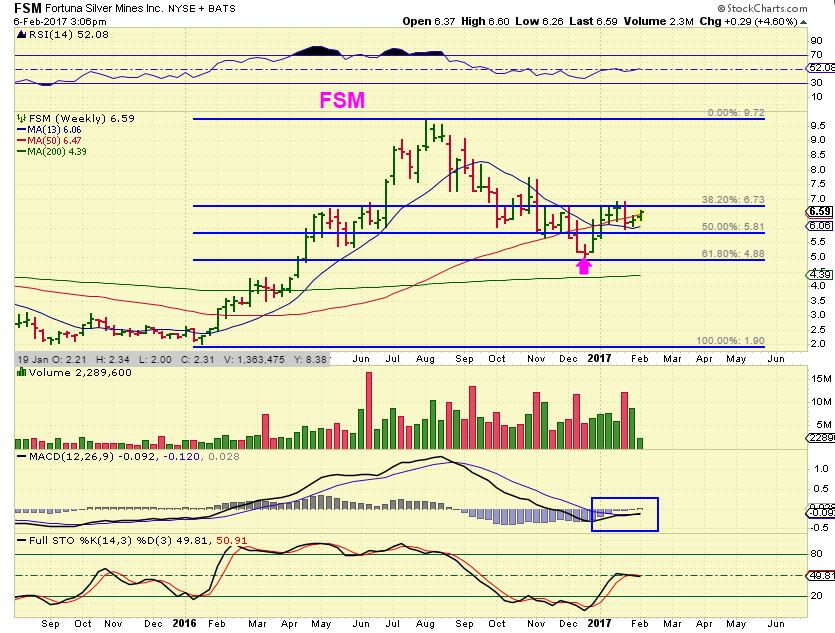
FSM WEEKLY – FSM did a perfect 61.8% pullback, and has moved almost 40% higher from Dec lows. I think that this one has plenty of upside.
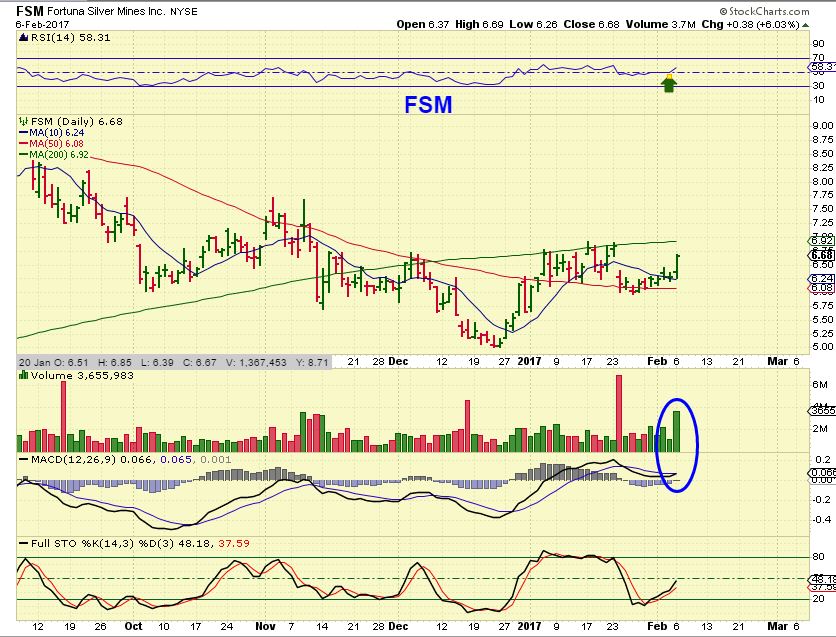
FSM DAILY – Just getting moving here? This is a low risk buy with a stop below the 50sma ( red line) and it looks ready to break above the 200sma ( green line).
So there you have it. We had a nice upside surprise Monday in Precious Metals with the USD green too. By not over trading this sector out of the Dec lows, we are maximizing our gains, since the pull backs have been shallow to minimal. At this point, anyone that is starting to worry about losing the recent gains that have added up can use a mental stop or trailing stop. Maybe on BIG positions, use a trailing stop on partial position would help? It is up to you as a trader, but I do think that these break outs could lead to higher price in the coming week or so. Some are reaching out for their 2016 highs! I am not trying to trade in and out of these, but if I have a very extended position, I might sell a partial or all of it and try one that has not followed through yet. Let’s take a look at that…
**Lets say for example I owned :
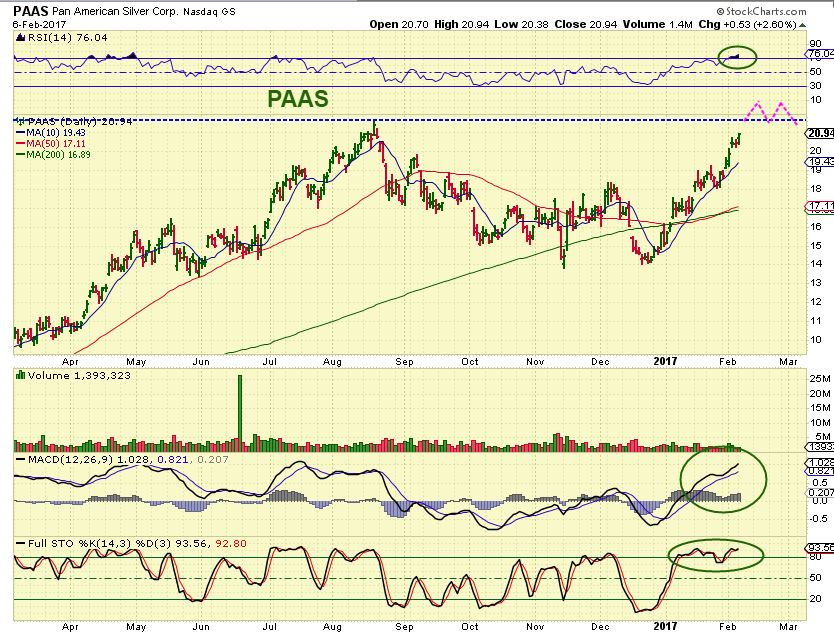
PAAS – PAAS is still running higher, but what if it is extended and is only tacking on 2 % each day now? It also may be nearing a peak? I might sell 1/2 my position…
And try it in 2 juniors ( Like PPP and TRX for example). I’d do this just because the chance of increased % gains is in this set up. There are no guarantees, PPP could fail to follow through, but this is a strategy that I often use as a trader once a stock runs higher for a weeks.
So now we’ll have to see what Tuesday brings our way. I hope that it is 1/2 as good as Monday was with a little more follow through, but if it is not, the set ups remain bullish. I am not going to worry about it until I see signs of weakness. Some of these POPS from yesterday could just bull flag. Thanks for being here and enjoy your Tuesday!
.


Thanks Alex, lots of good stuff to consider!
Thanks Zig!
Lot’s of good stuff to consider, because we had some good follow up action Monday. I kind of wish I didn’t miss the afternoon excitement, but I guess that is how it is for those not working in front of a screen all day ( I used to be full time in sales – it can be tough to trade that way without a solid game plan!).
Have a good one 🙂
Awesome reports, Alex. You have been all over this move better than any others I read, again.
Thanks Ralph – It is a lot of work, but it sure pays off when you can get it right 🙂
I am thinking you got this sector right …AGAIN! [I joined you last Feb. and enjoyed that run up with you being right,…thanks again]. This is the fun part. Just remember to remind us when “the end is near” please. I noted in the report above that you say: ” this run should have several weeks of upside from the Dec lows.”…We have already moved forward about 7 weeks….that is more than “several” already. That is a little confusing. Timing and cycle-wise, do you have an approximate target?
Thx Nancy –
I keep us posted in the daily reports, we are on day 6 for Gold in the 2nd daily cycle. We could peak in the 3rd daily cycle
Please remind me how many days in the gold cycle? I remember your charts saying cycles had been longer than expected sometimes recently. Have to go to work..no time to hunt for the data now.
20 -30 ish
Thanks
So adding a little JNUG on this pull back would be a smart move, correct? Since we’re only on day 6…?
If you are in front of a screen and can manage your own trades, I do expect higher prices. Use stops and be careful. I try not to recommend 3x etfs ( Tough I do use them) , because they are not for everyone.
we dont talk about fightclub….
lol 1st rule
😀
I’m so glad I didn’t miss it this year!!!
You got really nervous there for awhile….now have fun!
I know, right? November was not a fun trading time for me. I was, uh, early. Like 2 damn months early. In a better place now, all around. 🙂
This morning we see a little pull back as the USD rises – it could offer a nice chance to stop and look at yesterdays action as possible bull flags form ( or however this plays out) . It may also just be a gap down and close back up into the close. It should just be wiggles until we continue higher.
Agree. I went ahead and put my final 7% on the 3 P’s.this AM. All buckled in now Alex, and ready for the ride . Thanks agsin.
RIDE ‘EM CRAWDADDY! : )
Any thoughts on uranium stocks, seems they have pulled back to levels where they might be interesting again? URRE and UEC are two that I am referring to.
Or maybe you already have too much on your plate with miners…
I’m loaded on Miners , but it might be a place to go when the miners finish their move higher in the 2nd daily cycle. 🙂
CLF earnings tomorrow,stock looks ready to go.
CNBX….from yesterday’s report of commercializing their diagnostic testing for cancer patients…popped today…up 20% so far….
Alex,
oil seems to heading lower – what kind of 3x bear etf could one play on a decline of oil stocks ?
thanx
ray
DWT is oil / I cant remember the opposite of GUSH off hand. I’m not ta my desk right now
Good morning Alex…… probably not a good question, but…. is the chart of Nat.Gas changed? I mean, looks it not that bad?
Alex…. thanks for your response.
Buying it.
Sorry Geurt – I havent looked deeply into the big picture /cycle count, etc. Kind of looks neutral to me.
I just focused on Miners for the best % gains and have been focused on trades there. Others may be able to help you.
I understand it Alex….. but still I owe some UGAZ (300)
Like some input from this panel.
THANKS MAN !!!
IF I owned UGAZ here, I wouldn’t be selling unless the right side gap closes.
Bill….thanks for your consideration.
Really….. very appreciated BILL…….
DRIP is a good one, 3x oil & gas e&p
THX TAMMIE & LTL – I knew others would help out while I was away 🙂
ERY
THANX 4 the info
GSS came to play hardball today! running nicely
PLG continuing to surf that upper BB, too. Nice to see.
yea, all miners red on the start and I walk away to make breakfast come back and laughed at the screens.. Green all over. Im hoping THM can break thru the 200 today, we have a triple top right now
Good catch. If you add a 10 to that chart, you can see it’s just getting squeezed up there. I think next pop will go to .78-.79
AUMN and VGZ trying to stretch their legs!
Buying natural gas…gap fill has occured.
Yeah, I was looking for an ending wave with a slightly lower low, this might have been it. A lot of bearish news is baked in at this point and $3 is pretty solid support.
Some of these lower lows in $Nat gas sometimes occur in after hours.
Man, look at JNUG still running, crazy. With the $$ exploding upward overnight, to open looked to be tough but it battled back immediately. In hindsight that was an “add” point and not a sell. I still held 1/2 though. I needed to peel back exposure just a bit so it’s all good.
GSS and PLG having a great day – thanks CF
Yes. I’ve been holding PLG for awhile. Nice to see it take off.
Me too H50, was getting bored, but just like VGZ – it just takes time and patience and then out of nowhere – Boom! 🙂
CDE? do you like this here ALEX?
Actually, the best part about it is that it hasnt really taken off, so you wouldnt be buying an extended one. I dont know why it hasn’t , because it is pretty popular, but I would consider it pretty much low risk if you put a stop under the 200sma.
NAK back above the 10sma, hopefully it can close here. In a very “this is how it looks to me”, non-scientific analysis summary: since NAKs run started in October, the consolidation periods before giraffe necking have been the following number of trading days: 11, 11, 3, 11, 11, 3. For this period, we’re now on day 10. It would be cool if tomorrow was relatively flat, then POP on Thursday. But maybe I’m the only one still in NAK?
Nope, I’m in…waiting….for that giraffe….:)
I’m on too. Reduced it by 25% but still in the rest.
Well…so much for my safari I was hoping for….
Technically I see nothing that has changed, also all in waiting for the next pop… or a hard break of 20 sma
Yes, I own NAK
I’m in too. Took some profits twice, but still have a nice pile. Like Tammie, I am waiting for a giraffe…but will be keeping some as a core because I like their story too. I’ll tuck some away as a lotto ticket.
KLGDF, moved above last summer’s highs today…not many can say that just yet
Have a bunch of that one. One of my favorites
True – But look at TKRFF ( NO, I didnt buy that break out, yes I kind of kicked myself later).
wow what happnd to AKG… dang
rating cut…to hold…from speculative buy…
of course….buck as many of as poss b4 the big kahuna….
Bummer on a day like today, you want to have as many of the winners as possible, but at least the rest of the basket would cushion the blow.
#COLDCOMFORT
Yea..not in it..fyi..just noticed it down
Taking a bite on some phyto-bites here with EDXC.
They announced 145% annual revenue growth back in January, also preparing to uplist…hoping there is good future in this stock…:)
CK,what do you think about DCIX?..support at 2.6. Its at 2.8 now
Possible Island Reversal on Nat Gas Today.
Yes
That’s a while ago Bill, (in Dutch is het Willem) I wrote you.
You wrote: Nat.Gas is possible on a reversal. Is this to the upside or downside.
Do you have a charts with EW Bill? If not, it’s fine my dear.
Thanks a lot.
Check the link below for a chart. If we continue higher here and do not fill the gaps, then we will put in an “Island Reversal” and should move higher.
https://www.tradingview.com/x/SqDRayIB/
THANK-you sooo much BILL !!!
Prost!
Geurt, on 6 days ago, I posted a possible double bottom and reversal should follow, but the prices went lower and the double bottom was negated.
We need to see GOLD break thru 1235 to get the BULL train moving again. If not, I expect 1227 as a pullback.
I just got back in front of the screen here – I dont know if it was mentioned earlier below , I havent skimmed comments, but see attached chart from last weeks report.
THIS IS A SOLID BUY – ( I loaded up back when I posted this).
.
https://uploads.disquscdn.com/images/b99026dbafd0a4db3d815247560351fa5d7987844d1d28012395ef80243dcccf.jpg
Weekly chart looks super bullish, too: MACD crossing up and PSAR about to flip. Sulu? Yes, Captain? Warp factor 7.
I was going to put the weekly chart in the weekend report, but I didnt at that time.
Yes – it looks very good. I bought a small boat load when I posted the above chart.- BORT!
Did it already launch since you posted that? I just now read it…..but looks to have already moved since then? Still a buy?
The weekly chart makes this a buy in a bigger picture way. I added.
AUMN has a personality- it moves more than JNUG when it gets going
Yes, I also bought some a while back. When I look at a weekly chart that goes back to Jan2016 I can really see the potential on this stock.
Thanks for all you do!
They did an at the market offering in Dec to raise money, so maybe that is out of the way. Their earnings are due out any day now, but so far this looks quite bullish and I do love that weekly chart – check it out on a 5 year 🙂
and ur welcome, thanks for being here!
Hey Alex,
Just noticed today that my 1-year performance in my high-risk account is 250%, almost exclusively from tips you’ve put out here. (That account is now back to break-even since inception, lol.) I really appreciate all that you do, thank you so much, I hope you live forever.
I got back to break even late last year after being down 60% (slow bleed from 2012-2015). It’s a relief. “I’m gonna be OK, I’m gonna make it!” Lol!
No- Ur gonna be a winner – BORT!
In the news: “Chartfreak to launch new life coaching site.” Lol! Thanks for the guidance, CF! *bort!*
JT – That makes me very happy to hear that feedback, so happy to help and those are great gains. Now lets add another 225% 🙂
https://uploads.disquscdn.com/images/a6f8fe6ac796c09a51f038abb3537ebde9a452e7c02af395778b55c0950e5bdf.jpg
It is preparing to lauch 🙂
I am fully invested, and do not own any, but I am very curious to see if price takes off to the upside. Everything looks good, now let’s see if it delivers.
Adding to FCX: 1/2 tranche…..
Currently in a Wave 2 correction.
Are you done adding to JO?
No. Planning on adding at the 62% Fib Ann.
Where do you have that? Is it around 20.25?
Yes around 20.21….You could also wait for a daily swing buy signal, might be safer.
She may Not get there Ann, might be a Daily Swing Buy tomorrow morning if she gaps up so…..
hi
i m waiting since there’s a gap between 20 and 19.64 – so big chance it will be closed before it turns
that’s when I think I will buy
Yep very possible ray…..that would be my last buy tranche. I would rather not see it drop that far though….. 😉
I really like the set-up on FCX; it might take a few more days but it appears probable to me that new highs are forthcoming
Yes agree pankef
I have a daily sell and working on a weekly sell.
You mean 2 of 3 , right? I was thinking that 2 bottomed in Early January
Yes…..correct .
What do you mean no change in oil? It’s dropping just like the COTs
indicate. Why no mention of the losers? ?? I’ve never lost so much
money until I took some of these recommendations. Metals are the only
thing he has right. (for now).
Sorry to hear thar you are losing money in Oil.
Take look at this OIL chart attached. This would have been in the report, and this is why I said ” No change”. It is going sideways for weeeeeeks. .
” Never lost so much money until you took Oil trades”. I cant imagine which ones you lost so much money in, with a proper stop. Money management is key , and it is your responsibility.
Again, sorry that you piled up losses, but my focus has been on Miners since Dec lows. Right?
If a trade goes against you, you get stopped out for a minimal loss.
.
https://uploads.disquscdn.com/images/8881afcbb2a84f78374eecc24b2313c9379489321753082b5ab78e2e8594c39f.jpg
BY THE WAY – In a recent report I mentioned that though OIL was holding up, XLE was leading the way lower, and that was a cautionary note. That was a warning that Oil stocks would be breaking down.
We’ve all had those trades with the dreaded stock offering or similar bad news that sends one stock lower while the sector moves higher. Could be bad news. Share the ticker with us. I prefer to use ETF’s to avoid that exposure.
True on that one Bill , the dreaded offering on GPL nailed me a while back. I think I got payback later when it formed a rounding bottom and took off. That is why I buy my own basket of stocks , all with lower risk set ups. ETFs are good, but often muted gains.
Some of the Energy also did a surprise BK at times. I avoided the penny Energy stocks after last springs run up. Also bought a basket to avoid company specific risk.
I have not touched the Oil sector in weeks……If I remember correctly I closed out my USO Calls in early Jan. ?
Really? Hmm…
Sorry for ur losses. We all press our own buy & sell buttons- Maybe try a more of a training wheel type service that announces daily buy & sells???
I am on a 32 day sunny vaca thanks to charfreaks amazing calls and guidance.
Peace out
M
I could use the training wheels? Its not a bad thing! #HB
To each his own… Thats just not what we signed up for here…..
Meow
In JRs defense, I do recall getting stopped out of a PACD trade that I took, made some quick gains in others before really getting very bullish on Precious Metals, but that is the point. I try to post low risk trades, like as it back tests the 50sma and you can add a stop below the 50sma. The stop keeps losses minimal. Once I get stopped out, I dont bother reviewing losing trades because I assume that we are stopped out, I spend my energy looking for the next best low risk trade. Let the winners run & work the trade ( Like we did with NAK) and cut the losses short – move on.
Those set ups in Miners quickly started piling up in Dec / Jan and that has been the focus, you have to make money in the sector that the Market says is a winner, you cant keep fighting the market if something goes wrong. Stops are a protection against our emotions at times. I dont go back and cover stocks that I got stopped out of, because they do not need attention or further management. . Stocks that are winners ( Lets say NAK) – I keep addressing that one because people needed another entry point, or where to take some profit , or where to raise a stop to. If it remains bullish, I keep reviewing it and its potential. Some trades drop, stop out, and never get good looking again.
So I tend to keep going back to the winning set ups because others may need an entry or an exit. The trades that dropped and stopped us out are just that, stopped out- move on to making gains in a bullish sector.
I meant it when I said sorry to hear about losses mounting up in Oil stocks, but that is managing a trade – I can’t do that for hundreds of readers each day.
If it were me – I’d cut my losses and divide the $$ into PPP, TRX, EXK, AUMN or something that hasn’t quite stretched out yet.
If Maria’s chart box doesn’t come with training wheels then I’m out!!
Really? Hmm. What stocks/ETFs are you taking losses on? Where are your stops? Just asking because that’s not the norm around here. My first trade of the year was a plus 105% winner. And the bunch I bought last week I’m up an average of 7% already. In a week.
JR, Not sure what you were saying so I reviewed CF recommendations for oil and came up with this Jan 27th, “WTIC – Oil is looking bullish and as mentioned in yesterdays report, the XLE and many Energy stocks were already looking bullishly set up.” That was the last really positive thing I heard because Jan 29th,”oil is trade-able.” Feb 1st, there was a cautionary note, “energy losing bullishness.” Feb 2nd, “not comfortable trading oil ” appeared and throughout in comments and in reports I remember Alex saying he was concentrating on the miners.
Sorry to hear. I can tell you the only other trader I know that caught this bottom in gold stocks was Larry Williams…..I put Alex right up there with him on catching bottoms and calling tops. Alex is going to be as good as you will find. In fact only Alex caught the bottom in gold stocks that I know of. I can also say he is just as correct on oil I just don’t trade it as much buy each time I have traded it ( etfs for me ) I have done well. We all have losses but the best traders know money management and that is more important than anything else.
correction-only Alex caught “the” bottom in gold stocks that I know of last year….that includes everyone I know as a trader.
I know of 2 (sub services) in their free part one rec in dec 2015 the other rec jan 25 2016
chartfreak is the only sub service I have.
Hey JR, I hear you. Honestly, CF replied below and his answer is pretty good. From a reader perspective, I had a tough time with energy when I started here. I didn’t manage my stops and my positions correctly. But I didn’t realize that at first. So, when Alex stops talking about something that is a sign. A HUGE sign. As he states below, he stops mentioning a trade b/c he assumes we all stopped out. I kept a couple of losers before. I have (finally) grown out of that. But I certainly understand. Once you open a position, feel free to post here for others to comment if it is not in the regular report and many of us may be able to respond. We have lots of helpful folks in this chat. So, oil looks ok but not good but some of the energy aren’t doing as well. I also took the PACD trade. And I might have been (in the past) too loose on the stop and take a big loss and then try to hold on to break even. This time I just stopped out.
Yes, sometimes we start going bullish sometimes and then reports stop mentioning a sector. That’s a sign to get out or ask a very specific question. This newsletter doesn’t send out exact alerts for entry/exit. But I’ve been in those and lost money and sometimes they run and hide when they throw out a lemon. Alex will confront it head-on. So, from a fellow reader that started low and has worked (at least one!) account back to all-time highs, GL and stay frosty!
Hoping that GDXJ does a bull flag here or a 1 day stall, rather than a back test of that break out.
Either way, the set up is bullish with a pause along the way.
If gold gets a 1/2 cycle low during this DC, it could be on its way to finding it now. Just a guess here though. A touch of the 10 and definitely 20sma is a good buying opportunity for a week or 10 days higher…and the moving averages then become your hard stop.
https://uploads.disquscdn.com/images/3cab36a41363d4ec2b621d8568650956975558028f88c8f79344abcc81ef1b0c.jpg
Thx Rob-
I was really hoping to see GOLD run right to the 200sma and then pause for a 1/2 cycle low, because that would mean even higher price, but we have to take what we get, so we’ll see how this one plays out : )
I like your thinking better! 🙂
Yeah, like a 1/2 way point, right? : )
yep, me too…..but if we go back down to 200 sma…..I’m on it Coach……
Exactly. A backtest and I re-back up the same truck…
I just saw this a few minutes ago. What do you think, Alex? Legit? https://uploads.disquscdn.com/images/20159a2ca98b7760fa9b6e20483e0a7709c0bb5757af7a564d01043b6aa38082.jpg
In this example, The projection could be correct, say using an A-B-C type of move. In a future 1-2-3-4-5, the move of 3 could even be greater. So I would say that the price projection can be used.
As for the cup & handle – I do see people use cup & handles at lows, but my experience is that they are FAR less reliable at a bottom ( Where there is weakness) than after a nice run up & cup consolidation ( Strength).
I never use a cup & handle personally at lows, because they are weaker and can fail and then you get the T/A critics saying that T/A doesnt work anymore, etc. It works very consistently on a run higher. though. 🙂
Nice. I appreciate the T.A. tip.
Thanks for explaining
Is an inverse head and shoulders any better at a major bottom, or do you treat it as you would a cup and handle? TIA
Yes, very much better. The inverse H&S at a bottom is often very nice for a low 🙂 It’s like they couldn’t sell it off , though they tried a few times , and the Head can be a shake out, the right shoulder a wave 2 correction.
If your DCL was in late Jan. that would be the bottom of the wave 2 correction which would mean Metals are in a wave i of 3 but……..I am still not sure the late Jan.low was an DCL it could it be a HCL imo……although I AM playing it as a DCL but……………
Do you think the ICL/YCL was the end of a Primary wave 2 or intermediate 2?
TLT (Bonds):
No change, Stop below 118.07.
I just got a weekly buy on TLT.
Cool !!
I like the set up a lot, but I’d only play it in TMF like ( I think it was ) Ray.
Wave 3 coming up Ken 🙂
That will work ……
I have moved most of my cash in TLT vs. in my brokers sweep account earning basically nothing…… 🙂
Alex, what do you think on CNBX chart? I want to get more…looks like it wants to keep going..but…my head is telling me it ran up today so probably shouldn’t….another part of me is saying…it’s going to keep going….what are your thoughts?
Did you see MNTR today? Breakout on rising volume.
Yeah, I was just looking at that! I added that to my watch list when you mentioned it yesterday 🙂 Looks like it might want to keep going…was up so much yesterday so I figured watch it today…just kept going….on long term chart it looks like it wants to keep going past the November high……maybe…?
And inverse H&S possible. I saw that on another one and it rocketed higher.
I think it was CBIS
Is there anything cup and handle looking about the CBIS chart now? Like…the 3 year chart? haha, can it be that long of a time frame? Short term it looks to me like maybe once it clears this .13 area resistance it will take off higher….?
CBIS looks like it will do what it did in November. A small double top. It may not drop down as far and consolidate, but it looks a bit weaker on this rise so far.
It is too early to say at this point, but it has similar features so far,
Thanks! 🙂
Yes it could keep running, but it also can drop. That said, It is not low risk entry at this point.
Steel is doing very well today…….
yeah, that wasn’t an a-b-c correction in URA like I was picturing.
I see the 1-2-3-4-5, correction was rather straight down. This pop may be ‘b’, but it does look kind of good for bounce.
I am waiting patiently for this one. I don’t think I am willing to play b up though unless you are seeing something I am not ? https://uploads.disquscdn.com/images/8b7d795081f19a6c97bea3704715b9a0371bb1846f923f7d7c2c30519af11d09.png
2 hour already getting oversold so maybe she rolls over into that c wave ….
Ken or anyone..im at the pool w this guy from S.Dakota big farmer.. Wheat is his main crop…. Can someone share a wheat chart? I thot i remember that in wave 3 now??
Tx
I have been watching Wheat closely: https://uploads.disquscdn.com/images/61ecdfdf52f468c581643e4af88332bdadbd8697042b7750f469539251320dbd.jpg
Here you go, with BBs: [URL=http://s1374.photobucket.com/user/spikauf/media/Screen%20Shot%202017-02-07%20at%201.17.03%20PM_zps22vumxuq.png.html][IMG]http://i1374.photobucket.com/albums/ag410/spikauf/Screen%20Shot%202017-02-07%20at%201.17.03%20PM_zps22vumxuq.png[/IMG][/URL]
thank u … 🙂
TRX is funny. It sells off during the day and closes back up at the close. I like that.
Up 9% in two days like that.
Yes, And now it is again 50% off of the Dec lows, but no one seems to notice it.
I think it is about to make a great move ( Gut feel)’
Wish I hadn’t gotten in that one so early so I could be enjoying it a bit more. But was glad that I was able to hold off the lows and not emotionally take the realized loss.
Invoice is in the mail …… 😉
🙂
Atleast have the Farmer send me a loaf of fresh wheat bread ! lol jk
Yea..as soon as i get my jo…. 🙂
LOL !!!!!
Sorry just crying on ya alls shoulders but: ROOT CANALS ARE THE FRIKIN WORST !!!!!! 🙁
Oooooo ouch…they are ….
I had one in a front tooth years ago and I thought that they were drilling into my eye socket.
Did you just have one or are you going for one?.
I am Hoping one will take care of the ISSUE !
Probobly should Not have been trading this afternoon…. lol
I seriously needed 7 shots of novacaine….. Uggh
I had 4….lol
And Those even hurt like hek…. lol
Indeed. But compared to an abscessed tooth/jaw, not too bad (so I’ve been told). I ask for a little versed prior to dental work like this. No reason you should “remember” how bad it is:)
Sorry for your pain. I think I need one. Have a tooth that hurts sometimes. I Have been stalling. Now you make me want to stall more.
It’s worth it Nancy.
Could get worse….
AUMN is running AH ….
Just got home…what a disappointment…gold up , my account down. Poo.
Yes, but the give back was nothing compared to what I (and hopefully you too!) made yesterday. What was so dissapointing late last year was giving all of the moves back. Right now, we continue to make progress. Whoo!
API oil inventory +14.2M. Holy crap, absolutely swimming in oil. As expected as Saudi and friends cut, US shale ramps up to meet “demand”. Baker-Hughes rig count continues to scream higher each week.
interesting times: https://www.kimblechartingsolutions.com/2017/02/crude-oil-crowded-bullish-trade-history-play/?utm_source=ActiveCampaign&utm_medium=email&utm_content=Crude+Oil%3B+Most+crowded+bullish+trade+in+history+in+play&utm_campaign=Daily+Kimble+Blog+Posts+RSS
https://uploads.disquscdn.com/images/317b644945cb70bf60c4b963ece7504b45c33ced7442a959b60068e8ab9b4a56.png
Positive divergence at the lows?!
Wow ….ETST…..don’t know anything about this one, hasn’t been on my list…..up 52% today
Another marijuana stock I’m just now reading about ….SGMD…Sugarmade…..has packaging for cannabis products that evidently controls oxygen levels, etc. to help prevent bacteria growth, makes products last longer, etc. – packaging for all kinds of cannabis products…..was up 15% today – that’s about all I know on it so far….as always..due diligence….
Not sure if anyone will still be reading this so late, but Ira was on point today: https://youtu.be/k_QushPC6v4
Bort!
NEW REPORT RELEASED