
DEC 25 WEEKEND REPORT
We have one shortened week left in the trading year, and it could be a light volume week at that. Lets review what happened last week and see where we could be heading from here.
.
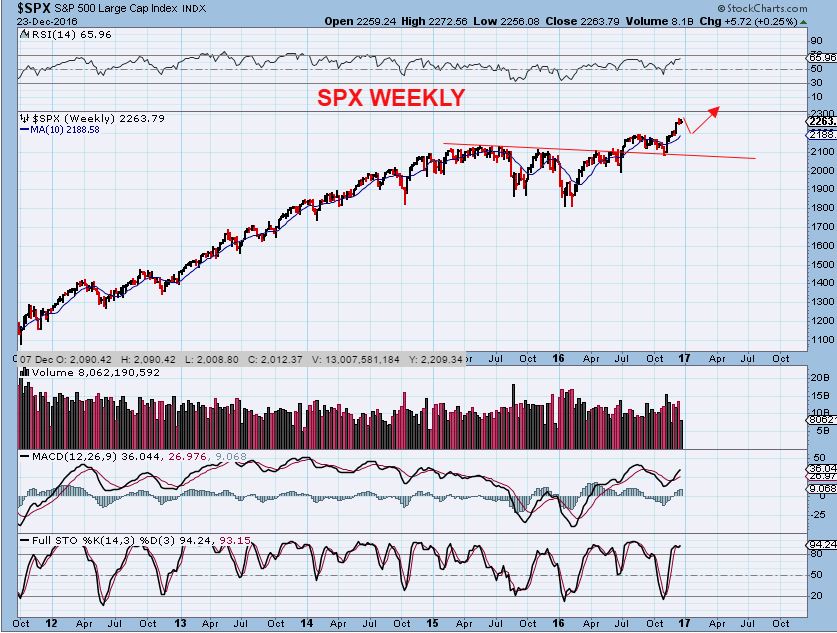
SPX – Though this looks like a bull flag, it also now looks ready to dip down into a dcl. The red line is the 50sma, near 2188, and would be a normal downside target. The Vix dropped very low last week, and a pull back is due.

SPX WKLY – The blue line is the 10ma on a weekly basis, at 2188. Again, a possible target for a normal healthy pull back.
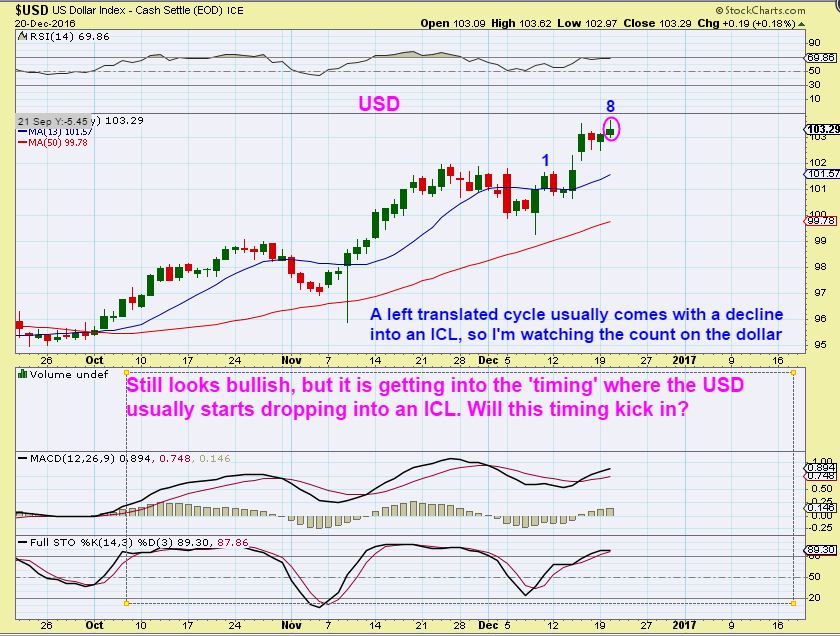
USD DEC 20th – Last Thursday I mentioned in Wednesdays chart that a day 8 peak would become a L.T. drop for the USD and could start the drop into a dcl. The USD is also within the timing to begin a drop into its ICL. This would help Gold ( And the YEN) in my opinion.
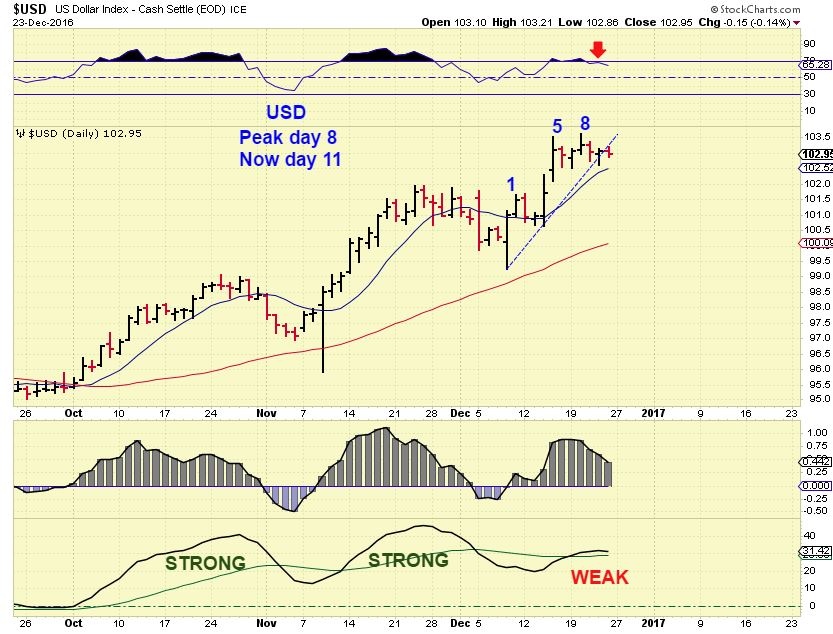
USD CURRENTLY – That day 8 high remains the peak so far. I am still expecting a dip now in the USD.
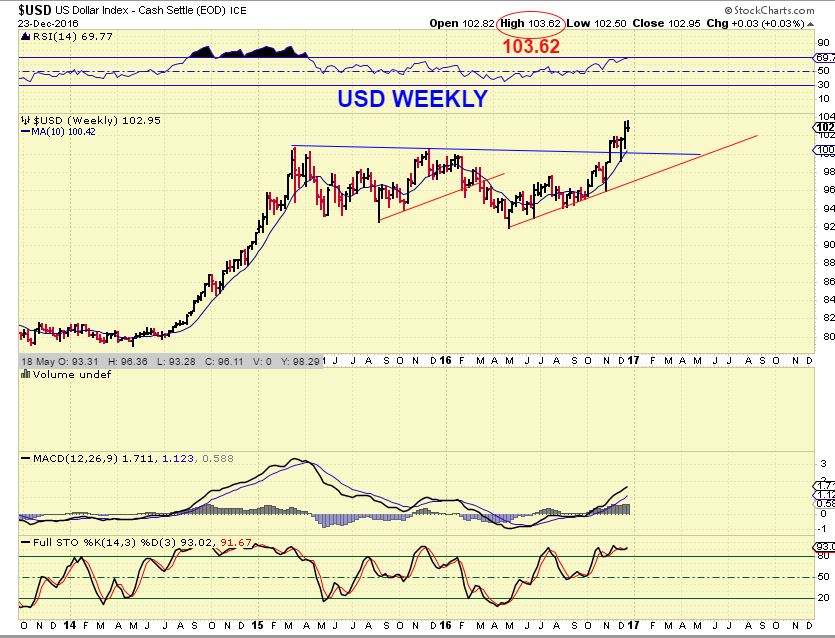
USD WEEKLY – In early Novmber when the Dollar broke out, I had 3 initial targets for the USD run higher. 103.28 was the stronger of the 3 targets.
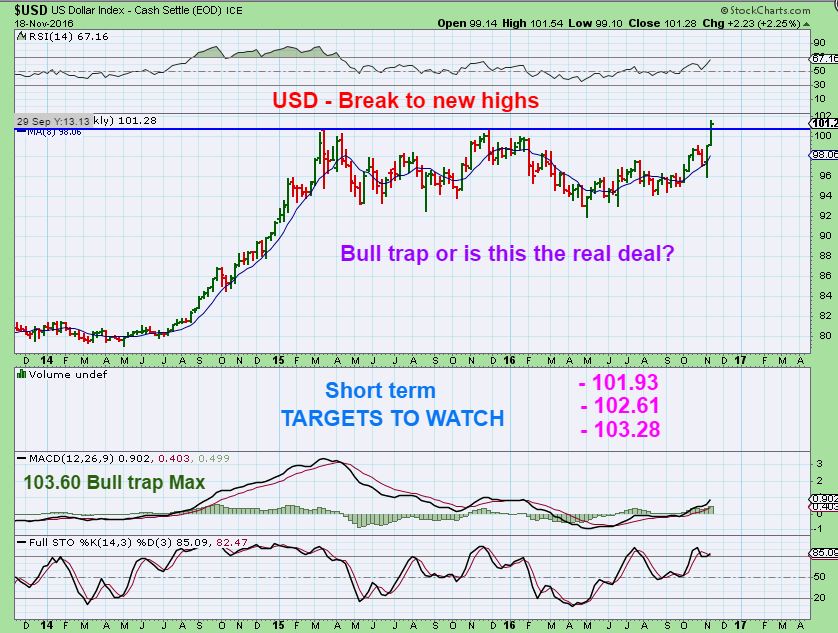
The peak hit 103.62 , closer to the stronger of the 3 targets that I gave, if this is fact the peak.
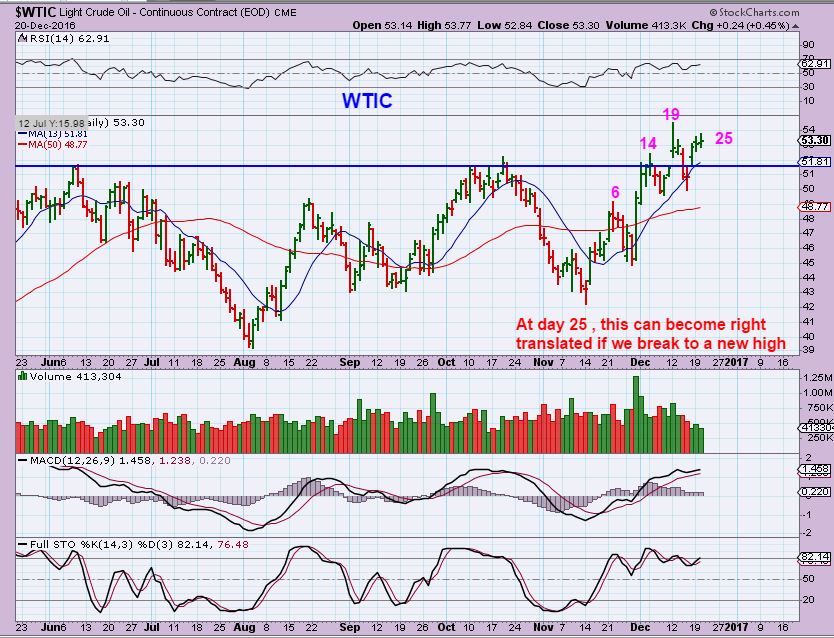
$WTIC – Last Wednesday we had a day 19 peak while we were on day 25. A new peak would help to give us a guaranteed R.T. daily cycle.
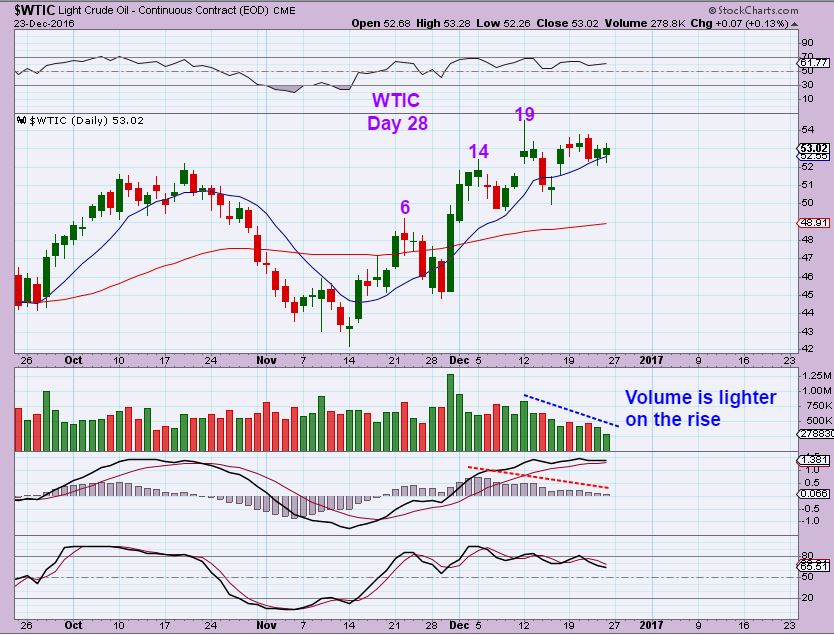
WTIC CURRENTLY – 3 days later and price still holds the 10 sma, but we do not have a new peak. Oil looks to be weakening here and may be forming a wedge too. Oils daily cycles can be anywhere from 30 to 50 days long, which is WAY too loose to be reliably predictive using cycles alone, so I try to use other tech analyses to guide us. Since the daily Oil looks to be weakening slightly, it may pull back a bit before another move higher, or just dip into a dcl. Lets check the weekly chart.
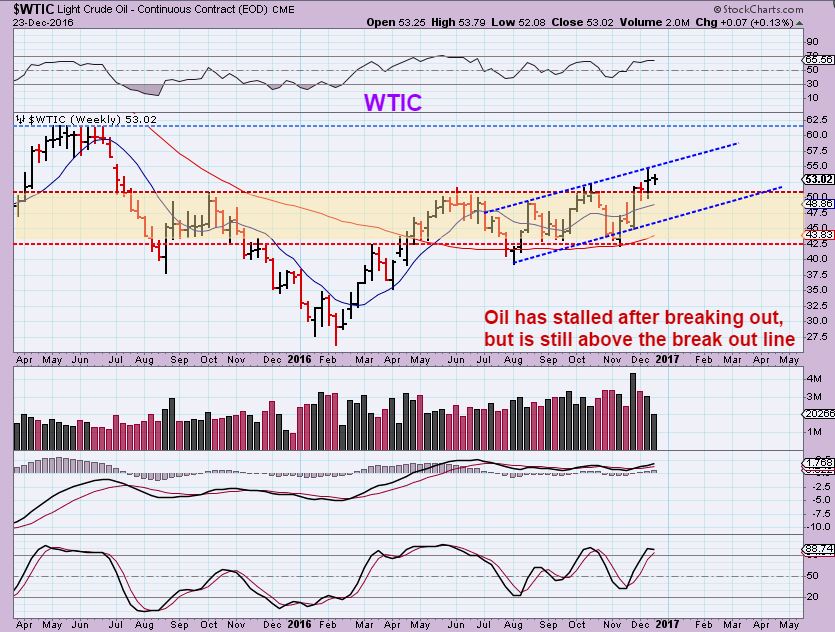
WTIC WEEKLY – Still holding above the break out, Oil could go sideways or even dip into a dcl , so I’m using this blue channel as sort of a guide if it does dip down. I would expect oil to run to the upper level shown near $60 eventually.
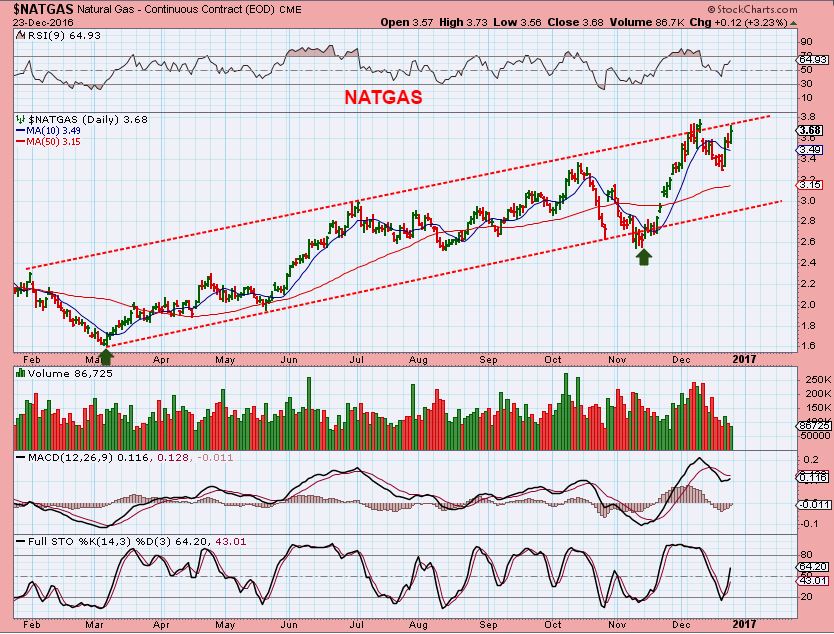
NATGAS – NATGAS has been acting correctly since putting an ICL in during November. NATGAS could break above this channel and do more of a vertical climb, but it doesn’t look strong enough to do that at this point. Maybe after the new year starts?
.
GOLD, SILVER, MINERS
.
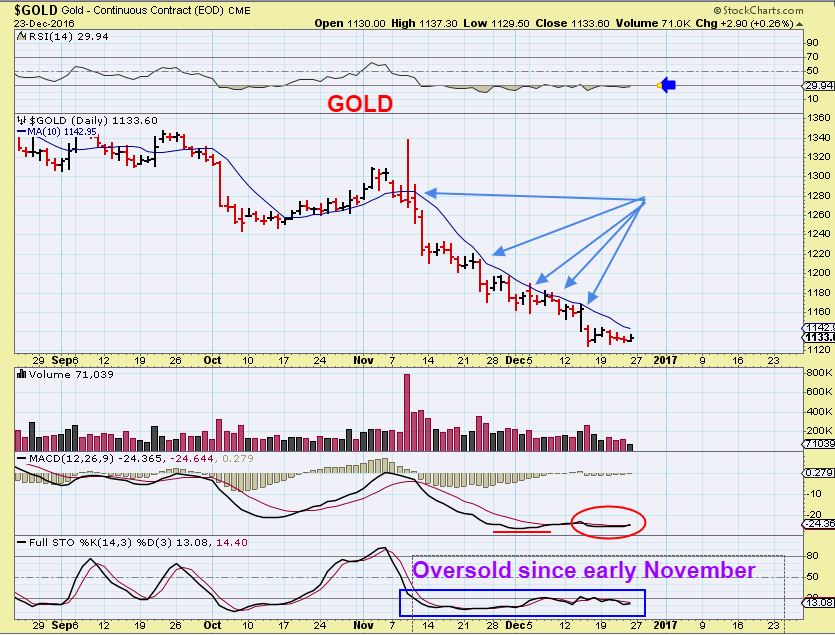
GOLD – Can you believe it? No break above the 10sma yet, but I do think that this is about to change. I would say that since Gold is this oversold, a close over the 10sma would be a buy signal for Miners.
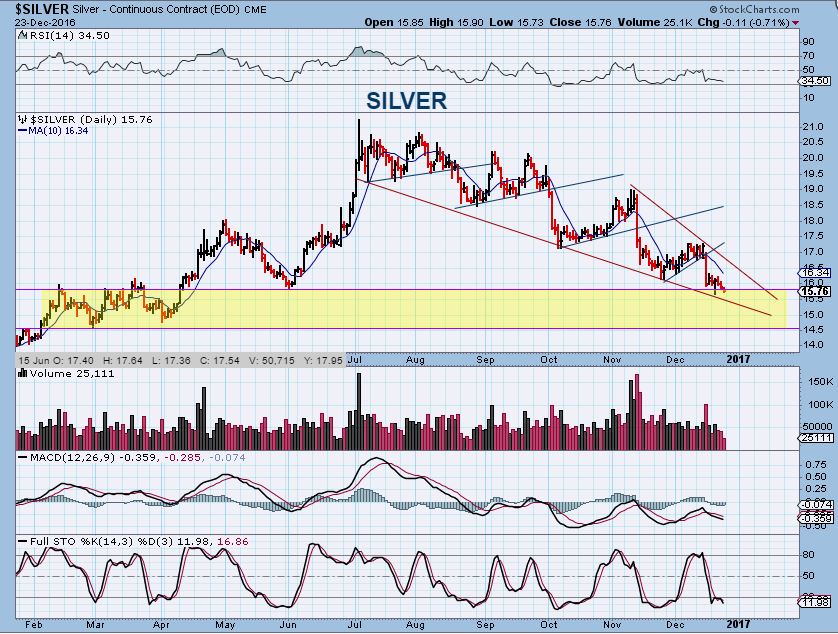
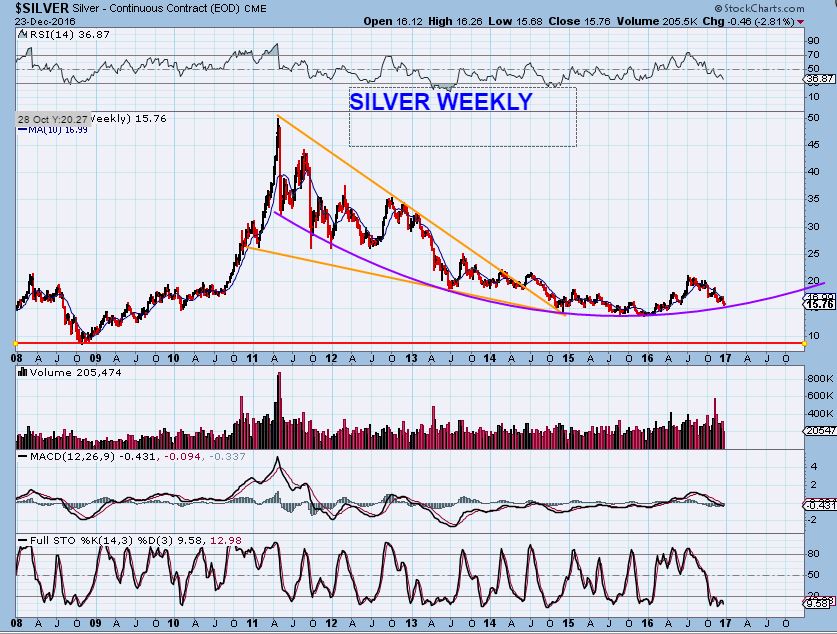
SILVER – Silver appears to be in a support area. Notice that after each sharp drop / break down from the daily cycle bounce, it has made it’s way higher again, so ‘higher’ should be the next move.
SILVER WEEKLY – I noticed that over the past several years, Silver moved higher in January & February. Silver is also now quite oversold on a weekly basis.
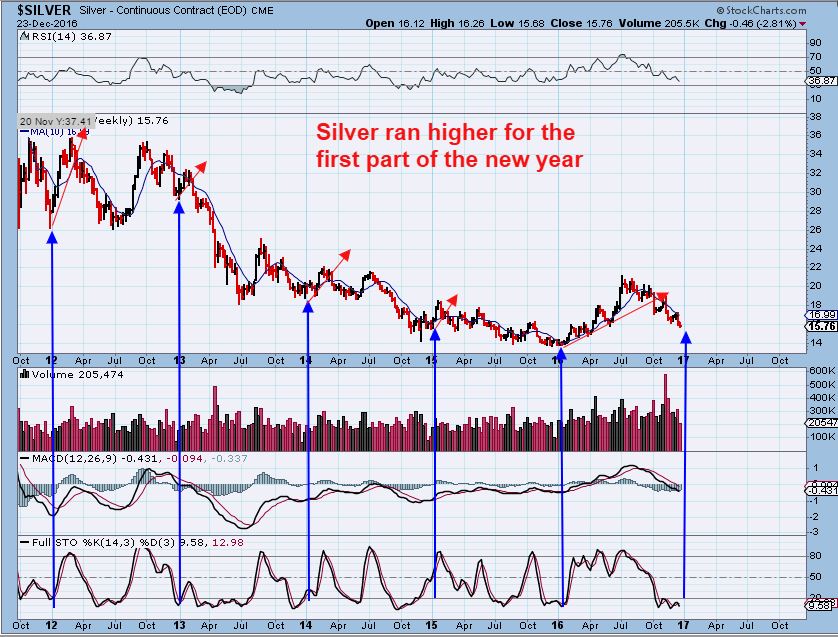
SILVER WEEKLY – This could be a huge rounding bottom, with the recent sell off included.
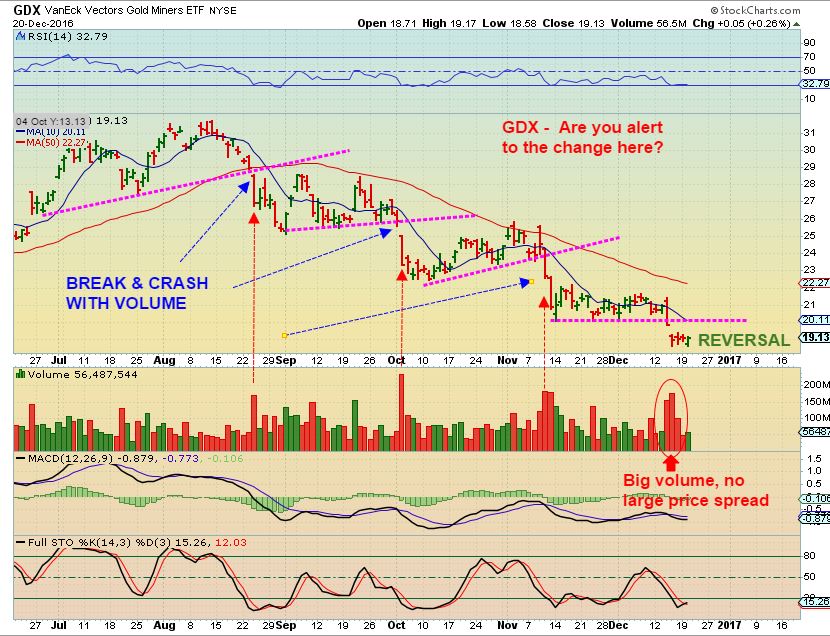
GDX EARLIER IN THE WEEK – I pointed out this change in character Wednesday. Heavy volume drops that break the trend line had follow though. Now we see heavy volume & no follow through. That is likely accumulation at the lows.
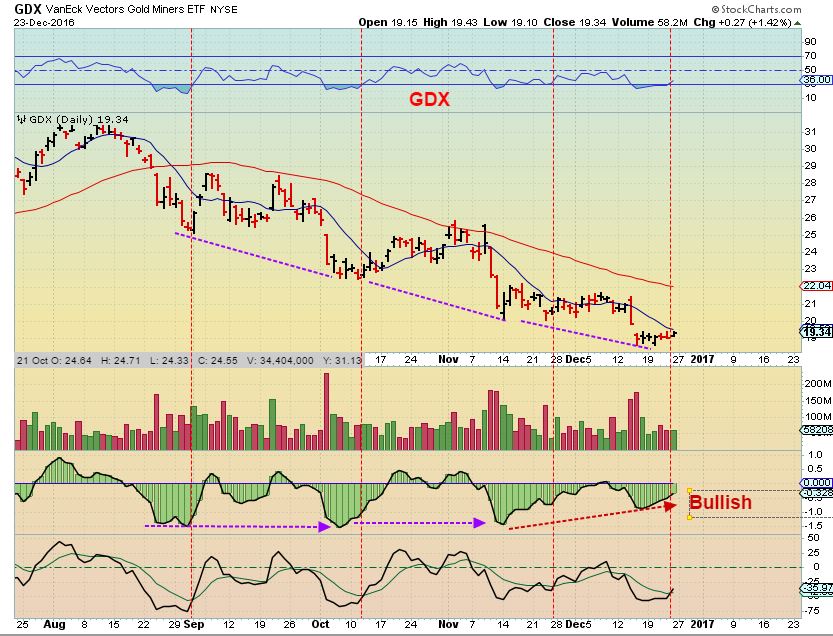
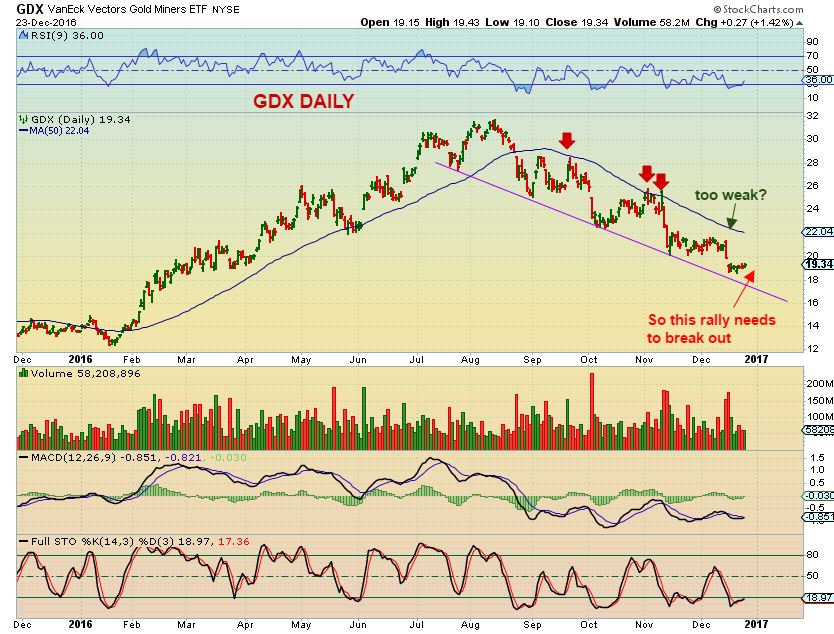
GDX – The GDX DAILY looks bullish here. We have been looking for a possible ISLAND REVERSAL with a bullish gap open. If Gold starts trading higher while the U.S.markets are closed Monday into Tuesday, GDX could give us that gap open on Tuesday, back over the 10sma. The 50sma has held the GDX down since August. The next Daily Cycle alone may not break it out above the 50sma, but if an ICL is in place, we should be able to get back above it and start a bullish move higher.
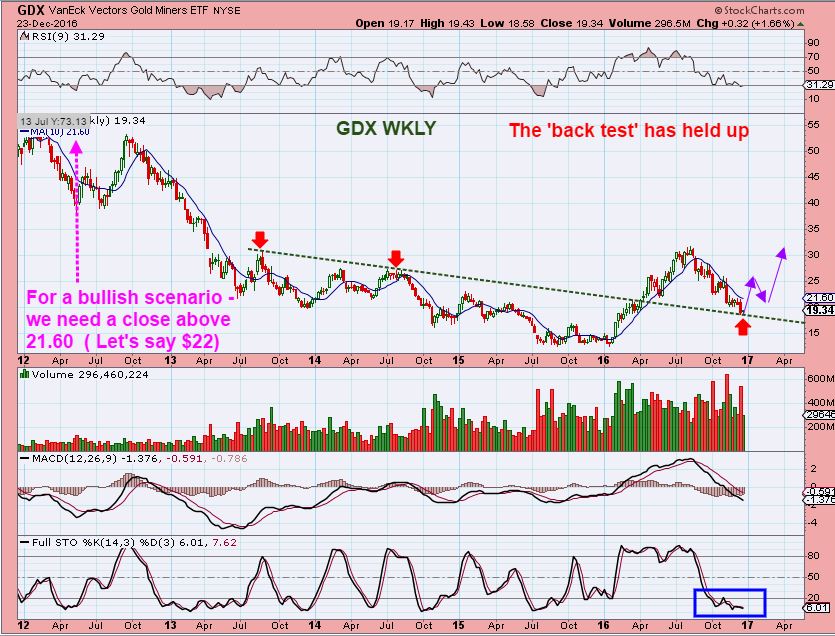
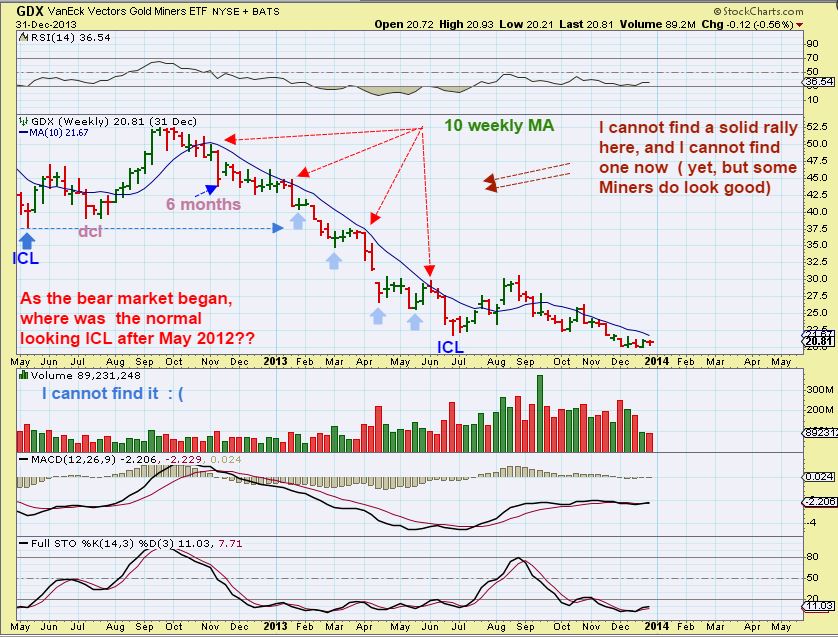
GDX WEEKLY – Since we are expecting an ICL in Gold & Miners, we should be able to rally strongly for at least 2 daily cycles ( 2 months). This is how I envision a bullish scenario playing out after a normal bullish back test, if this was a normal bullish back test.
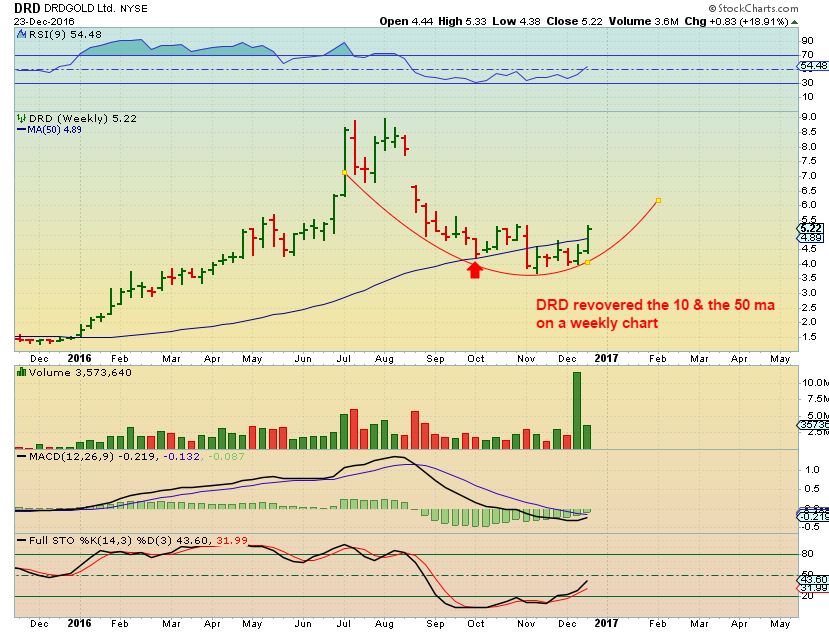
All last week, I have been pointing out that GPL and DRD have been showing signs of strength, possible leaders of the coming move higher. How did they close the week?
GPL WEEKLY – Very bullish looking, GPL closed at the weeks highs. As I have repeatedly mentioned, it has not broken the OCT lows where I bought it, and it has now even closed at 5 month highs this week. Bullish.

DRD WEEKLY – Volume is increasing and almost closed at the weekly highs too. Recovering the 10 & 50 sma is a bullish set up.
At this point in time, you can see that I am expecting a move higher in the precious metals sector. After seeing a possible back test in Gold & Miners, why did I use a theme picture showing both good & bad?
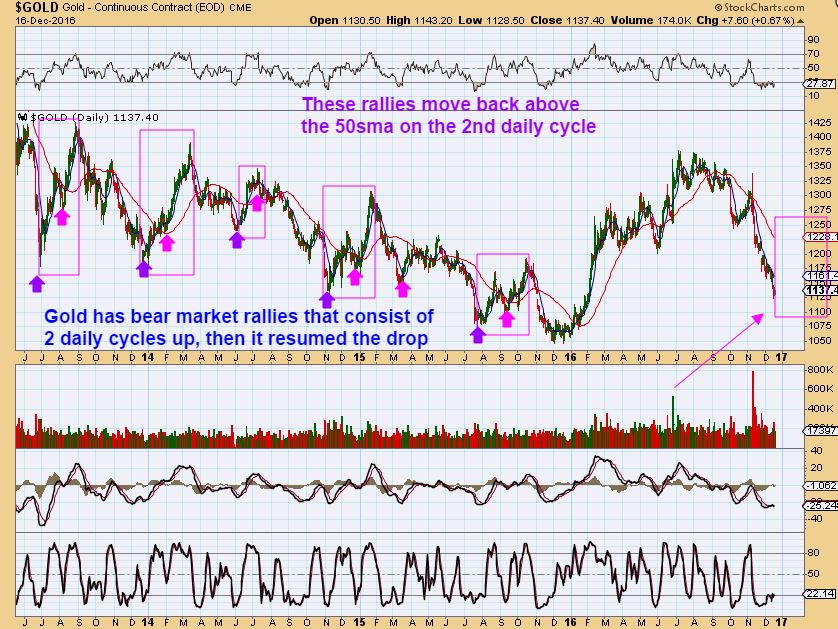
The Good : If you have been with Chartfreak for a while, then you know that I have been saying that with an ICL in Gold, I would expect 2 strong daily cycles for the miners out of the lows. Even in a bear market, we can have 2 strong convincing bullish looking rallies higher. I have pointed that out with this chart of Golds bear market rallies. They move higher for weeks…
We cannot be afraid to trade it, since the gains can be very big in the next several weeks, even in a bear market rally. Also, it may be the next leg up in our Bull Market.
THE POSSIBLE BAD: I have also said that when this rally takes place, WE WILL HAVE TO MONITOR IT GOING FORWARD.
I have wanted to show certain possible concerns that I have had found based on my research, but I also wanted to wait for the next leg up to start first. I didn’t want to scare people out of what could be a good trade in precious metals soon. The bad news would be that there is the possible bear market side, if this rally eventually does roll over. Did Gold & Silver re-enter a bear market with the election of Trump in the U.S. and Indias recent developments? Could this just be a bear market rally approaching? I hesitated to discuss this early on, because it may cause some to become too cautious and miss the first part of the next rally higher that I am expecting. I will discuss this more as we move forward, but for now I will just share a couple of ideas of how this could play out, after signing off here. I will put a few extra charts at the end of this report. Enjoy your time off and we’ll see you all again Tuesday morning.
.
~ALEX
.
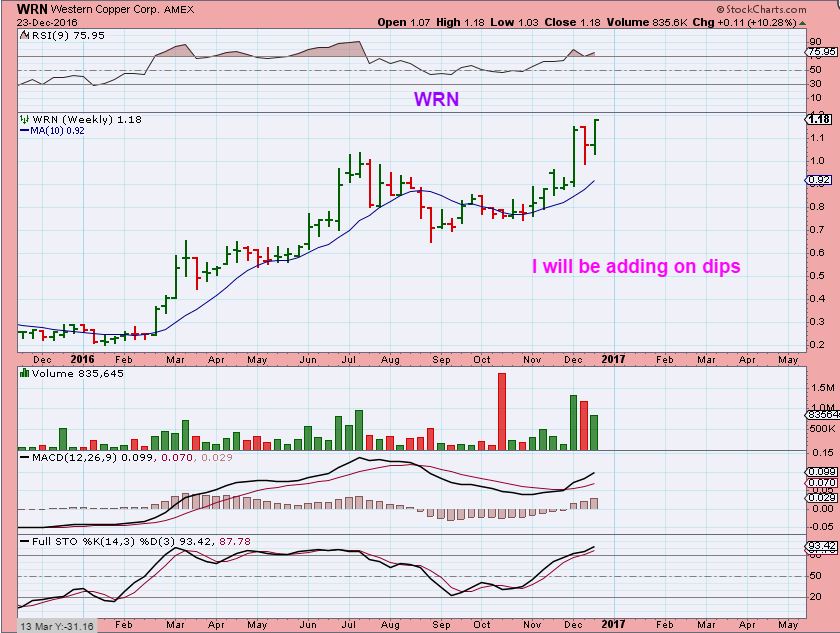
SIDENOTE : WRN WKLY – I have also been recommending the bullish set up in WRN again when it was around $1.00 2 weeks ago. It closed at the highs Friday, and remains bullish. The daily chart does look as though it could pull back a little next week, I will be dding on the dips.
When the ‘Metals’ stocks took off higher, we wanted to be ready to enter on a pullback if they remained bullish.
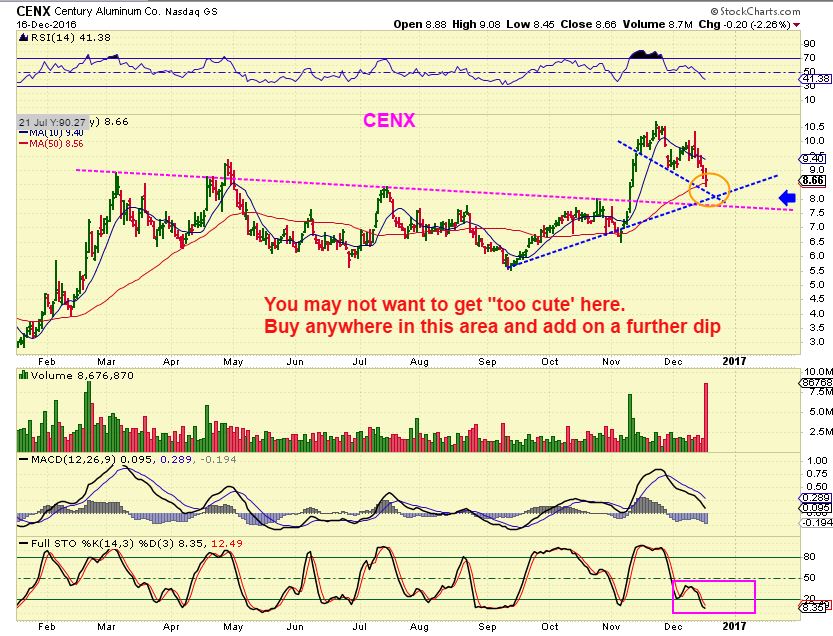
CENX WEEKLY – I’ve been watching some of the metals stocks for their pull back and low risk entery points. On Dec 16th we viewed it this way. 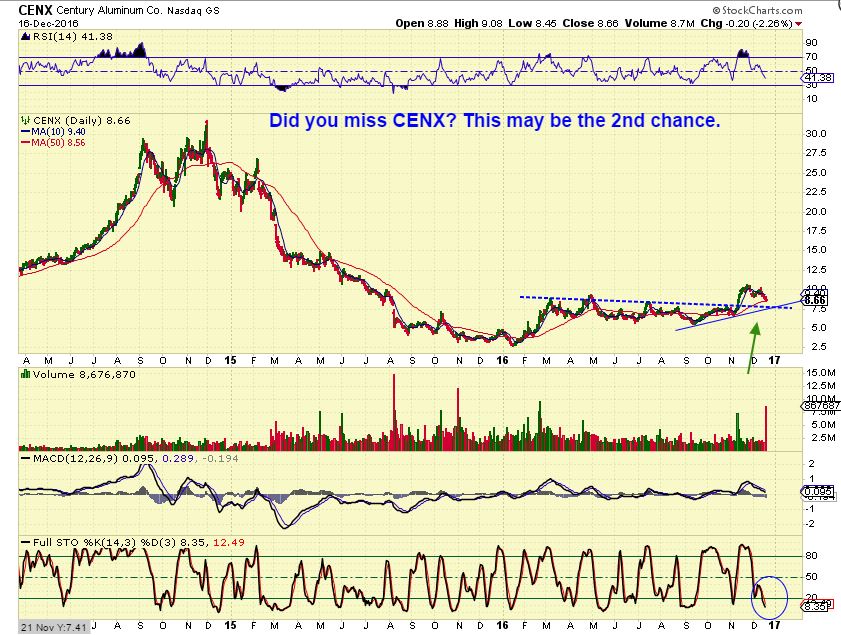
CENX – Possible place to start a position and add on any further dip.
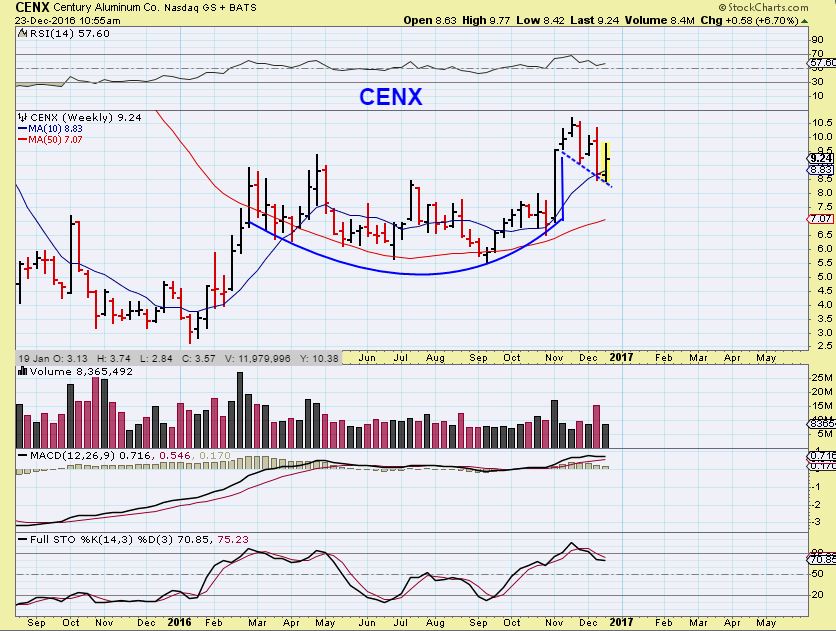
CENX WKLY – CENX popped nicely this week. The weekly chart shows a bullish cup & handle and gives us longer term upside potential.
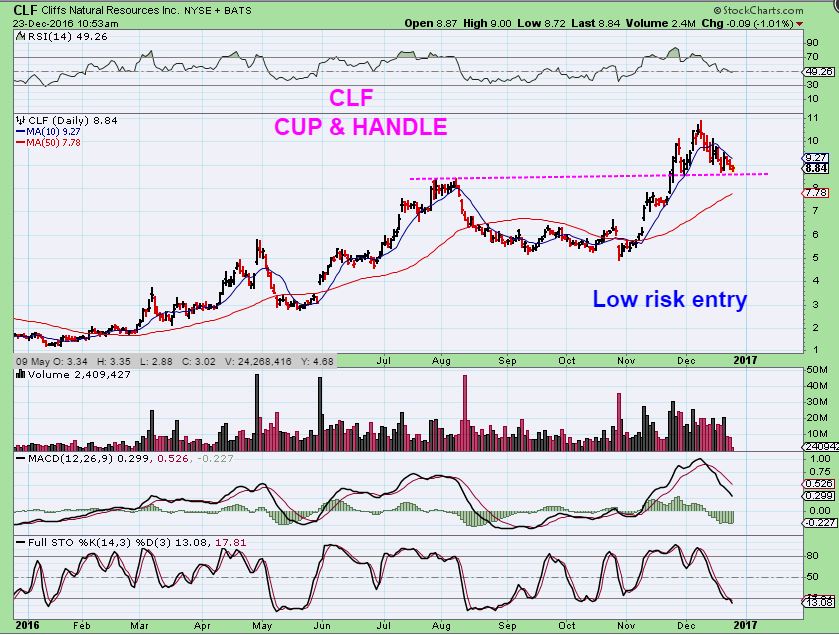
CLF – CLF has now pulled back to the break out too. This is why we don’t chase them when they are running ( unless we just want to scalp a day trade). This is now a lower risk area to start a positions, add on further controlled dips ( to the 50sma?) or even if we see a bullish run higher in the coming weeks. This may not drop further.
And finally I mentioned the possibility of the next rally rolling over. This is one example of what I would be looking for. Gold, Silver, and Miners broke down from the recent uptrend. We would want to become more alert as the expected rally approaches an area of possibly ‘back testing’ the recent break down.
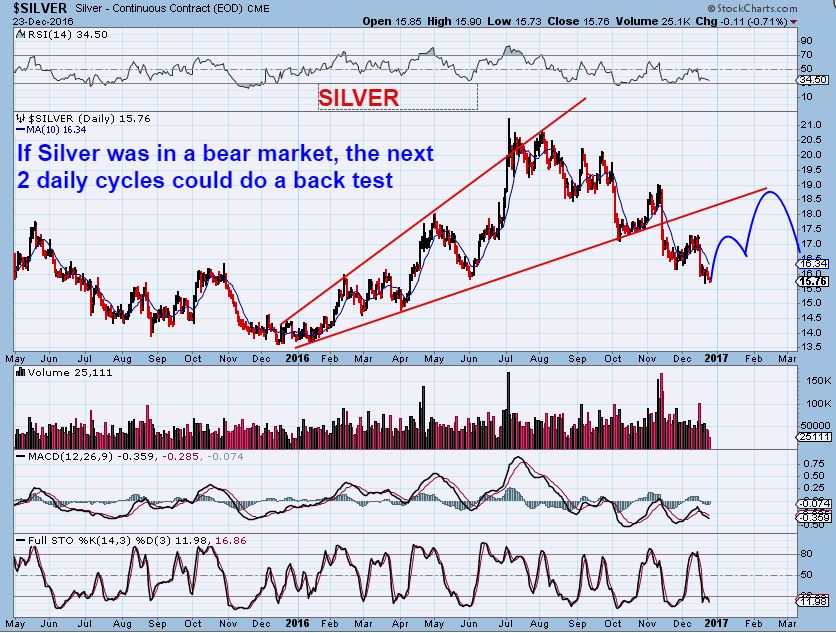
This is an even more bearish idea, and it would signal very early on that the bear market has returned.
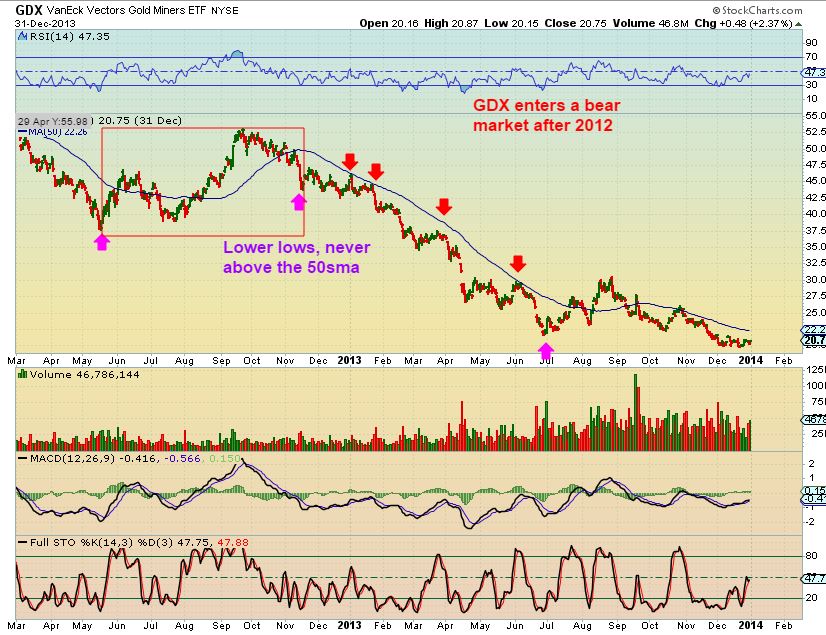
Notice that when the 2012 Precious Metals market turned from Bullish to bearish, GDX acted bearishly around the 10ma on a weekly basis. From the May ICL and 6 months forward, it looks like a stealth ICL was put in place. It honestly barely shows up. FROM THAT POINT ONWARD, THE GDX WEEKLY CHART did not regain the 10 ma. Please read the daily chart below.
GDX DAILY – Notice how Bullish the rally looked from the MAY ICL into the fall of 2012 ( red box). The it gradually rolled over and the 50sma became resistance. Each daily cycle low & following rally ended near the 50sma and some could not even reach the 50sma ( Red arrows) for 6 more months.
We have seen that start to occur now, so we need to see this change going forward. THIS IS MY LINE IN THE SAND. I will be monitoring this and several other areas as the expected move higher unfolds. Success or Failure in this 50 sma area should be known fairly quickly.
There are other things that I am monitoring , and they will be in future reports, but for now I am expecting a rally and GPL and DRD look like they are leading the way. Please read this report again ( and maybe again). I believe that all of the questions that you may have for now are answered in this report.


Thanks Alex. Merry Christmas and Happy Holidays to you and your family.
Thank u cf….:-D
Merry Christmas all.. Here’s to a great week…. https://uploads.disquscdn.com/images/4bd49095e684b53bfdd44f6e11b941b6e3f3fd52f6267bfe0bd617293a32ab4c.png
I’m feeling a little more ambitious than that Maria!! 😉 Forget ‘a great week’…I’m hoping for a great 2017!!! LOL Hope you’ve had a lovely Christmas and wishing you and everyone here and not least Alex himself an awesome New Year whatever it throws at us and most of all a happy and healthy one. 🙂
😀
Just back form a ‘quick lunchtime’ drink that lasted until 6.30 pm!! Don’t think I’ll be doing any trading this evening!! 😉
Hope you all had a wonderful Christmas, Hanukkah, or any other holiday you celebrate….and will have a healthy, happy and prosperous [especially here with Alex] 2017!
Well, mostly thanks to the failure of PMs and metals to rally this fall, I was unable to meet my 2016 goals for my trading account. However, I do feel positive for 2017, certainly at least for the start. A solid 2 daily cycle rally here would put me in position to hit my goals quickly, though. Then we can re-assess whether we have a bear or bull moving forward and potentially change tactics if need be. Looking forward to a promising 2017!!
As to the line in the sand with GDX, axioms seem so obvious and can be stated so simply ( eg recovering the 10MA in the weekly charts and 50SMA on the daily chart) yet so bewildering at the time we are looking for answers. Your observations seems like such a self evident truth when stated and backed up by your data yet required that eureka moment of brilliance. Great job Alex.
Personally, I am not thrilled so far. I started all green, now 2/3 green. JNUG is +3.3%, should be 10% for me to get excited. Gold is dropping. I have enough money on the table and need something special to ante up more. Also, this is the first hour where I believe the big folks try to sucker little folks in. I don’t even see that.
Might have been that first hour open higher, partial gap fill, backtest, and go. Not uncommon, gotta see if we can power higher this afternoon. Took a nibble on AG at “Rock bottom sale prices” but agree, I can’t JNUG myself yet!
Assuming that we are all clear, I like your AG buy. I have several indicators that show a daily buy – of course, this is not the end of the day though. 🙂
as perfect a bounce off the W indicator uptrend line as one could wish for
https://uploads.disquscdn.com/images/b3eae9b4871f10aa8ebed94d3c85ae11523d23887884e0315cb2d9c7d6805c72.jpg
Please!!!
havta wait till friday to see if it holds 🙂
Hey, we have three great minds liking this. 🙂
Well, at least 2… 😛
I’ll bet you are liking your AG. Up 6+%. JNUG almost up 8%. Looks like it is a good day.
I am warming up to the situation. We passed the first hour successfully and my acct is up 2+% the most I have seen today. The island is holding on GDX. However, JNUG is still only up about 5%. I think 10% would be a lot better to say that we are really cooking.
Are you feeling better yet, Gary?
Thanks for asking. I posted the following earlier.
“Glmus Cason
an hour ago
I’ll bet you are liking your AG. Up 6+%. JNUG almost up 8%. Looks like it is a good day.”
I even felt so good I doubled my position in DRD. My acct is up 4%. The only negative is that a need a few more days like this to get even. I see where JNUG is up 10+%. A 20% JNUG would really help a lot. (I don’t play JNUG, but 10% and 20% days really get the blood flowing.) And today was kind of a grinder day, namely, the slicksters didn’t run the prices up in the first hour, then dump them.
hmmmm…..do we have the island bottom in GDX? Or is this a low volume trading week head fake. Yup like a deer in the headlight…”they” do it to me every time!
Yeah, pretty much the same question – we’re popping above the 10-day for GDX and GLD, we’re right at it for GDXJ and GC_F Futures/Spot. Is this buyable? In general, yes we were waiting for that 10-day. Do we try to find a pullback? Is that even necessary with a 2% move (is that really chasing)? I guess my point is every pop that I (or anyone) has bought for the last 3 months has been disastrous. So, I guess what I am asking for is confidence?!! 😛
Ya….to buy or not to buy?
Exactly!! I said I was gonna sit on my hands, but was also waiting on that 10-day!
Did you see that overnight price spike in gold futures at the London open? A bit over 1150. We could match that spike in open market today. That would put Gold definitively over the 10-day. Maybe that was SOG buying for 2017!?!
LOL, yes, it must have been SOG! 🙂 Yes….saw that spike…..I wasn’t going to do much this week until all holidays were over…but….? Maybe this will stick!?!
yup.. i got a bit of xmas money from my mum.. so i went shopping at the London Metal Exchange.
bought a few hundred tonnes
https://uploads.disquscdn.com/images/1d236ab11d3c7a9b15c4c09a78ef7dbb3c2d472cd8cd6fce209e110ca884bddd.png
have you got one juggling gold bars?
Get a few more before NY closes!
Took a shot at UNG Waves over the weekend. This is a 1-hr chart and is UNG, not $NATGAS continuous futures. Pretty obvious to me that we just started Wave 3, not so sure yet on my subdivisions of that, but took an initial shot at it.
https://uploads.disquscdn.com/images/b0a4cbe12061be6baa940d4563121f64b0fefc8cb9e341ad9aa0f427e5e11d69.png
Nice chart, thanks. Gary.
Thanks, Gary. I’ll try to throw some Fibs on there later and see I can find some targets that way.
Go NAK go!
That is the one biggie I forgot to mention!!!!! Thanks to Nancy and NAK!
Hey, so you guys were supposed to tell me to ADD before it took off! Before! 🙂
I did, NAK & WRN after they formed cups again…. in every report- lol.
Right, that was my initial entry but didn’t add more. 🙁
I got fancy (Maria’s term) and sold the pop over a couple weeks ago. Then rebought lower when you pointed out in report. Sometimes I just need to get smacked in the back of the head. Like “hey, you, buy. Now. Don’t be stupid”
But I do have some NAK!
Yes, Nak has been ( So far) one of the perfectly performing charts. It runs strong, then consolidates, runs strong, consolidates. Very nice move so far ( WRN too actually).
There was a nice interview of CEO Scott Theissen (NAK) on RealVision. Huge huge copper deposit which is what I am assuming is moving the price rather than $GC.
Go WRN go!
Alex…thanks for WRN! Makes up for some of my miner disasters. Seriously thinking of moving out of PMs where I’m always hoping for a surge higher but in reality gripping tight just waiting for the bottom to fall out. 🙁
Carson, we have been saying that for a month
One day…one day…the trend shall change…(but when!)
well look at updated GLD Weekly histogram…
https://uploads.disquscdn.com/images/466e046a4a4abc1473322f59c8efa87462170e1fec4ba9971dcdec13b28c6ff6.jpg
Most oversold since 2013? That’s just Nuts!! Let’s go!
did you not catch last weeks update?.. i mentioned its only been this far down here, for a grand total of 5 weeks duration, ever since the 2008 crash
so… soon Cas… soon
Yeah, you’re right. I did see that from you last week. Thanks. I just kinda looked at it and it really hit, ya know? Sometimes I read through comments too fast (thanks to stupid work).
To buy or not to buy…So I nibbled a bit more AG. Maybe CF joined me:)
I did also cde and nugt
Alex, any new thoughts on XBI? Big move last Fri, now struggling a bit at the 20-day. I felt uncomfortable that it filled that gap halfway and then moved up a bit, versus closing the entire gap (which if at support would have been an easy “buy”). I didn’t like most of the charts that you highlighted a week ago (remember, you didn’t either!) so would only probably trade an ETF in this sector right now.
I dont remember posting biotech charts last week. XBI looks fine, use the 200sma
On mobile, was too lazy at first to go look it up 😛
Was the 16 Dec report.
http://chartfreak.com/2016/12/dec-16-friday
Oh yeah, by request I posted charts of the ones that I was asked about. I didnt like them, and most have dropped since then, but XBI landed on the 200sma. Could be improving now.
Also had that sweet WRN chart when it was $1.04 at the end
I should have taken WRN. Oops. I’ve had CLF,X so already exposed to base metal sector, wasn’t ready to add at first. On watchlist now for any future entries!
First target hit …..ALREADY! From last weeks report.
.
Refresh. I am expecting higher after that high volume push today
.
https://uploads.disquscdn.com/images/63c23a4f378b570f059a0f02111b2272697dfed872b07ffba73b5d9c1c272555.jpg
Yes….Very Nice !!
wow.. only just checked up on its progress few mins ago.. up 36% now!!
is this heading for $2.00?
wow…………………………………………..
2nd target hit ( And a 3rd. WOW)
Really should of sold BCEI when I was up 50%.. now I’m down 50%. Not sure why I held. Apparently BCEI and MEMP are filing for bankruptcy.
Don’t mess around with these types of stocks if you can help it. I learned the hard way
I did as well. Glad I had my stops ready on BCEI. Didn’t want to take the loss then but if I hadn’t. Youch! I don’t mess with the smaller ones much anymore.
NAK. New story here. Pls read.
http://www.reuters.com/article/us-mining-alaska-trump-idUSKBN14A287
I think chances are better now that the mine will get developed.
There’s definitely more correlation with copper miners than gold miners on Nak’s chart. That’s good to know going forward. Thanks for the post
Thanks Aniket !
It’s funny, when this article came out last Wednesday, I remember NAK dropped, but it wasn’t released until 1/2 hr before the close , so maybe it doesn’t count as negative that way. At the time I thought that the last paragraph was taken as negative
🙂
Tough call without sitting in on the Corp. meetings ya know. 😉
I am personally using a trailing stop below the 50 ema……currently.
Ok, it’s that paint drying part of the trading day in holiday volume. Unless you’re watching NAK, of course. I’ll check back after the close.
NAK or WRN – not light volume at all
Some day for NAK :)) Really heavy volume.
4.5x avg daily volume for last 3 months!
GDX/J closing at the highs of the day! 🙂
WRN 10x avg daily volume. Whoah!!
Ken, Is your wave 2 on Jo still bottoming and if so did you add?
I did Not add my 2nd tranche “yet”……I am seeing 5 waves down so it is close to bottoming imo…….I am planning on adding at the next Daily swing buy signal for sure (that bottom will be the next stop) but I would not hesitate starting a position at theses levels. 2 hr. stochs very oversold currently so…..
Alex, any comments on IPI? Thought I had sold it all a while ago but still had a very small position (i.e. lunch money) in the account. Seems to be popping today a bit with good volume. Thinking target=$3.85.
I have maybe $3.05 conservative, but it is a nice bull flag
Thx muchly!
Do we have a target on NAK? I’m kinda heavy. Would like to reposition, or would you guys just recommend adding on a pullback
Chad, ( Kind of heavy into NAK, Trading life isn’t hurting that much today, huh?).
I have been very heavy since the summer, so I have been selling pops and buying drops as shown, but I only sell a partial amount.
see attached
https://uploads.disquscdn.com/images/996dd820ef6191f136c9261e8cd2c17a3333c638712446951ba120dc1b38793e.jpg
awesome
I have mine on the Canadian side ie. NDM.TO and the Canadian market’s still closed today so it may run again a bit more tomorrow. I’m thinking of taking a touch off the table tomorrow.
Yeah, so I’m gonna do that too. Looks awesome in hindsight, now I just have to be good enough to spot in real time like CF!
well that was fun…. 😉
Yeah, it was. I want more fun!
Sold half at 2.35. Saw it ran to 2.50, I’ll add back on a pullback. Thanks Alex!
Alex, thank you sooooo much for recommending NAK. You gave Brenda and myself a Christmas gift and never had to go shopping! Great call!
Closed well outside it’s daily BB. Last time it did that, it pulled back but then afterwards? New highs (today!). I only have a 1/2 position so I held knowing I have powder to add. If we pop like this anymore, I might sell all and re-enter. Try to get fancy like CF!
My DRD looks like it is in an hourly pullback. As Alex has shared with us, DRD is looking good. I will likely buy more when I get an hourly buy signal. From Dec 2015 to Feb 2016, it stayed above its 5dema for a double plus. Maybe we can have a repeat. Better yet, from Aug 2015 to July 2016 a six bagger could have been had.
i was just lookn at asm…. looks done… ?hmmmm
While it is up 11% today I’m still down 33%. Some of us have just kept vigil over the body. So I figure another three days and I’ll break even, Hugh?
its Christmas.. not Easter! 🙂
Point well taken, but hope springs eternal.
Edward and/or if anyone else took the Coffee trade last week:
If JO opens higher tommorow it will most likely give us a Daily Swing Buy Signal (unconfirmed), if so, I will be buying my 2nd tranche with a stop below todays lows (wave 2 bottom most likely). Risk Reward is Excellent imo.
Thanks. Might get into thus tomorrow. Good way to offset the cost of Latte’s.
That’s right. Let JO pay for your cup O’ Joe!
Appreciate it Ken. Thanks.
whatcha thinkn … CF ….
Uggg nak I sold it and tho I just calculated my avg near 1.75 and bought it 65c but watching it rip today hurt.. I will now hope for a pullback. Overall tho maybe we have a bottom bit we need a lot more confirmation assume Alex
That’s still a great trade. And way better than me selling CWEI for $30. I mean, THAT one hurt!
constructive move today on the miners. Will see how it plays out
I’m excited, today was good stuff. But Oct and Nov did get above the 10-day and then failed. So we definitely need some follow through. But this was constructive. Another push higher tomorrow will get above the lows of the prior pre-Fed base, which is the first step to invalidate that breakdown.
Wouldn’t it be cool if NAK did what CWEI did? Hey I can dream can’t I? Lol!!!
check this out https://uploads.disquscdn.com/images/f2582353e8f5f3869479a6e5954077c549a5787488db5b9598794153a3698f29.png
It could possibly repeat. Thanks.
Higher low on $BPGDM? Can we get a higher high now? What does this chart show us? That recent new lows in gold did NOT mean new lows in all miners. 🙂
https://uploads.disquscdn.com/images/f3b778c3878270971bfc448b1b4f211b299250e565721c72c73620465ff1bede.png
https://uploads.disquscdn.com/images/b4ca5eb77a0514118676d03a7eea47bc50e285b39c8ca8b83be900a8a4c4aa9b.png
GDXJ – 2 hour chart. Are the clues in the chart? What do we want to see? We want to see it get overbought and STAY overbought. Then you know a bull is back. We’re also looking for the post-Fed breakdown to get invalidated. Then we’ll work on the next gap higher.
NEW REPORT POSTED, The email alert hasn’t triggered yet