
Dec 16 – Friday
Friday review:
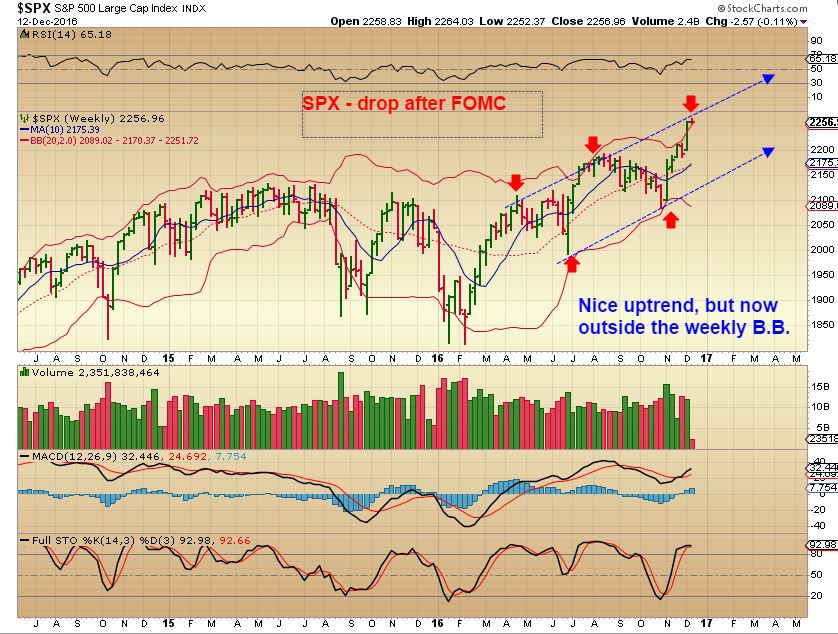
SPX WKLY DEC 12 – This looked like a temporary top forming.
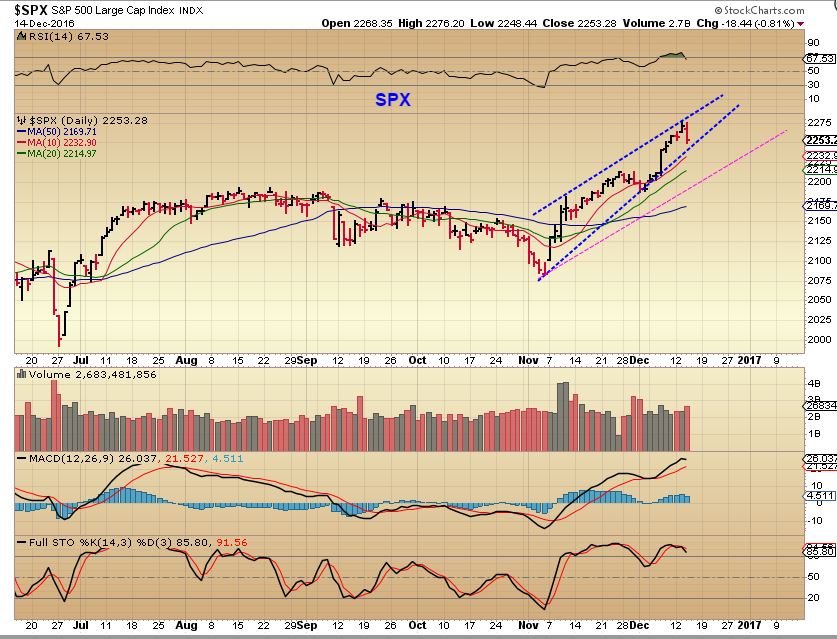
SPX Dec 14 – The markets started to drop a bit, but on the 15th they turned higher agin, so…
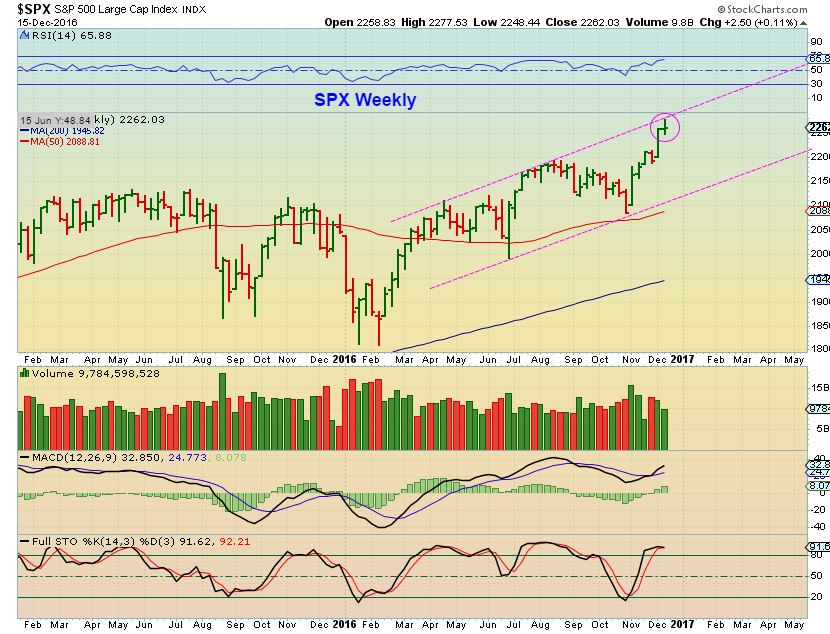
SPX – Back to the weekly chart and so far it still looks like a temporary top could be forming.
With the recent break out and after remaining strong, a pull back could be a place to look for buying opportunities.
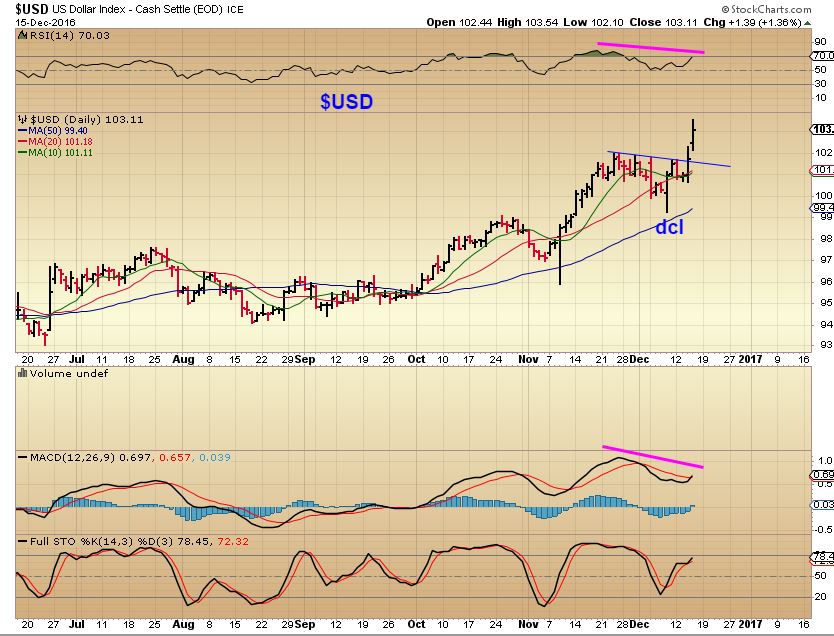
USD – The USD broke out higher and still looks strong. We see slight divergence forming. With this break out, the dollar gets a new measured move target of near $106, and $115 possible on the weekly chart, if the dollar forms as right translated. If it forms as L.T. – It could be preparing to drop into an ICL, the timing is right for that too.
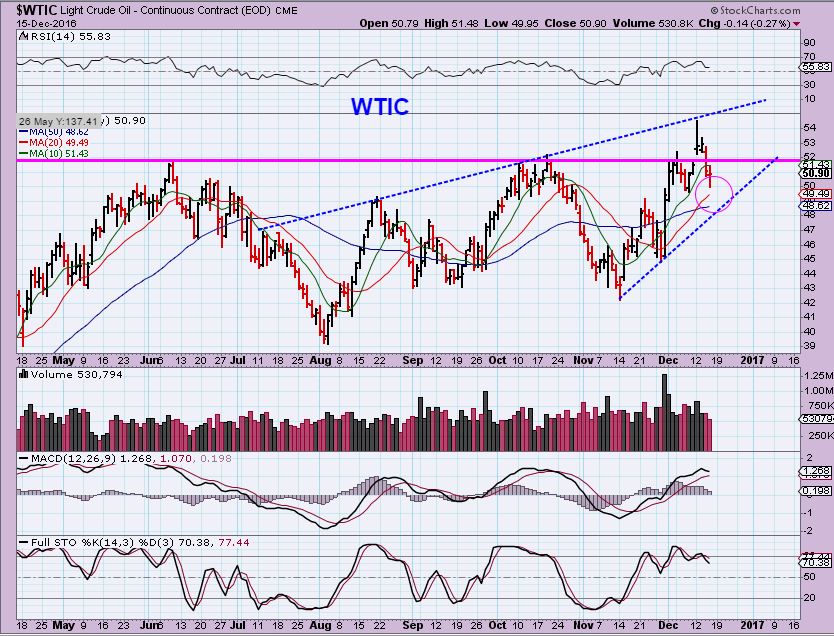
WTIC – Oil has been pulling back in an orderly manner, and many energy stocks ( And the XLE & OIH) have done the same. They remain bullish looking, lets take a look at a few of them.
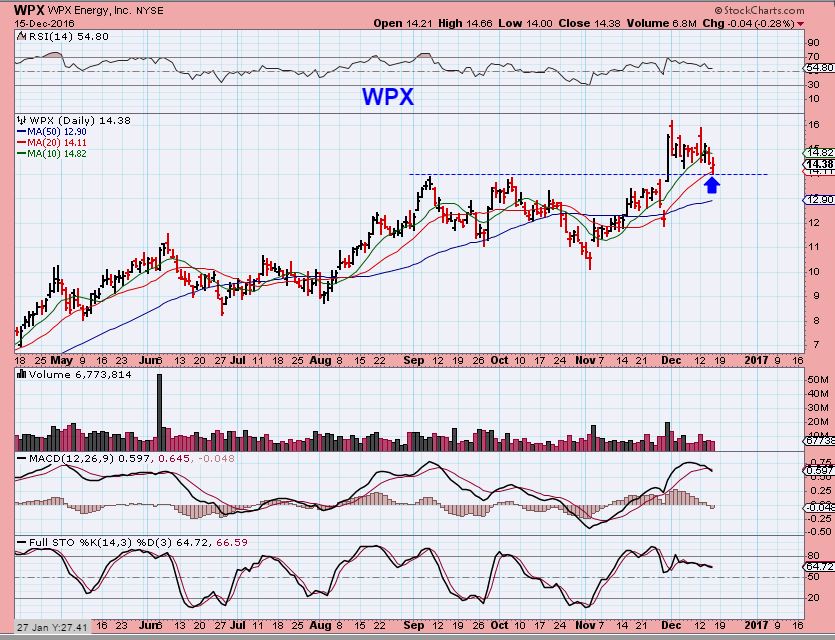
I have been discussing WPX for a while, because it is acting well in this consolidation. It broke out and has held up well, but this could also drop to the 50sma, based on the stochastics & MACD cross. It may just continue sideways, but this is in an uptrend and could be a good buying opportunity ( Now or soon, depending on your trading style).
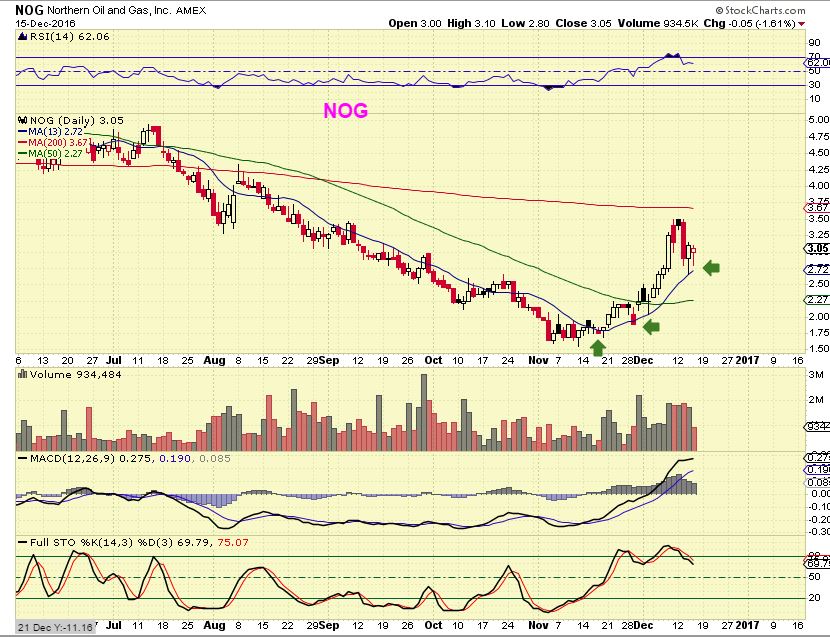
NOG – I sold my position in NOG a few days ago, but it is holding up nicely on the 13 sma. When I see a stochastics that is still overbought and OIL possibly consolidating, I would say that NOG could just bull flag here or even drop to the 50sma in an a-b-c type pull back. That means that it might not be ready to buy yet, unless one wanted to buy with a stop below the 50sma. I do like the set up and sector at this point.
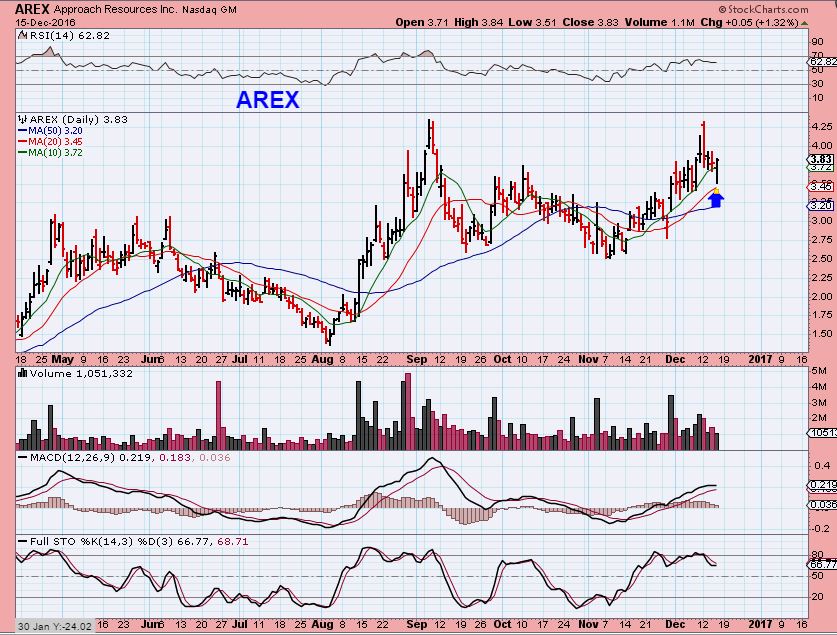
AREX – I have been pointing out AREX, and it is doing what I think many of them will do. It is consolidating and looks to be preparing for higher price in the future. It held the 10sma for a while, and now reversed off of the 20sma.
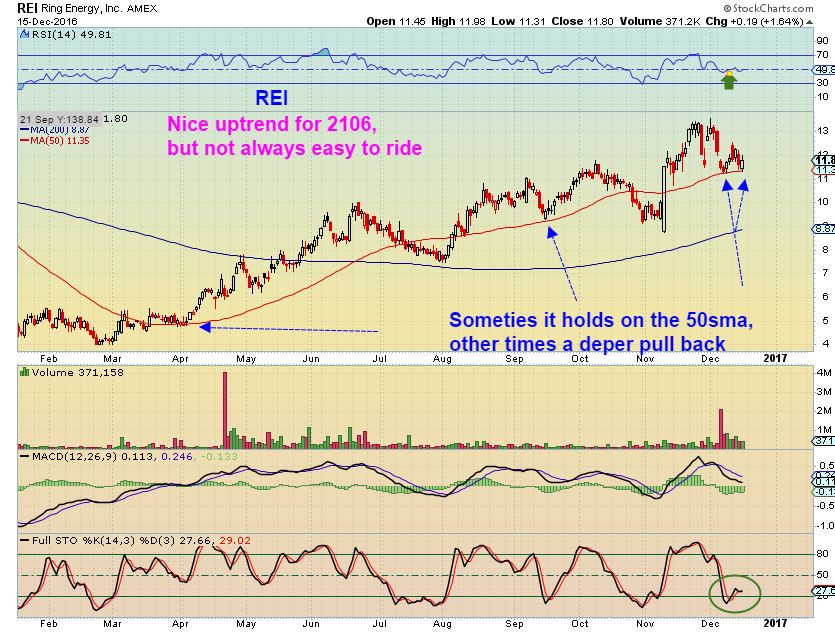
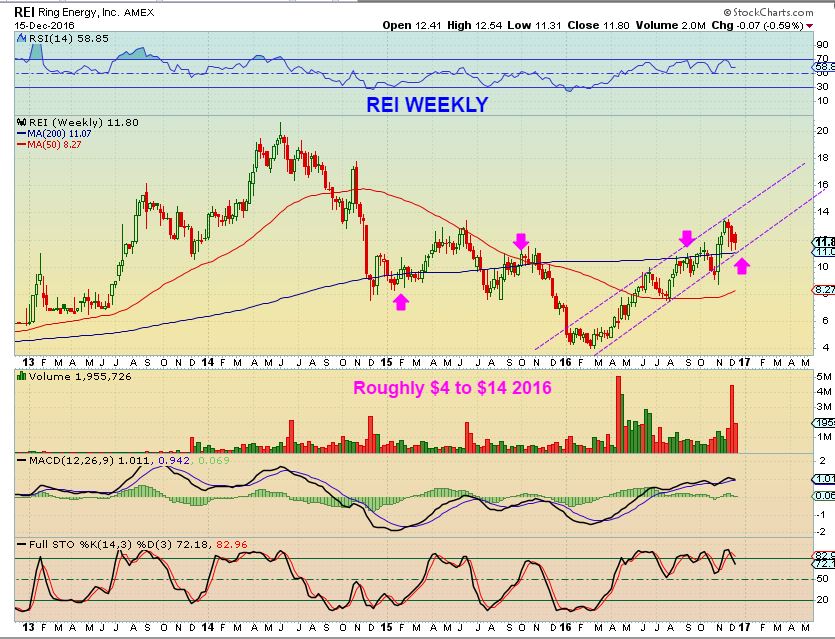
REI 2 Charts – Yes, that should say 2016 on the chart. It has been a nice run at a glance, but you can see that the dips in the past have been multi week dips (Tough to buy & hold & boring at times). This is a bullish stock( $4 to $13 in 2016) and those dips are just part of the bullish run higher. It is at the 50sma ( possible support).
REI WEEKLY – $11.00 looks like possible support in an uptrend.
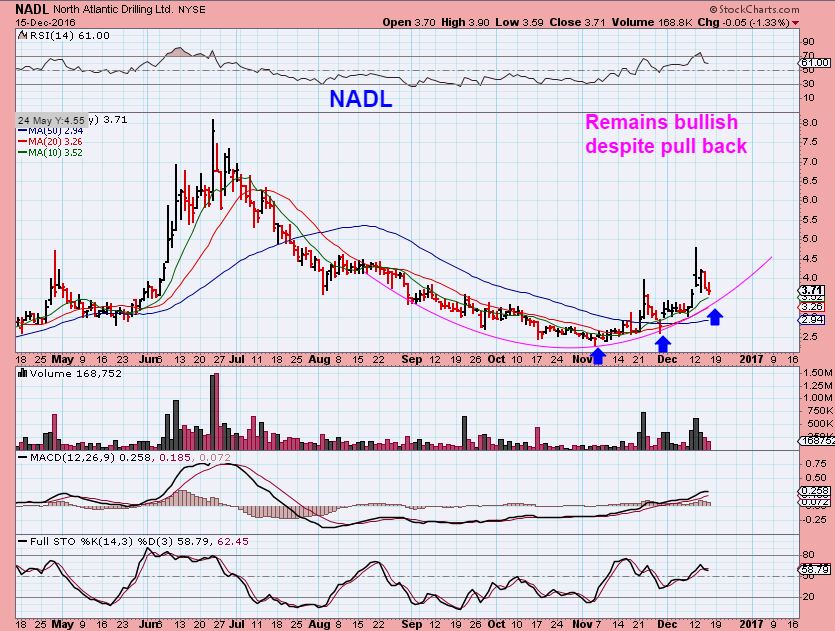
NADL – This is a controlled low volume pull back and remains bullish. This doesn’t look like much of a run, but it did just run from under $2.5 to $5 in 1 month.
So you may want to check on your Energy list and see if the energy stocks that you follow are also pulling back in a nice low volume orderly manner ( OAS, WLL, ETC). With the surge that Energy had after the election results in the U.S., they may be setting up as good buy opportunities.
.
GOLD, SILVER, MINERS
I mentioned in yesterdays report what I am looking for in this sector. I really need to see a reversal this week, so that the weekly charts show the potential of an ICL. I am going to do a bit more research for the weekend report, but I will discuss a few things for the Friday trading day too.
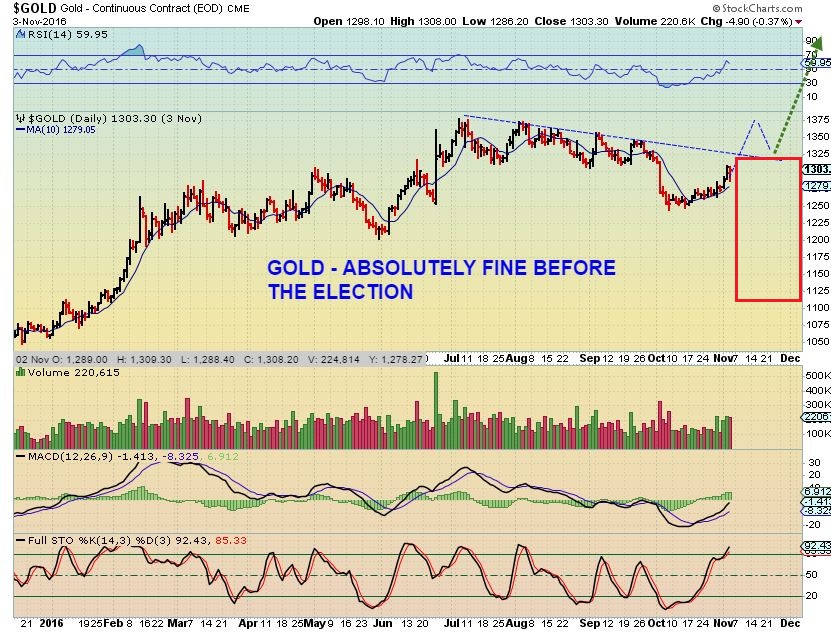
GOLDEN BULL – I need to reiterate that Gold had a stellar bull run in progress right up into November 3 ( Elections in the U.S. are Nov 4th). It is from the time of the election results that we see a drop and that drop slowly became quite ugly. It no longer fits the description of a normal 50 – 61.8% drop.
CAN THIS RECOVER? Yes it can, but at this point in “Time”, we have to be open to the idea that the changes that we have seen could be longer lasting than anticipated. I am still holding some Miners, and some have held up while others are stopping people out. If we get a sub par bounce, I will just probably sell and move to another sector for trading.
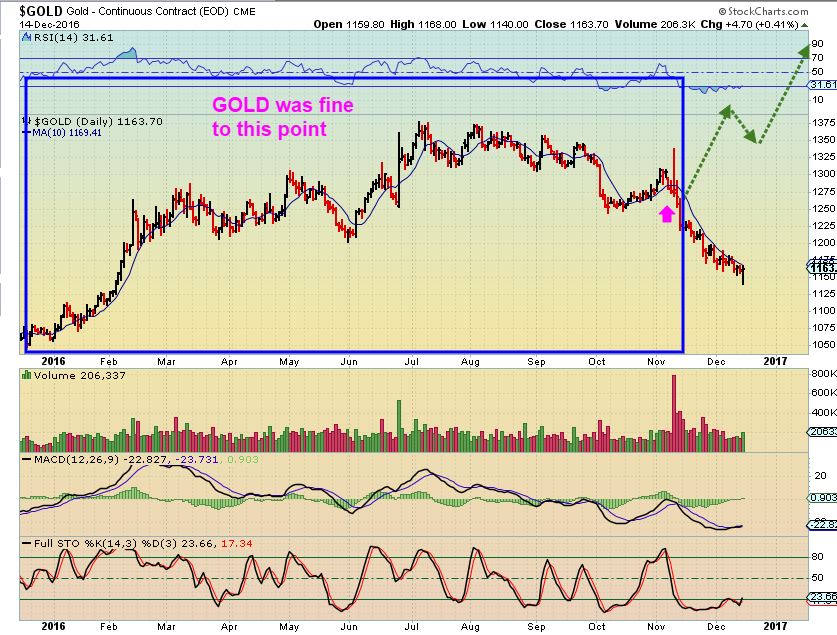
** At this point, I need to restate something. I have repeatedly mentioned that traders have various styles and abilities. Also circumstances. Some are in front of a screen, others are not. So some traders will try to buy each reversal before it is confirmed to “catch the lows”, other conservative ones should wait until GOLD crosses the 10sma and then puts in a ‘confirmed’ swing low. I have admonished no leverage , unless you are a very experienced trader in front of your screen all day. Gold HAS NOT crossed the 10sma and put in a confirmed swing low. Now look up at the 2 Gold charts posted above again. In that last month, I have received (just a couple) emails that stated, ” I am all done trading. This is brutal and I need to stop trading for a while”. I do understand that frustration, because Gold has been bleeding down day after day, but even at that, the above chart is not death dealing unless one is over-invested, using leverage, or not trading according to the proper style that would best serve them (Waiting for the confirmed swing low). PLEASE be careful or do not use leverage and hang on hoping for a pop. Even JNUG / NUGT can cost 20% a day on that position. I also have others emailing saying ” I hope this drops further! I have been patiently waiting and this is great! I can’t wait to buy this dip.” You see how sell offs can affect us depending on our positioning. I own Miners, and understand the frustration. I do believe that we should get a relief rally soon. Looking at the above drop from November, it wouldn’t take much to recover that too. Lets continue on…
.
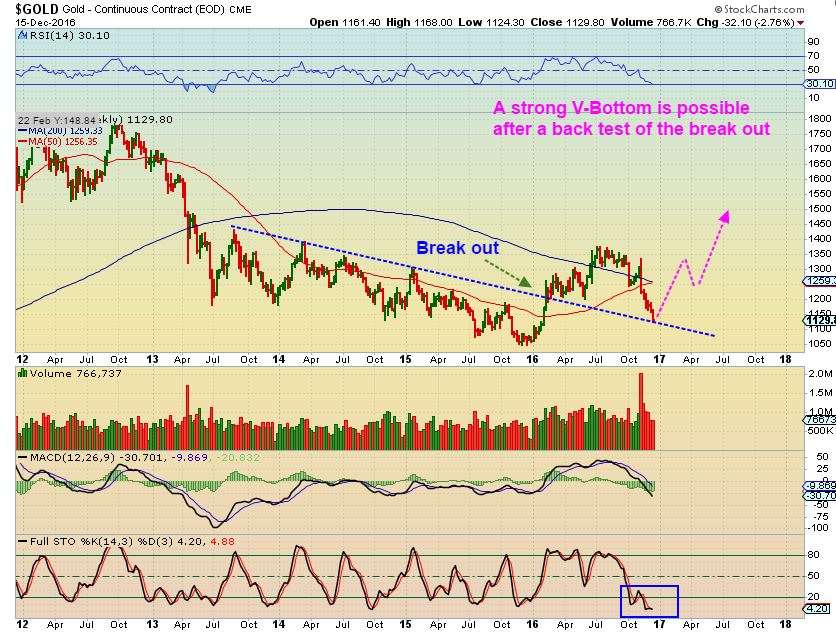
GOLD WKLY – This is my line in the sand for now. And you have to think that we will get a good size bounce from these oversold conditions, and I would expect the threat of inflation to reinvigorate this bull, but I dont want to be a ‘perma-bull’ in a market that could be dying. I will explain more in the weekend report.
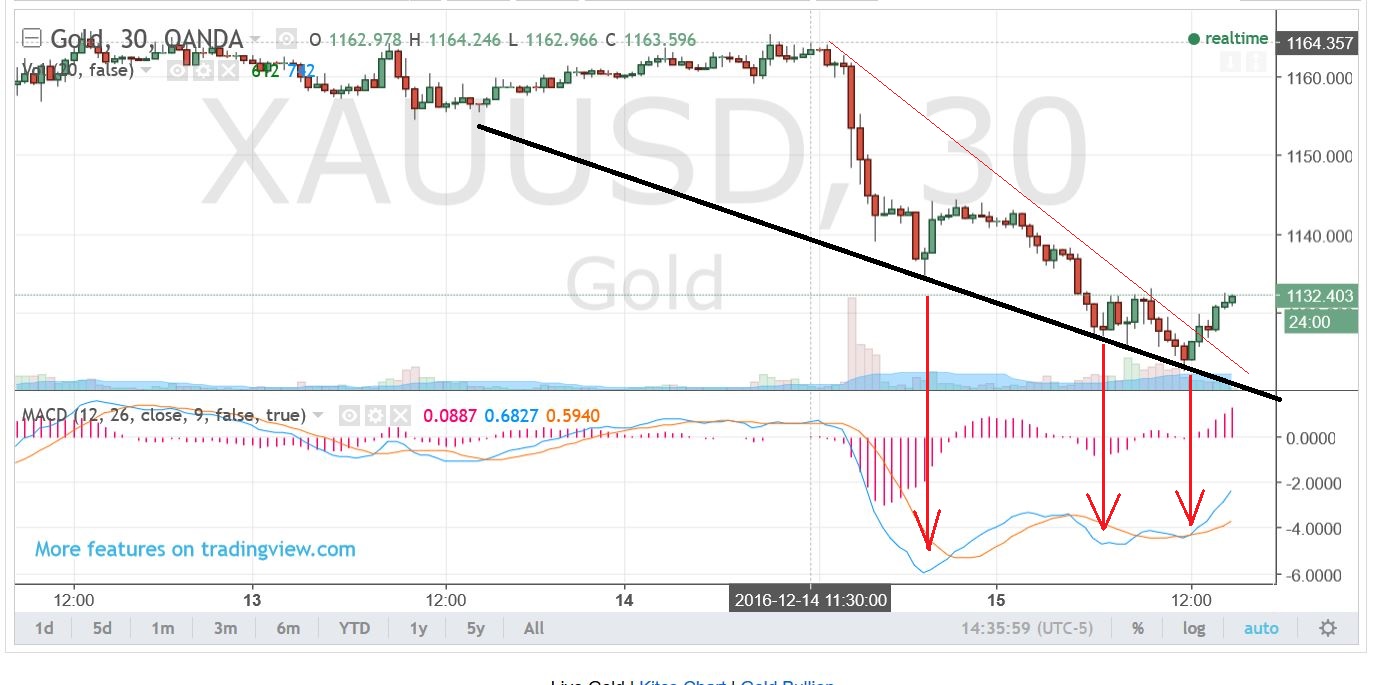
GOLDs 30 minute chart put in the lows as I was watching it yesterday. Let’s hope they hold after 8:30 a.m. eastern time, when Gold often accelerates in its trading
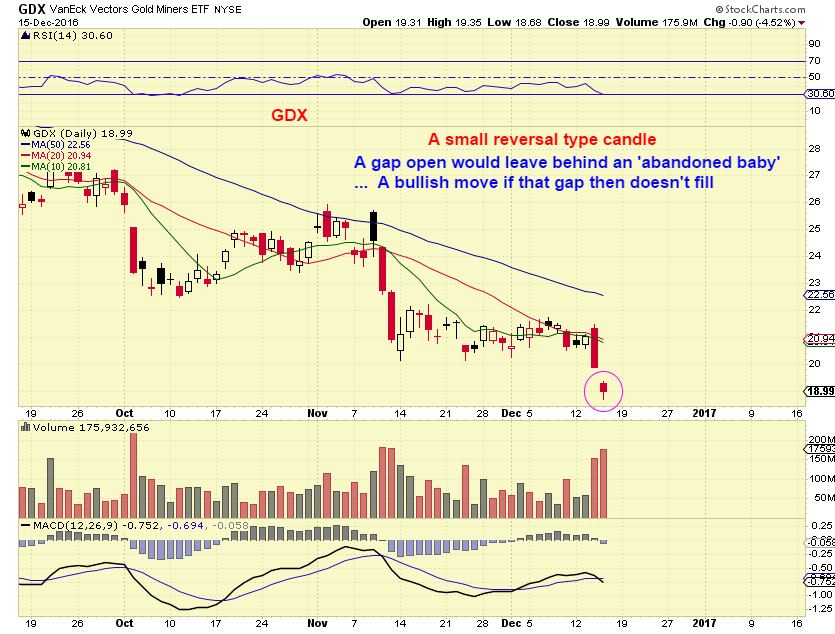
GDX – possible ‘abandoned baby’ if we gap open Friday and do not close that gap. At the very least, it looks like a reversal candle. Higher price Friday will give us a nice Weekly candle.
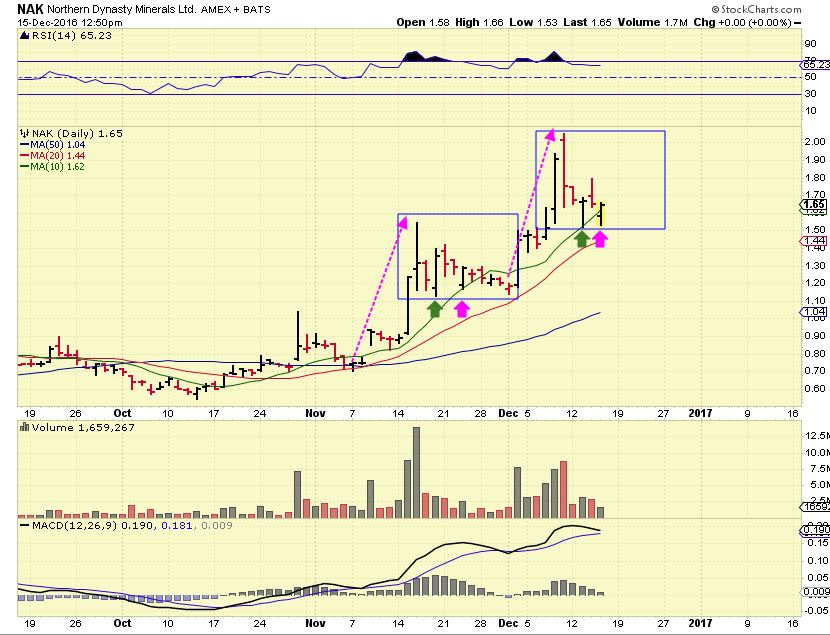
NAK – This is a stock that many are becoming interested in now. I have been tracking it since it was 30 cents, and it just continues to act correctly. With this in mind, please remember that “Acting correctly” involves a good size or prolonged correction at times, like we saw here from the AUGUST highs to October lows. looks great now, but those were tough times for those of us in the BUY & HOLD crew.
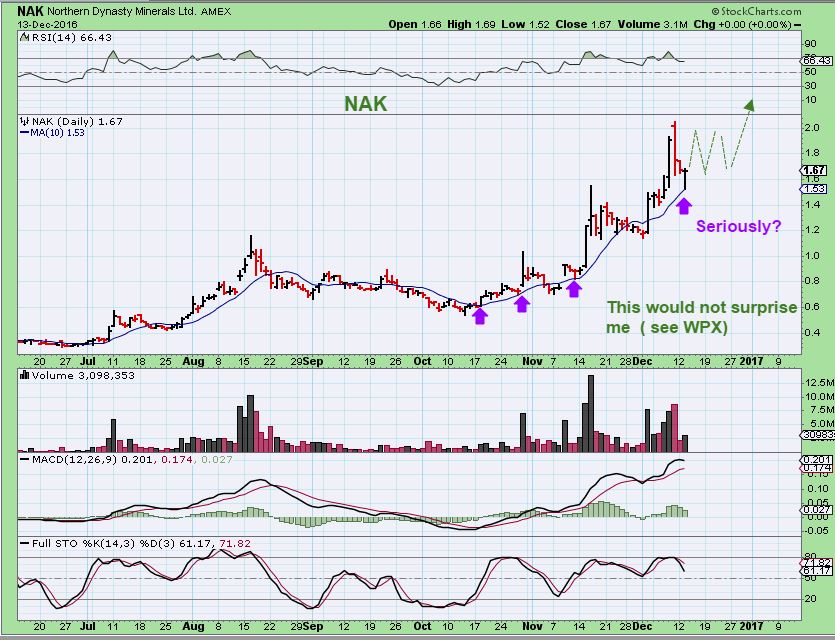
That said – NAK continues to act well. This ‘square’ may play out like the November ‘square’
So that is where we are at . Friday will speak to us and I will be listening for the weekend report. NO MATTER WHAT, we should be getting a bounce at the very least soon, and it will be time to ride or unload some positions.
TRY NOT TO GET OVERLY DISCOURAGED with the discouraging weakness in Gold & miners. It can change direction quickly, or we will change direction. Gold has been breaking down since the election, and this is the line in the sand. We WILL make good trades in the future, even if it has to be in another area. In the meantime, ENERGY and METALS like CLF, VALE, FCX, AKS, etc, etc, could be pulling back and ready to offer us an upside run of their own. I wanted to mention quick trades in Shipping stocks, but I do not dare to for the sake of possible pain and suffering, but TOPS, DCIX, GNK, DRYS, etc are at it again. Pure speculation. I recommend you do not trade them, especially extended ones, if you are not a very experienced trader sitting in front of your screen every minute that you can be. I will cover a little additional trading thoughts after signing off here. Enjoy your Friday, pray for a reversal in Precious Metals, and have a great weekend. Thanks for being here, as always!
~ALEX
.
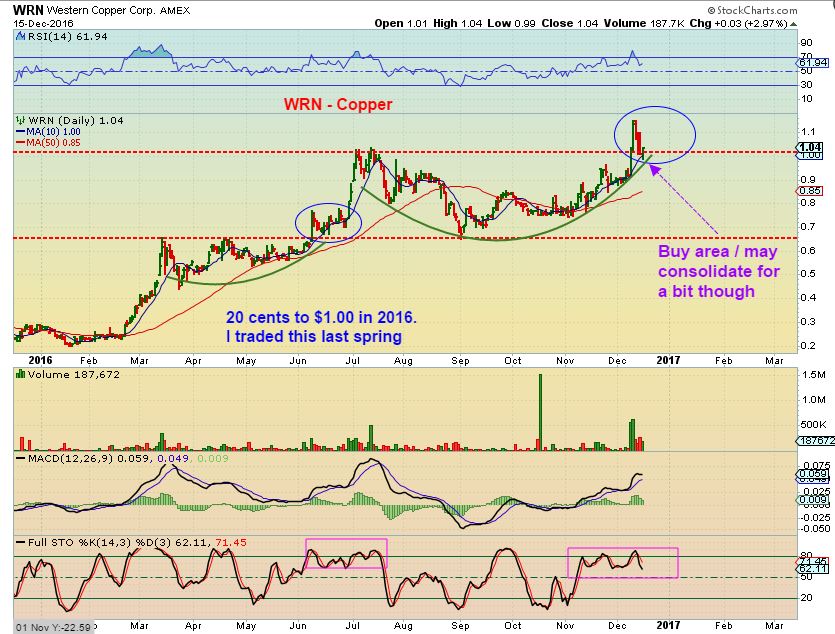
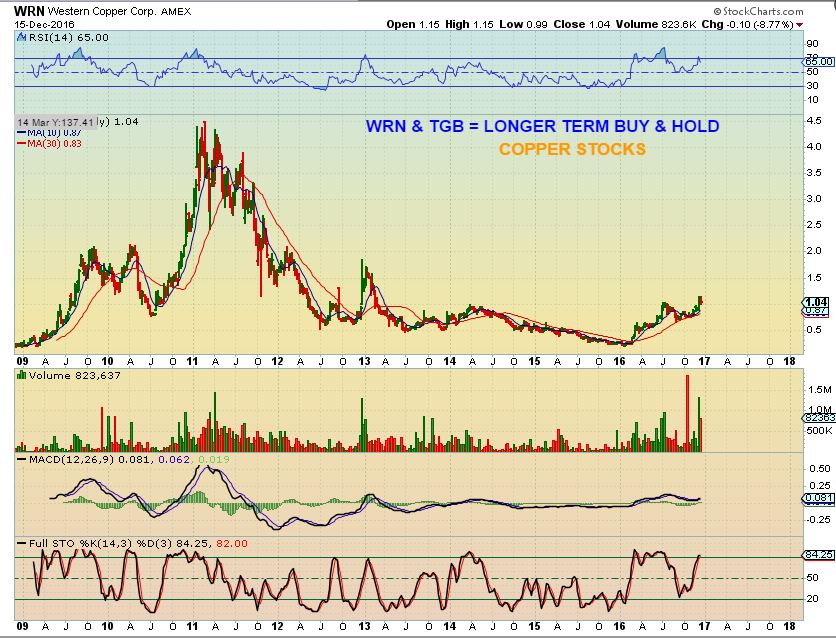
ALEXs PICK – Along with TGB, WRN has been a nicely performing Copper pick. I believe that like NAK, these could just be BUY & HOLD for the longer term traders. I believe this based on weekly charts and current price action.
.
WRN DAILY CHART #1 – I traded this last spring. This might drop to the 50sma, depending on what Copper does, but it also is in an area of support similar to this past June.
WRN WEEKLY CHART #2
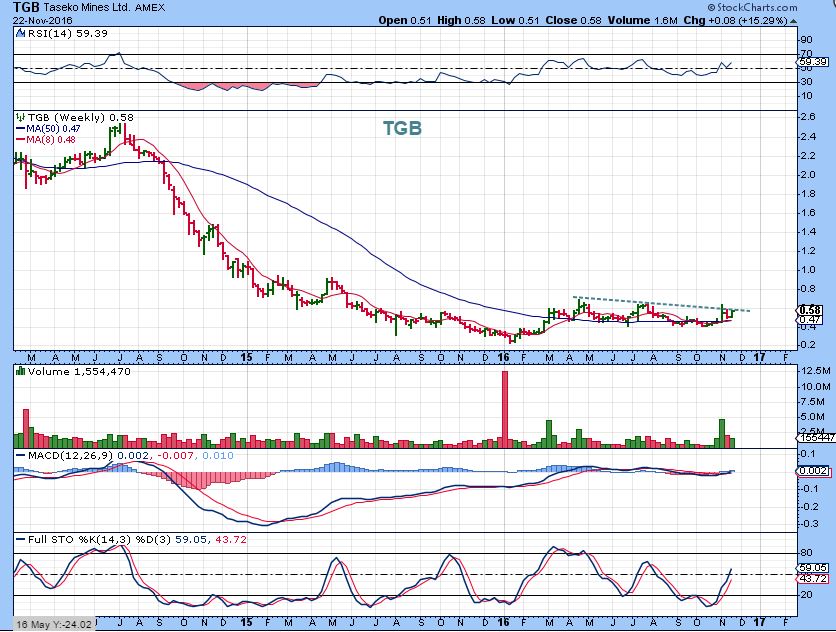
TGB pointed out near 50cents
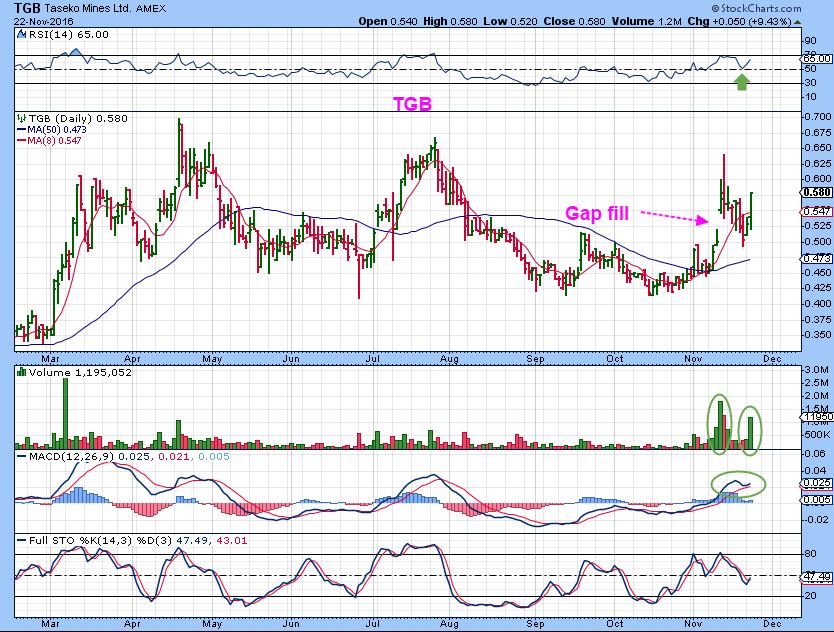
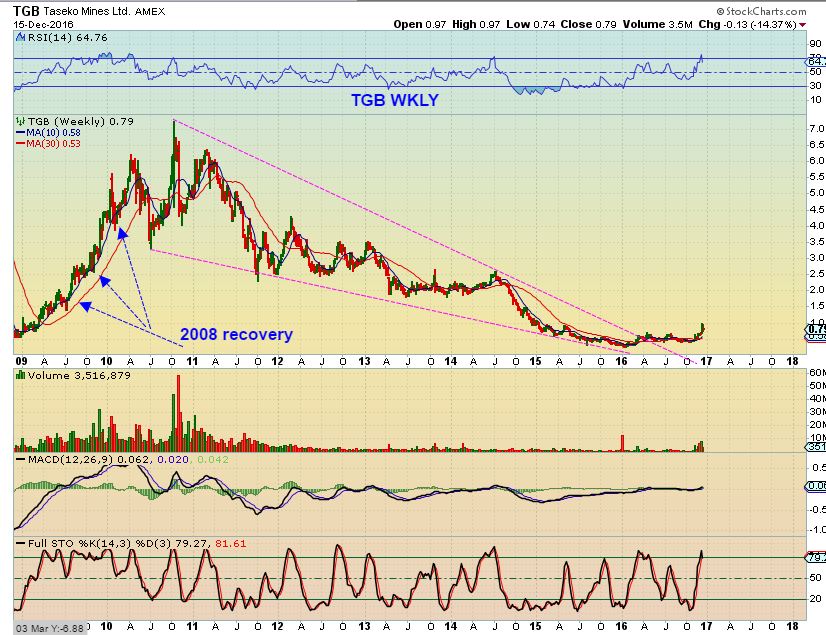
The run to almost $1.00, and it is now pulling back again. I’m watching for another entry.
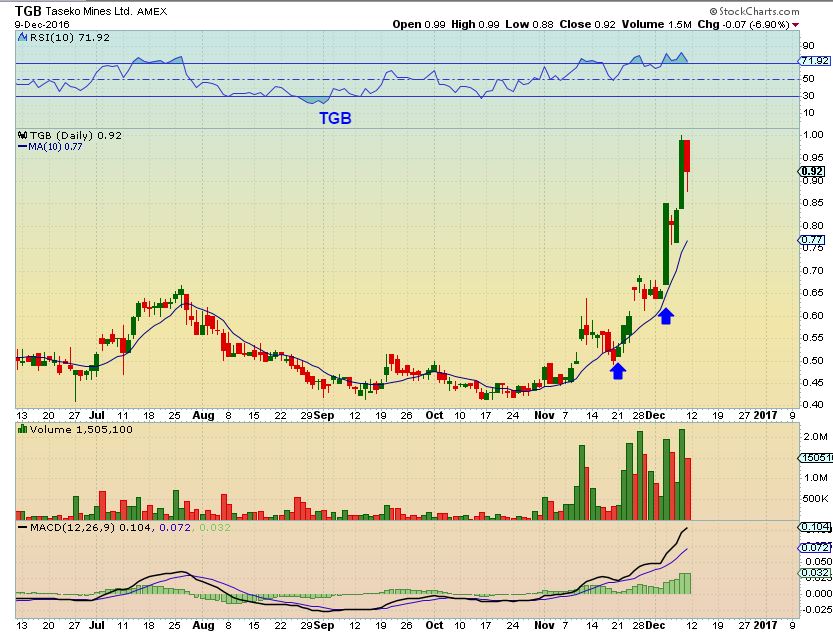
TGB – Again, the big picture looks good as long as Copper is bullish.
 .
.
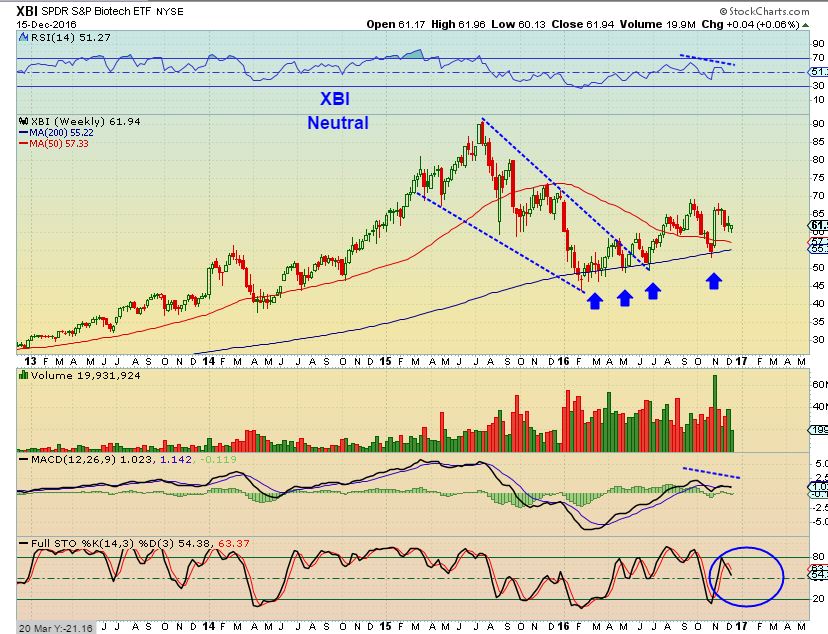
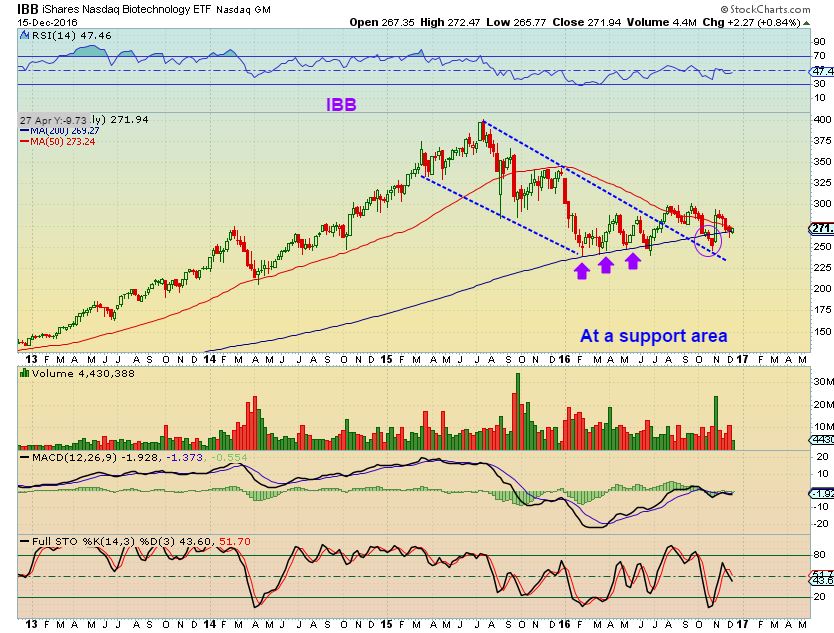
By request. I was asked to look at a few Biotech stocks like HALO, LJPC, CELG, etc. and give my opinion. To begin with, I looked at the IBB and XBI, and they are “O.K.” – they are under their 50sma on a daily, so they are rather neutral to me at this point, but a push above the 50sma would help. Let’s look at the weekly charts.
XBI WEEKLY– I am somewhat neutral on the weekly chart, because it did POP a few weeks ago, but it could continue to drop from here, like it did in October. The low risk entry was in Oct at the weekly 200ma, but this dip may be worth watching for another sign of strength.
IBB – This looks better, because it is sitting on support. It broke down ( to tag the trend line) and recovered on its Oct Pop, which was a high volume sign of strength. So next, let’s look at the stocks that I was asked to look at.
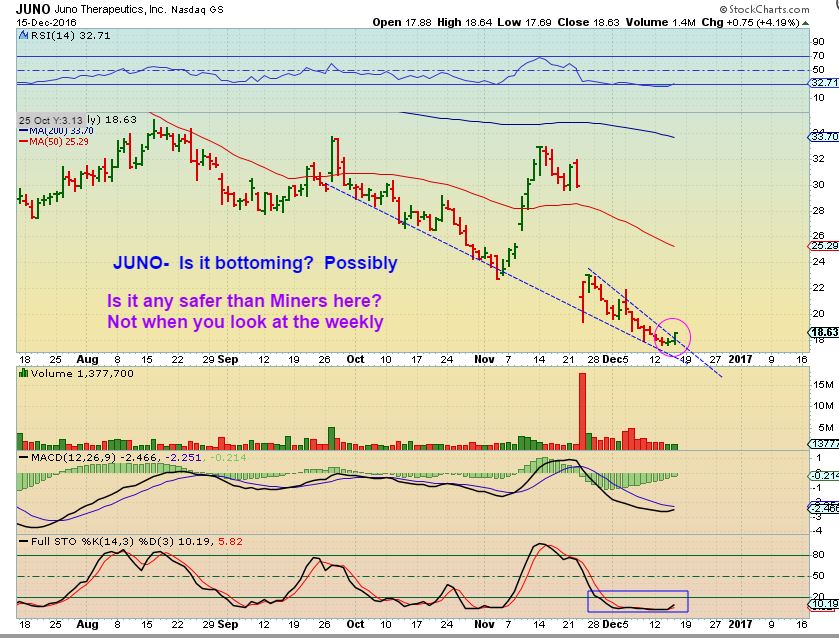
JUNO CHART #1 – Actually, I do see a reversal at the lows, but this stock has performed miserably, and I cannot say that this is a sign that that will change. Breaking from a wedge, this could pop and run for a quick trade, it may even run to the 50sma, but it is risky when you are dealing with Biotech and potential bad news. Something slammed this in November, and whatever that was could still be present. Please look at the daily chart below and the weekly chart that follows.
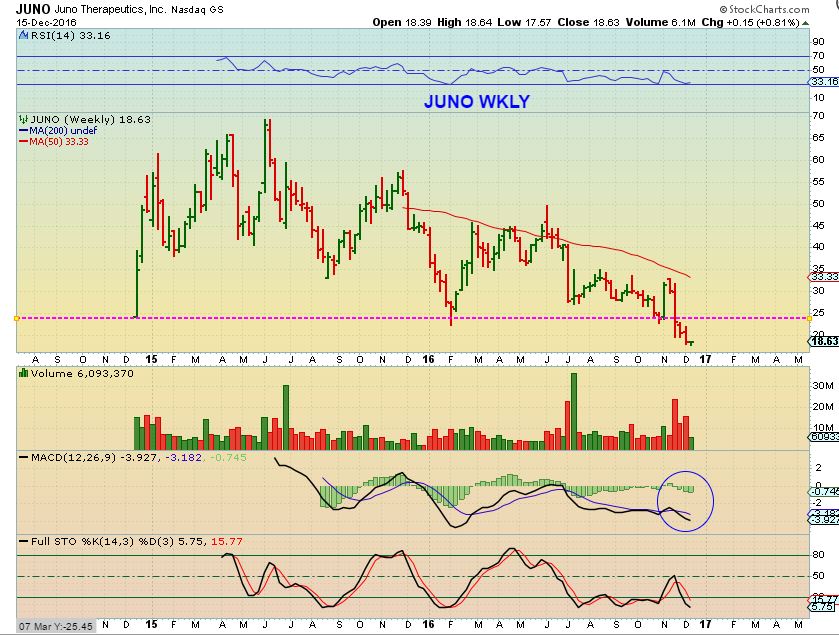
JUNO CHART #2 – All time lows, no support. Yes, this could bounce and tag that break down at $24, but just be aware that this is not ‘low risk’ until it recovers the lows. This is a weekly break down with no support below price.
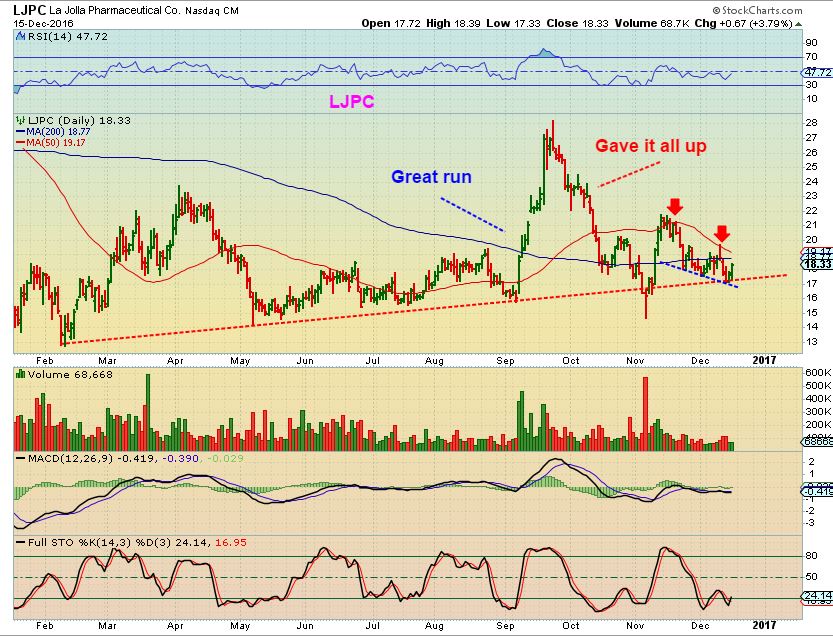
LJPC CHART #1 – This Pharma stock had a very strong run in Sept, but gave all of those gains back. It then did a shake out & recovered, but the 50sma is pinning it down. It is oversold and at support, so it ‘Could” be bought here at recent support with a stop right below, and hope that it breaks above the 50sma. It ‘could’ be bought when it breaks out above the 50sma with a stop below the 50.
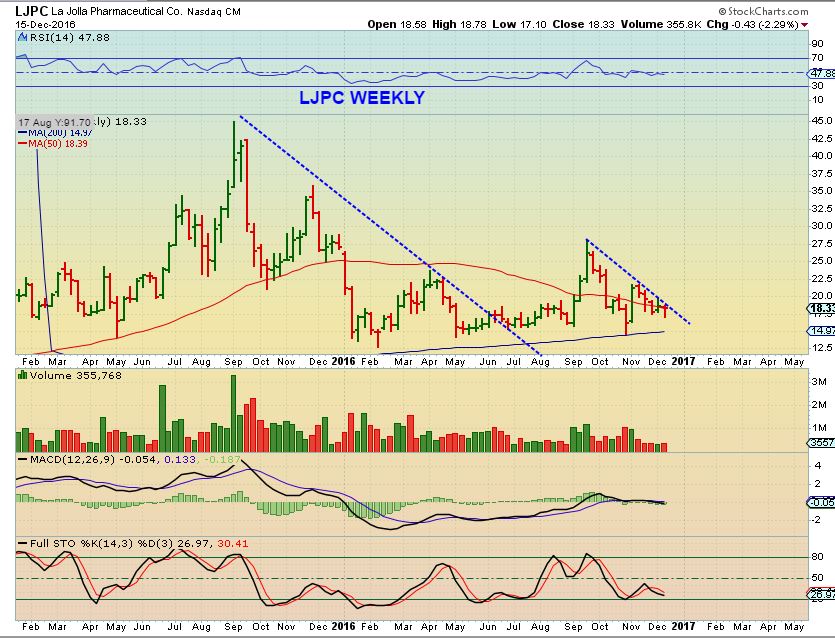
LJPC CHART #2 Weekly – One thing to note is that past break outs went sideways for weeks, so this could break out now and run, or it may break out and drift.
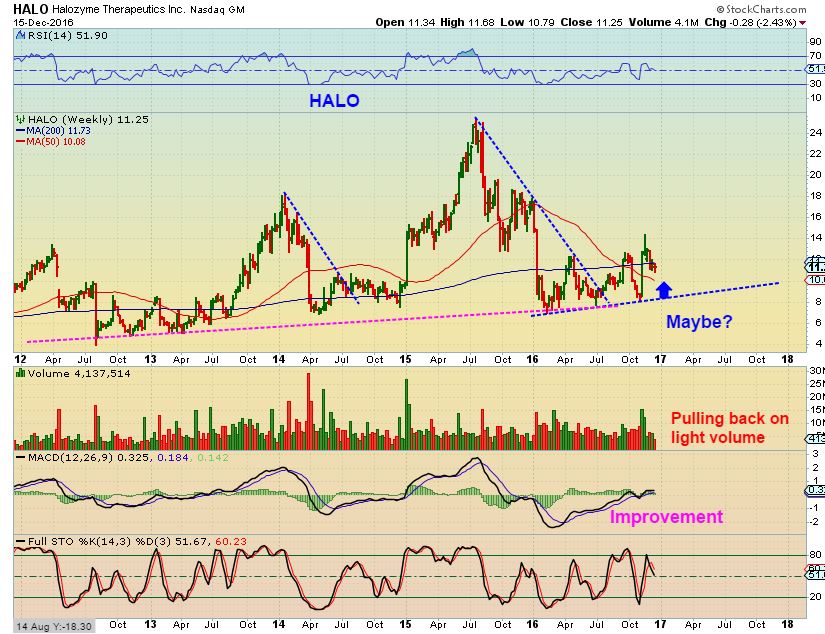
HALO WEEKY – I just dont like HALOs patterns. Yes, it can run after this pull back, but this is a weekly chart and it pops and drops a lot. It isn’t oversold, so it could drop to support again. In other words, it is currently near the top of a trading range too.
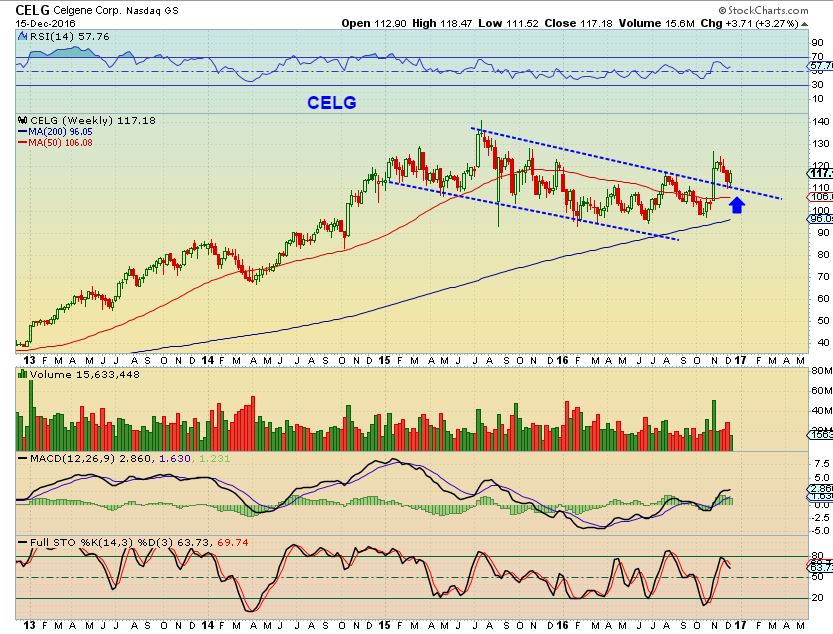
CELG – This is the best pick of the litter. It is expensive, but it could run higher after this break out. This is actually a large consolidation in the big picture. In 2016, CELG started near $120, and is currently $117, but it may be breaking out for a better run in 2017.


I’m up to clinging to 99% with regards to gold/miners but I still have hope (just not much else).
Nat Gas, going to remove my hedge this morning as we met my initial $3.40 target pre-market. Could still fall to $3.20- $3.25 by end of month before Wave 3 takes it to $4. But, options bleed time and they are up 140% so…
Alex, Thx for the long friday report! Maybe a gap up happening in GDX…it’s trying.
It is set to gap up, but it wont be enough to “leave a gap’ between yesterdays highs and todays scheduled opening price.
Alex- it’s def not pretty and thanks to nak and no leverage I haven’t done as poorly as expected. The truth is nothing on the longer term charts is yet broken. We are in the standard retrace zone but the velocity has been what’s hurt people’s confidence.. mine included.
Pretty much the same here. I really loaded up on NAK down at the 30-40 cents area, and added again as it went higher, so the recent run up has actually kept me green on many days, since I own GPL & AUMN and they weren’t selling off very much either. I also traded energy lately. I think that it somewhat sheltered me to what some of the other miners were looking like, until I ran through a bunch of charts the other day.
Can this retrace remain bullish? Yes, it can even test the area of lows that were a major bottom in 2015 and a major break out. It does cause many to give up all together. Certainly not as fun as when these little rocket ships run higher.
Alex, are you still tracking memp? If so,
any thoughts?
I’m actually still in it ( I have a mental stop below the 20sma). It doesn’t look bad after that big pop on Nov 30 & Dec 1st- kind of consolidating, but it is a little boring and it is also testing that 20sma. If I sell, I take a small loss on it, I got in higher.
Thanks. I’m in at .63 and watching.
Thanks for the answer and thanks for asking TSF…I am in too at .67.
Looks like it might close right on the 20sma of $.47, I’m still holding at .64.
WTI just won’t stop long enough for me to get in…
I just looked t it….Bye bye, huh?
Please don’t do what I have done, but I just bought that drop on DCIX at 9:40 a.m.. HUGE volume today, but this is pretty high risk.
Just a fast trade most likely
My SINO started red, but is green now. SHIP up 15%. OOPS, SINO back to red. 🙁
Yeah, they are all over the place, this is one trade that I do not recommend 🙂
Sold my SINO for loss, broke 60 mma. Had it for a long time and ended with a loss.
Yeah, I just got stopped out. Possibly one of the fastest trades this year 🙂
I noticed this with DCIX ,GSL, and few others so far
.
Crazy stock though, did over a $1 swing today and it is only a $3 stock 🙂
.
Opened at $4.33 – I bought at $3.75 area, , it went to $4.15, then dropped to $3.20 area. All within the first 40 minutes . CRAZY CRAZY
.
https://uploads.disquscdn.com/images/8c62bc639dfa7667cb718d02a35babacf004e0e82b70548a8ec0c340330791fe.jpg
Now the Miners start moving higher, and GPL starts dropping on me. Ugh.
Fwiw, today is precious metals options expiration. I understand sometimes that can have an affect as the big boys try to pin the price down to their favor (?)
It is triple or quad witching too, right?
quad
I open up the Fridays Report and took a look at the Pic and my stomach immediately started to growl….. 🙂
Yet another small “timber” in gold and the GDX. Poo.
Here we go again? Thank you sir can I have another?
I did buy NADL and WRN in the report. They do have good looking set ups going forward ( used the 10sma and not really over extended.)
WRN looks good longer term if Copper keeps performing well.
DO I WANT TO ADD TO NAK?
Crazy that we can’t get a decent rally going in the miners after all of this. I’ve suspended myself from trading until further notice.
Maybe all it took was that post to get things going.
Oh , Funny guy, aye?
The Markets have ways of smackin guys like you around 🙂
BOOM! Did you see Gold? It worked, Thanks CARL – NET – SCOUTS 🙂
Let’s see if it can hold and how it does the rest of the day.
Maybe you should say it again?
I’m with Carl, trading suspended. (i’m willing to try anything at this point!).
Yeah, I’m with Daz & Carl, I’m selling everything including my computer screens!!
i bought back half of my AUMN 10% cheaper.. so that was nice.
problem is, i’ll probably end up buying the other half 10% higher
As long as you don’t sell the other 3/4 20% lower we’ll be gud!!
lol.. now its getting complicated.
….really???
https://uploads.disquscdn.com/images/07f093c19e338681e8166c603f2370da6dd8c90b93b6668c836026cd761e0bfc.png
NO, Not really 🙂
If HUI can get over 170 and hold I will feel a lot better.
Really…Geez….I just added some miners that are lagging from this early move up in Metals.
agreed Ken.. I gotta trade as if I havent been burned.
i need to be loaded going back up, to recoup my losses
Yes Exactly SOG
not wanting to re-open old wounds… but i think there may be blood on the streets right now 🙂
I am not sure about the “blood” but these are the times you gotta be in the game as a trader imo…..
As I have stated before I will be in the bull camp unless the Dec. lows are taken out in Gold……then all bets will be off the table. I also added a tranche this morning to my leap calls in GDX and SLV….I am getting somewhat “heavy” in this sector but now is the time imo.
its just threatening to climb back inside the recent d/t channel
its the move we want… hoorah! 🙂
https://uploads.disquscdn.com/images/c00ef534c79a45a75157c76b2e1a80d38ffb2f852d00f748774d6c06b13b94e2.jpg
f5.. of course
With a mini inverse H&S it is making that threat 🙂
You mean buying & selling?
Or just buying.?
Or just selling?
Or just Miners?
I’ve quit 5 times. But I have also quit quitting as well…
Haha I like that.
At this point, they may just be trying to shake people out of their positions in the miners before the next run/bounce.
YEN futures higher
Is that john Belushi speaking?
Sometimes I feel like my entire portfolio was picked out by Belushi! :O
Gold and Silver back inside their BB’s……
A very good start imo….we shall see though.
USD looking heavy……
Bonds basing ? looking light…..
Interesting couple of days…
Doubled up on SGY after that epic reversal yesterday (glad I didn’t set automatic stops). Looking good today. Also bought NADL and AREX on tips here.
Stopped out of AMRS.
Yesterday sucked, but not that bad since I avoid 3x ETFs. My total losses on miners is pretty epic, but my account is fine thanks to a good year. This next ICL should be pretty good.
Nadl is setting up really nicely here. I can see this being able to run up over $5 next week.
I bought it back too.
I bought it this morning, had to leave the screen for a while so sold it for profit before I left….will get back in at some point, just didn’t want to give up my profit since I had to be gone 🙂 🙂
Please, ICL. We don’t have enough time in 2016 to realize it (full amount) but man, if we did I am positioned to really do well. Come on!
Alex,
That was a cool line in the sand on the Weekly gold chart. To my surprise the same line in the sand works for GDX and GDXJ.
As an engineer I never assume that gravity won’t be working where I don’t have to worry about the weight of parts.
Why do I assume something is going to go up (trend) when it has not reclaimed its 10dsma?
Great advice on the 10dsma as well!
Yes, Gravity wins , unless we can get some sort of a ‘lift’ under the weight of our parts 🙂
We really do want to see a recovery of the 10sma soon
…yeah… That darn gravity…
#underwire
Interesting…tx 4 sharing 😉
I am a long distance runner in this. Started with physical in 1998.
Got out of stocks in 2006.
Went into miners January this year and out mid May. Gradual purchases.
What is going overseas is coming here regardless who is Pres. I also had
a major dream last nite of a major/war/with/China but that is few years off
yet. Don’t lose money if you have holdings. Just HOLD. They will go back
up. If there is going to be a stock market major drop it will happen soon.
Miners can go down the first couple days and then they fly up. I am
holding. The charts are extremely oversold. Compare the current bottoming
to years past – this is an extremely long bottom right now. It will rally again
up past even $1,900. If you have cash – stack stack stack at these sale
prices! Be happy. Capitulation = the bottom . . . . .
Here is my scenario. I expect a crash like 1929. There, Homestake followed the market down for the first leg and then rallied hugely for the next few years while the stock market continued to the basement. I view the rally from Dec to be a wave A and we are finishing a deep wave B. Thus, we should have a wave C next. This will be a multimonth affair at least into May. During this time, the DOW will put in a long topping action as the Fed and Trump fight. Then, both gold and stocks will begin their descent for a large first leg down. After that, they both will rally for a few months when they separate with gold going higher and stocks going lower for several years. You are welcome to accuse me of having a cloudy crystal ball, but what the heck. Have a great weekend and hope we are at the bottom of B. 🙂
Thanks everyone! Have a great weekend!
Ditto!
Idk, I was getting bearish on stock market looking for tops in 2015-2016 when we had the Aug ’15 crash and the Jan ’16 crash but no bear. I continue to think this bull is old and I can see a topping pattern in weekly and monthly charts but I learned a while ago that fighting the Fed and that trend didn’t work. So, will have to see it happen. But agree, best to have a plan so when it does you can trade it accurate and not just sit there and go down with the ship (cause I’ve done that and it sucks. Bad).
Housing starts dive 18.7%, mortgage rates rise.
Probably why gold silver up not just lower US$ down .34
PZG – impressive break back above the 50sma
GPL – Nice reversal regaining the 50sma
EGI- Nice
Huh huh… bought it!
Nice move on BTG with GDXJ acting stupid again this afternoon.
Here is a fundamental story that should warm those who are still holding gold/shares.
http://www.marketwatch.com/story/gold-is-the-investment-with-the-biggest-turnaround-potential-in-2017-2016-12-16?siteid=nwtam
Thank you Glmus! Hope feeds the spirit!
I am up 99% hope. Feed me, brother. I got nutin’ left.
Cason, Happy Holidays! Keep hope and a positive attitude. We can make these circumstances work to our advantage! It just requires a steady supply of patience and thought. Apollo 13 had no cabin pressure, no heat, no telemetry, no internet, no Maria (that had to be tough, lol) :), What they did have is a goal ( and duct tape). As always, baseball holds clues to the solutions. “If you don’t know where you are going, you might wind up someplace else.” Yogi Berra 🙂
😀
My account sure could use some duct tape right now. And maybe a few trades that are working!
https://uploads.disquscdn.com/images/9711ac0e56772bd6b14ec886447af683483d9e61d80d03519f49f5ed4d3513ac.png
If this is the fruit of a new GMO, then I see a surge in Christmas tree sales! 🙂
Run a GDX v Gold chart. Right shoulder nearly finished.
BCEI has a bull flag but volume is light.
Remember, that if you sell at a loss you cannot write off the loss if your repurchase the same stock within 31 days -per my CPA.
Yeah, wash sale rules are killer. After you disallow the loss from a wash, you can purchase a 3rd time after 30 days and lower your price point (on the taxes) and make it up that way. It’s pretty complicated so I use a software program that calculates it for me. 🙂
gdx one more drop before a bounce ,probably Monday will be the day around 18.50 and a move up to 22 !!!!!!!!! this will be cool ,,,,,,,,,,,,
Then $31. Yeah! 🙂
let’s break the down trend first and maybe just maybe !!!!!!!! but deep inside , I think we’re going to need some new hunting ground, if we want to make money next year .What do you feel ?
The same. I’m having trouble understanding. That rally last winter was really something special, that was a bull market move. I have trouble relegating in my head the fact that the US election changed the global fundamentals for PMs so drastically that we went from bull to bear overnight.
However, I’m bearish until we can prove it. Dropping past the 61.8% retrace did not sit well with me. So, I’m in “prove it” mode. If I had sold the pops instead of buying the dips, I’d be sitting on a nice pile of cash right now. I cannot understand how we haven’t rallied some yet, starting to get non-sensual. I’m with Alex, need to re-assess once we finally get some traction. But for now, likely just looking for an exit – which means it will rally you leave me behind again! 😛
Meant to share this last night but had a computer issues. Which also wiped out the 2 notes I made on the chart. 2 main points:
1) notice the open interest turned back UP. Unexpected if you ask me since we have not confirmed a bottom.
2) As always, this is as of market close Tues. We had the Fed on Wed so that means that we won’t get that super waterfall data until next Friday a full 9 days after the fact (which is BS, if you ask me).
https://uploads.disquscdn.com/images/7f5d76543d8b91bf3c3a27bdef1d1f3070a8ec4847b225237ce83ed3a94dca8b.png
Ok, here is one good thing that happened – I was able to buy back AUMN and VGZ both for 15% less than I sold them pre-Fed. Everything is on sale (as long as it doesn’t go completely worthless!). At this point, stops are very tight, pretty much not allowing any move down – Line in the Sand!