
Friday June 10th
We have 1 trading day left in the week and then we can relax. The weekend report will further our discussion on Energy and Precious metals, so today I am going to just show you 3 charts that will be in the weekend report.
.
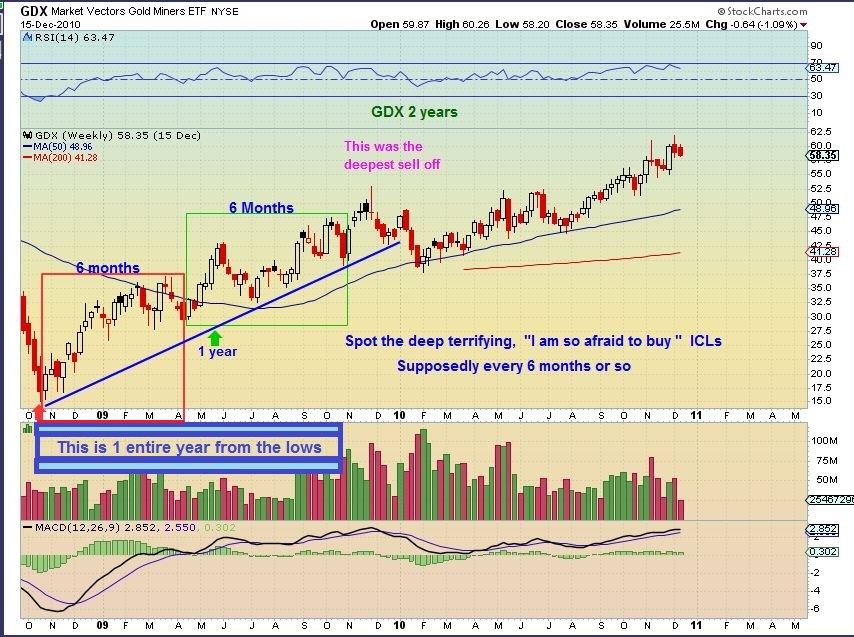
You may have heard that you should not buy miners until after a ‘blood bath phase’. As mentioned in my May 18 report, I have received emails telling me that warnings are out that the next ICL ( meaningful cycle lows that occur roughly every 5-6 months) will NOT come until we first see a huge sell off. Many think that will happen around Brexit ( June 23rd).
.
I used this chart to show what happened coming out of the 2008 lows, when we looked for our 2nd ICL. I do NOT see a deep bloodbath phase 6 months after Oct 2008 lows. I see higher lows for 1 year, so that is noteworthy.
Actually, for 2 weeks I have been saying that we could be at the next important low in the precious metals sector. Last weekends report discussed this idea further and this weekend will include more research in that area .
I mentioned that a break above the overhead down trend line would give further evidence that we saw an ICL without a bloodbath phase. This was GOLD on June 9th.
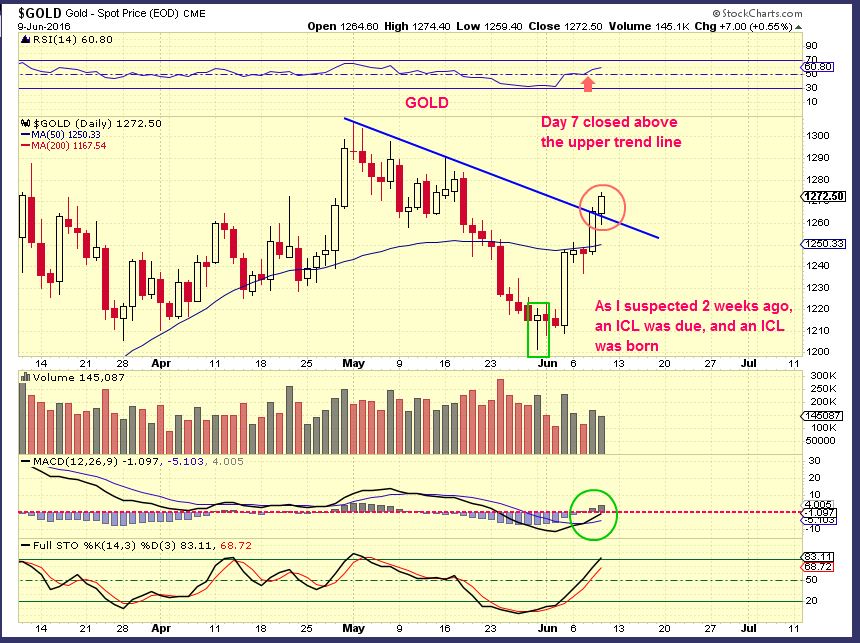
Gold and Silver have been moving higher for the past 2 weeks. Here is some more good news.
.
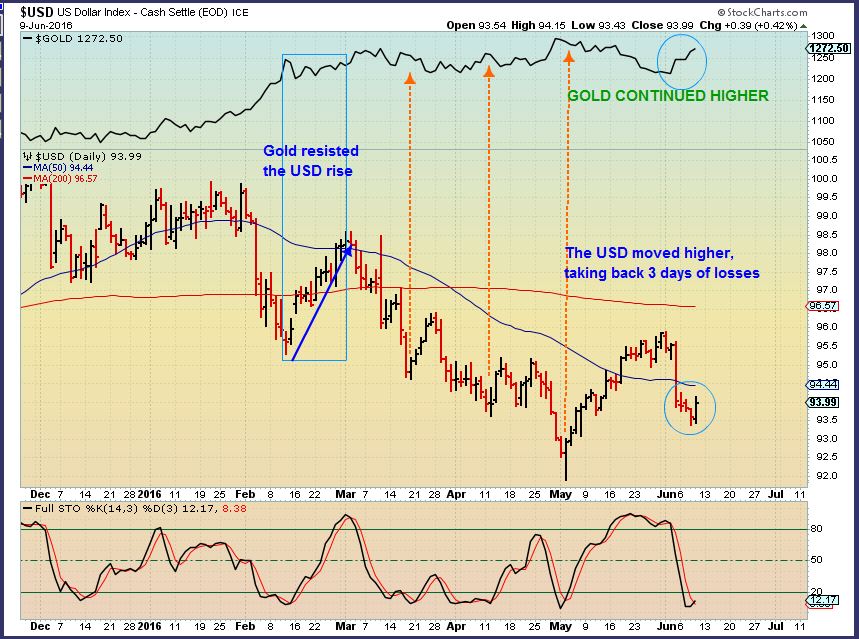
USD – The USD was due for a Daily Cycle low (DCL). Thursday, The USD took back 3 days of losses, but Gold and Silver moved higher with it. We have seen a change of character here, where the dollar can rise and Gold did not drop like a rock. See also Feb 2016 on this chart.
.
So enjoy your Friday trading. After a market review, we will discuss mainly Energy and Precious metals in the weekend report.
.


Thanks for the Friday report, Alex – TGIF!
Ur welcome Cal – have a good weekend 🙂
Alex, Thx for the report! Just for my own education–I was under the impression that an ICL would be confirmed only when it broke the weekly TL and (better) confirmed if >10ma. You have shown the daily chart and come to the same conclusion. Have I been doing this wrong? [btw, yes in this instance the weekly TL for $gold was just cracked], as you have shown. Thx again!
Hey Deshy
I actually have various ways of gauging it. You may have noticed that along the way , I have my own methods of research and investigating things using cycles or tech analysis, so what you are saying ( using a wkly) is one of them and it is more of a confirmation.
I try to get in at THE lows, and then I’ll never get stopped out , so I have come up with a variety if ideas…and the risk is far less with a wkly trend line break. By then, confirmation is pretty solid.
Got it! Thx…look forward to an amazing weekend report (no pressure). 🙂
Can we briefly review Energy? Should we sell Today or ride this out. Looks like lower prices in that sector today again.
Good morning Bill!!! I’ll post my ERX chart, which so far hints that we’re still ok. That could change by end of day though. I’ve said a few times that ERY was extremely o/sold, and if you look at a weekly chart, that puppy is about 1% away from putting in a hammer for the week. If you look at SPY, it is also putting in a reversal candle in the weekly with histogram diverging. I got back into ERX this morning, but it those reversal candles hold at the close, I’m out.
Id be interested to see your charts. I’m thinking energy sector and oil are doomed here for a pullback.
And it you look at oil, $WTIC, you could make a case for a bearish rising wedge as well. I’m watching ERY for clues…
ERY looks ready to run
I have given 2 scenarios for Oil (both longer term bullish) and I think oil is playing out as expected.
One of my scenarios mentioned for weeks and weeks was
“Oil could run to $50, actual target $51.60 , then drop into a DCL. I would then expect a run toward $60”.
So far, That was a pretty good call.
The other thought was just that Oil could stair step all the way higher, but that was less likely.
I know youve been saying oil to $51 then a retrace to $42. I think that’s what we are getting now. Maybe not to $42, but a pullback. I posted that EW 12345 Yesterday. I could see it going to $60, but it sure feels like a pullback has started to me.
No, not to $42.
Alex, are you expecting oil to pull back to the mid-$40’s before it resumes its upward movement?
If we are dropping into a DCL, I did mention that it could do that, or just drop & go sideways along the $50 area.
As the timing moves forward, a sideways type dip would be more likely , due to Cycle count getting later. I can see a dip to maybe $46
Anybody have info on RIC?? Been waiting a bit for the pullback but seems to be launching today up 8% in pre-market???
Never mind. Must have ben a glitch in the system.
AUMN may be a good play here. Very oversold, filled that gap and moving higher this morning.
Nice – it was RED when I looked at it earlier this morning.
I have been mentioning that some of these miners are at 2016 highs and breaking out.
Mentioned MUX, RIC, SSRI, AG, etc.
I like the VGZ consolidation too
There are a number of miners that are there, like you said. I just thought AUMN was over cooked and do for an explosive move. Probably a reason it is this over sold? Hmmm
I kind of view ACC/DIST as a bit of a lagging indicator. It tells you what was happening, but if AUMN starts getting bought up, it can change the ACC/DIST. For example:
‘
Take a look at a 3 month chart of NADL.
Look
at the ACC/DIST line on MAY 16, it was at its lowest point, price below
$3. Using ACC/DIST , one would hate that and take it as a warning that no one is
buying.
Then NADL doubled since May 16. The ACC/DIST is lagging
not forward thinking ( all though you could use it when it turns up
and gets going, but most wont until they miss the move).
I had bought it when you mentioned it a couple weeks back. I looked at the charts, liked it and bought it for a longer term hold. That was in the mid-low.30’s. Price exploded, but this 1 indicator I use in stockcharts (accumulation/distribution line) SHOULD be moving up and down in close relation with price. THIS THING IS STRAIGHT DOWN!!!! Even with price jumping like it did! Again, this is only 1 indicator, but I know it should not be going straight down with price going up!
yes, in tandem – I would agree with that.
I just can’t get over acc/dist line in that thing!!!!!!!
AUMN diluted on May 3, 2016. Probably the reason why it sold off.
http://finance.yahoo.com/news/golden-minerals-announces-4-million-105500396.html
Ok, so here we go… time for a quick lesson in what NOT TO DO!!! So I was expecting a pullback in the commodity stocks and energy because of how o/bought they were in the 1hr and 30 minute charts, and it looks like we got the moves down I was looking for, BUT I STILL GOT BIT!!!! Stupid move #1: if you think the sector is o/bought and ready to move down a bit, don’t sell your position AND THEN START 3 POSITIONS IN THE SAME SECTOR!!! Sold ERX expecti g this, then bought BCEI, LGCY, & CLD that same day. :-/ Not too smart of me. Stupid mistake #2: thought AKS, VALE, CENX, CLF would correct for same reasons as energy. SO don’t sell Aks expecting a move down and then buy SID the same day!!! You gotta laugh about it, but if this was a business, and you made silly mistakes like that that cost money, you’d be out of a job. FCX was a trade that reversed, and there’s nothing wrong with that. Miners are o/bought as well in the lower frames, but they didn’t look as much the other day, so kept EXK & KGC. Always a learning experience this *trading/speculating* thing.
TGIF….
You can lose money in Business IF you are in the government! I did similar stupid trades. I was in cash watching energy stocks go up day after day. I then bought LGCY and BCEI. Very next day corrections started. It was late in the cycle, I have to be more patient. I knew it was coming, but couldn’t wait.
Timing of individual stocks can often be tricky.
Tell that to EMES , GBR, CJES, and NADL , right?
Look at that EMES – WOW
Wow, thats hyperbolic! What’s up with that one?
So crude is down below $50 and NADL is up 25%. Have we just entered some sort of weird alternate reality?
Possible Cup/Handle on HBM ( or mini flag if you prefer). 3 month chart
Still holding
$USD up, GOLD up , Silver UP : )
Hmmm, has oil corrected enough yet? My buys this morning are beginning to look awful!
No, I don’t think so. But WPX comes down anymore, I’m picking it up for sure. Same with OAS. I had bIg wind with both of those on this last leg up!
CF, how does oil look to you? Thanks:)
Oil can drop into a DCL here, and it could either go sideways or drop to $46
SPY avoiding a shooting star weekly by the skin of its teeth. ERX- Would be nice buy here, but that is one ugly weekly candle as well, so we’ll leave that alone. I know I mentioned earlier that GDXJ has what looks like a megaphone pattern building, but if you look at Jnug, you could make a case for an inverse h&s building, which is actually what gold and silver are showing as possibly building. EXK & KGC, for example, look like they might be in the process of building that inverse h&s also. All in all, I kissed most of my positions good bye. Kept only KGC & EXK. If they come back to build those patterns I will be adding. Weekly shows negative divergences, so just time to be cautious IMO. I’m gonna post the sells I did today and why, just to see if we see the same things…. 🙂
CENX – sold because it broke back below 100 sma, which has acted as support. I thought the 100 would catch any fall, but no do. Gone until we break back above.
ERX- Still above 50sma, near the 20sma, so technically still on a buy signal. But ERY is really looking like a failed b/down, so staying away form ERX.
VALE- Back below 50 sma, near 20, (which btw, is below the 50, not good).
The 100 sma is still below $4.
Kicking myself for not having obeyed and sold these yesterday: CENX & VALE. Those ma breaks came yesterday, but I was *hoping* for a bounce.
SID- VICIOUS… see what I did there??
Where to begin with this one. Rotated out of AKS into SID thinking it would hold up better if it were to correct, since it hadn’t run as far. After 2 days:
SID…. -20%
AKS… -8%
TALK ABOUT BEING WRONG!
A couple of these also closed the week with RSI back below 50. Forgot to mention DDD. sold in the break of uptrend line.
And sorry if you think me posting all this is a pain in the @$$…, but I think it helps to hear and offer different opinions about these things. It might help with our development as traders, speculators, or investors.
No not at all Peter… Remember when you said we have to make the same mistake 5 or 6 times? My short term trader thinking is constantly at odds with my long term investor mentality. And I have found that it is much harder knowing when to pull the trigger, especially on a day like today – which wiped out all the gains I made this week and then some……
I was proud of myself earlier in the week for being disciplined and having stops in place. This morning as my stops were all executing at the market’s open, I couldn’t help but feel that larger forces were in play. If one of those stocks had sold at any other time other than a Fed Friday, I would have felt differently.
That’s why I posted a couple days ago about how to play these days leading up the Fed meeting. So many times in the past I have been shaken out of some of my longs on fear, only to see them run back up in the days after the announcement.
That said, I was not looking at today’s drops in the context of moving averages– and I appreciate your objective logic.
My decisions to hold are so much more subjective and there is also a good amount of stubbornness in thinking “I”ll be damned if I am going to let “them” shake me out.
You are probably the wiser ……
(And so , don’t feel bad about posting too much, as I just took up a lot of space here too 🙂 have a great weekend
Same here, 3 weeks ago in the big CLF slam of 2016, I lost like 5 positions in 1 day. That marked a near term low. But most of them (except HBM) haven’t done much sense OR gave it back enough by today that I have a new opportunity. Stay flexible and we’ll all have more chances coming up!
Thank you Crystal. Trust me, I’m not any wiser than anyone here! My 9 year old is the wise one in my house. She knows already that she wants nothing to do with stocks or charts!!! But it does help to see anothers point of view, which is my intention, especially for newer investors that immediately jump in both feet (like I did), wanting to trade the shortest timeframe, etc… I’ve learned the hard way that there is not one single system that you can follow that is 100% accurate. It does not exist. If you can follow a system that has 70-80% accuracy, you will be rich! Having the discipline to stick with that system, THAT’S THE TOUGH PART! If you follow daily charts, something will happen where you say “wish I would’ve exited sooner”, and so you try to see what happenned in a lower tf, and you see it. And so you now fall in love with the hourly chart, and think that’s the way to go. Until something happens in the hourly, and again you look to a shorter tf, now the 30 minute, and boom, you fall in love with the 30 m. All timeframes have their merits, but at the end of the day, it is a game of how many moves you make. Like I was told, the more moves you make, the more you play into their hand. I don’t know why that is so hard for me to understand!!!! I think Tony Robbins would call it mixed associations… i was doing phenomenal this week, until I decided to buy BCEI, IPI, LGCY, CLD, and ESPECIALLY… SID-vicious… but I did manage to salvage the week fairly well still… Crystal, have a beautiful DC weekend…!!!!! 😉
If I knew knew what I knew now….(lyrical voice with Alex’s band rocking in the background)
I made the same mistake 10 times. Is that OK or too much?
Here is what I have discovered: the trades that make insane moves in a day or two mess with your mind. Once they start moving, it’s hard to think straight. Greed takes over, and just as I am about to let go and bag the gains… I will look at a much longer chart and I think “if I hold and this goes back to those old highs, I can retire rich”. And somehow you don’t pull the trigger at the right time and you end up in the red.
But rather than stop,
you are addicted — you can’t wait for the next chance to experience the rush of making those kinds of gains again — another chance to play it right.
… get a catsuit girlfriend…
i always wear mine when trading….
#Facts
Did I ever tell you about my latex allergy? What I really want is one of these: https://uploads.disquscdn.com/images/9efa41b3f12e6c69719c367fb7241732c4a4b47a751675a885e4faff7bd66d7f.jpg
Thats where you have to decide on a “system” for yourself Crystal. The more attention you pay to shorter term charts, the more you will be shaken off the trend. But the shorter frames also will be right at times and take you earlier out of a stock ready to trend lower. It all goes back to finding a spot in the chart to come in at, as precise as possible, and a spot in the chart at which you exit with a profit. If you buy X at the 50 sma, at $10, and goes to $15, with rsi 14 o/bought ans macd diverging, I would take my profits. Could it go to $20? Of course, because nothing in TA is 100%, but if you look at 100 charts with the same feature, i’d say a very high % will correct plenty.
Ok so VALE right now is very typical of a dilemma I often face — I am down about 4% ($22 as I have 100 shares ) exactly the drop it made today (I had a loose stop)
I see a gap there at 4:15 – it could go there and fill and move back up… But that’s another 5% – which would put me at a 10% loss and no guarantees of a bounce – if I put a stop just below the gap.
The MACD seems to be rising on the 1 year chart…. And I also see the possibility of this going back up to 5.72
I overthink this to the point where I am not sure…..
No need to answer this soon.. Spend time with your family..
This chart isn’t going anywhere for a few days
I see the 200sma around $4 and that gap too. If the stock is healthy , it shoudnt break down below the $4 area, but that is a bigger loss than you anticipated from the start. Tough choice.
One more piece that I forgot… I should have “it’s up to you to do fundamental” analysis tattooed inside my forearm. I need to be more disciplined about each trade and have a plan – and stick to it.
So this weekend I am going to read the last ER of Vale, and maybe a few others. If I find something substantive, I’ll post it. 🙂
I like this. I’ll try to watch when I am done this project and can be home more. My real life is interfering with my gambling! [oops…I for sure meant I N V E S T I N G]
And now you are out of school and in grave danger of being an addict!!! LOL
I have that stubborn streak too. I really don’t trust the trading powers that be as I have seen too often the sweep down to grab those stops and then right back up. You can feel them laughing at you! And also share the short versus long term hold views…I am trying to learn where I fit. I am usually more patient and willing to ride some rolly polly coasters…but I need to learn HOW to check the quality of a company better. Also…I am learning I don’t like stocks that only trade small quantities of shares. They seem to get pushed around more and are boring. Also I get really annoyed when they are trading in teeny fractions of a cent…and I can’t…it is so unfair. OK. That’s my tirade for tonight!
One thing I’d like to add , just to encourage you and the gang here…. sometimes it can turn out to be the wrong choice in hindsight ( Like when we look back and say, “I should have sold at $5.50, now it’s at $4.80″), but that doesnt mean you made a mistake in trading. That stock may not have given any signs of being overbought or ready to sell. It could have gone higher. It may have just had a normal correction.
That doesnt always mean that the owner of that position has made a mistake, unless there goal is to sell the exact top every time. Look at a 6 month chart of VALE. If you bought it in January and never sold it, you are doing fine, but if ‘peaked’ at $6+ in April and is now $4.50, was it a mistake not to sell at $6? No, not a mistake – it was still in an uptrend of higher lows higher highs. The stock is volatile but could have continued higher. if the Stock hits $20 next yr and you look back, could one really have sold each peak and bought each low? THAT is next to impossible.
So not every opportunity to lock in a better gain is a mistake, but it can be a mistake to go against your original plan to ‘ sell if it drops here”. Ignoring stops and buying tops can be a huge mistake.
Excellent comment! I just read this AFTER i commented further up about no right or wrong.
Sometimes this is the best way to ‘sort things out’ or learn. Others will probably benefit too.
Man, sucks on SID, almost chased that bad boy earlier this week, glad I didn’t. You were right about GDXJ. I could have made more selling this morning, but I avoided a drawdown. 🙂 I’m not playing Aluminium, I’m still pissed off at Alcoa. Holding a grudge here!
C-man, you crack me up man…. I’m still laughing at your BCEI comment from last nights email.
Don’t make me post another CJES chart. Except this time it’s IPI!
GGGRRR IPI! While I’m at it…GGGRRR DNN, SN, FCX. Not a fun greeting when I got home today.
No kidding. While I can’t get in CF from work (access issue) I actively follow Yahoo for portfolio and chart as needed (but not often enough!). Remember Tues that everything was up!! 🙂
Yeah, I’m pretty freakin’ hilarious. Like Maria.
GGGGRRRR SID.
I am a rookie chartist– but would appreciate thoughts — I still have VALE — if I use the 200sma — which it seems to follow very closely, could it still be considered okay and ready for a bounce? If it falls lower I am going to sell 🙂 https://uploads.disquscdn.com/images/89dce2e8f6429acf06e05d1531e960a1c9aadfb50dd8d0a4484ca69de0d24593.jpg
If you’re still in and its on the 200, I think you’re ok but stuck with your plan. If it doesn’t recover, walk with gains you still have. 🙂
What’s really really hard for me is the ‘stop or add’ question. It goes to support so do I add or does that cause me to stop with double a position in just a few more cents. Oh! Always struggle with that. For example, if we have selling in CLF next week get cheaper shares or take money off the table while I still have big profits?!?!
If you have an epiphany on that one, let us know!
If I think a stock looks good, ready to trend higher, I’ll buy it at a mov av. I did that with EXK, AUY, GDXJ, and KGC at the 50 sma. AUMN at the 200 sma. The longer the ma, the better, IMO. If I think a stock is ready to trend lower, or like CENX and others today, I’ll stay away until it clarifies. I use CCI, available in stockcharts, set to 50 and 100 in the daily to confirm. It has shakeouts, but so does everything else!!
I’ll look at it a little later Crystal… 😉
It does well above the 200…let’s have a bounce please! A BIG one!
This must not be a daily chart, right? I have the 200sma at $4 for the daily and an open gap right above that, so that gap may fill too.
Right now I see the chart as ok, but there is the ‘possibility’ of a H&S forming. It looks a bit more bullish than not right now, the MACD is holding a recent cross over, etc
It’s the daily on a 1 year time frame— as I would like to have a bigger perspective on thie recent move. I just use charting available with Fidelity — maybe stock charts is more accurate?
Hi Crystal!!! I was looking at the VALE chart, and like Alex, I show the 200 sma @3.97. Don’t know why your chart shows it @4.35… Starting with the weekly view: it tried breaking out of its weekly downtrend, and was rejected back below the 10 week ma (50 day sma), on large volume. It is still above all major ma’s, and rsi is still above 50, so those are still positive. The next ma that could lend some support is the 250 sma, at around 4.14. Below that, the other ma’s come together below $4. I had sold 2/3 at the high of this move because if you look at the 1 or 2 hr chart, you’ll see that price came up to the confluence of 2 resistance lines. I kept only 1/3, but ADDED on thursdays big hit. Finally, I closed VALE altogether friday because it went back below the 50, rsi in daily broke below 50, and the weekly concerns I said above also. Granted, daily macd is still positive, but getting rejected right at zero line. If it goes higher from here, it has to go back through the 50 sma. The 1 hr or 2 hr chart will show improvement, then i’d come back in. The wild card in this whole thing is the dollar. Acc/dist line in the dollar has kept going higher, even with the jobs report smash.
Here is something I find very interesting, but not sure if it is a positive or negative thing
I was looking at this today
http://www.barchart.com/options/highvol
A number of the stocks we trade including Vale have high options volatility: most are high puts, (which I assume the stock is expected to fall by x time)
But with Vale — the volatility is in calls. I was thinking at looking at Vale’s options chart, but I would not trust my read on it since I have zero experience in trading options.
Good morning Mrs. C!!! I see VALE on the list, but those are selling of weekly calls for next week exp, so it really doesn’t clarify anything for us. But I hadn’t been in Barchart in years! Has a lot of good info. Do you see the support/resistance levels it has for stocks?? Nice surprise this sunday morning! I will be on barchart often now.
Futzing around on barcharts.. and discovered a “traders cheat sheet” tab. It shows the current price at 4.41 — with a first level of support at 4.33 pivot point; 2nd level of support is at 4.26 pivot point.
First level of resistance is at 4.48
Have a great Sunday- this could easily suck up
a lot of time– time to enjoy the day!
I did see that Crystal. Very nice feature.
Have a great weekend everyone!!! Thank you Alex and all for all your input!!! We are blessed to be able to throw $$$ around at all these stocks waiting to go up or down. If you have money in an account, you are doing better than millions of people! Go have yourselves a good drink with family and friends, and enjoy life. 😉 Bless you all.
I’ll be having a drink alright! Buying IPI and URRE you have to be drinking!
You’re hysterical big man…
IPI….GRRRR!
Good advice! You too!
Lesson for today: don’t hold URRE. Sell immediately when you have profits. D’oh! 200 is too far away!! Ahhh….
That was a good thread that went on last night. Usually I don’t have time to read through them.
Just so everyone knows and understands…. I have booked many losses and many gains the past several weeks too. I had a small losing streak recently with commodities and some energy . They did great after my entry (Gains, but I held them to a loss too). The key really is, cut your losses to preserve capitol, and then make sure you have a proper ‘low risk’ entry on Good set ups, the gains can out do the losses.
For example LGCY entry at $1 – that still isnt a loss, and I sold most in the $3’s. Then I tried to re-enter this week and am holding mild losses on that entry, but I still hold with it pinching the 50sma and 200sma. IPI near $1.07 – Still fine , sold most higher and am about to add again, URRE in at $1.75 – sold most higher, still holding some, but I had losses in some attempted re-entries and other energy stocks.
I bought MINERS like MUX, GSS, TGD, added to RIC core,etc 2 weeks ago, great gains on those, I tried to add to positions this week, now I have some losses on those new entries, so it’s a mixed bag.
Keep the losses small. because ……………… there is always another trade! A better one is coming with time.
Hey Alex, In case you missed my question earlier, I asked about the Fed announcing policy this week. Do you know the day? What’s the best game plan for your subscribers, as anything from them seems to be magnified in the markets? Thank you!
Fed release is Wednesaday ( Its in the weekend report) . I think most of what they say & do will be ‘baked into the cake’ already, because Janet spoke when the low jobs report was released.
don’t know why you think miners are a good buy, there is negative divergence on the daily charts
Alex, the more I study this, and I mean study more than just charts, I realize that there really is no right or wrong, or only 1 way of making money in risk markets. You follow cycles, basing patterns, etc… I like longer term trends focusing on ma’s, momentum, etc.. Some people preach diversification. I have a friend whom I’ve mentioned before, that has his entire portfolio in miners, and has had it like that since 2001. The man says that trading is for suckers, that the only way to make huge money is by riding a bull ’till the end. Can I argue with him?? The man is worth about 50 million. His portfolio, when he last showed me in 2008, was 22 mill. All in miners, and nothing else. Did not sell the ’11 top, and rode his miners all the way down again, but still he holds because he *knows* the bull in gold is far from done. That was his personal challenge,, to ride a secular bull from start to finish. Another friend of ours has his entire portfolio, close to 1 mill, in one stock! 1 STOCK ONLY, KGC. So again, there is not 1 right way of soing this. There are many ways. My friend with Kinross has had it from early ’02. Rode it all the wa up, and all the way down. Is he right or wrong? If it goes to $50, he’ll be right, even if it takes him an eternity. Of course, we have tried studying this from a perspective that makes more sense. What if we could buy and sell at intervals, so that we lock in gains, and minimize the chance of riding gains all the way back, or worse. Thats where we put in the time and effort into the study of charts (price behaviour), to see that clear patterns are present in all timeframes, that give you signals of *odds increasing* of a move in one direction or another. Sometimes we get fooled, no matter what system you study, yours, mine, Druckenmiller’s, Buffett, etc…. the only thing we control is the buy and sell order, THATS IT! What happens after that is totally uncontrallable. I have learned, and I assume so have you, that the longer the time frame, or indicator, the more reliable the signal. A break of the 200 sma, is a lot more reliable than a break of the 20 sma. So if the point of all this is to protect your investment, and make money on it, it would make sense to use information that gives you higher odds of success, no? For me, thats where sometimes I am at odds with your trading style, because you have no problem buying a stock thats basing and below all ma’s. Where to me, that would be untouchable. But again, there is no right or wrong. You pick a spot in the chart that offers a low risk entry, and you exit at some other point, hopefully with a profit. You can do exactly the same by followig a break of the 100 sma, for example. Buy if it breaks above, sell if it falls below. Thats oversimplifying it, but it can be done for a profit. You wanna better your returns, mix other indicators with that, and you’ll so even better. But the.point of these conversations, and I wished more of the professionals that subscribe here with you would offer advice and opinions regularly, is that it really helps (i think) others understand the nature of TA. Again, there is not 1 single system that works over everything else. Not one that is foolproof and prone to losses. Accept the fact that what we’re trying to do as speculators is to hypothesize where the smart money is moving, and we just need to be like remora fish. We move with the shark, and as long as we’re on the side of that shark, odds are no other shark is gonna eat us. Human emotion is what gets us in trouble…. Big Al, have a great weekend boss man! Great to be here learning your view of things…. 😉