
April 7, 2016 – Signs Of Strength
Signs of strength are popping up everywhere…
.
April 4th – I’ve been expecting a dip down to a dcl.
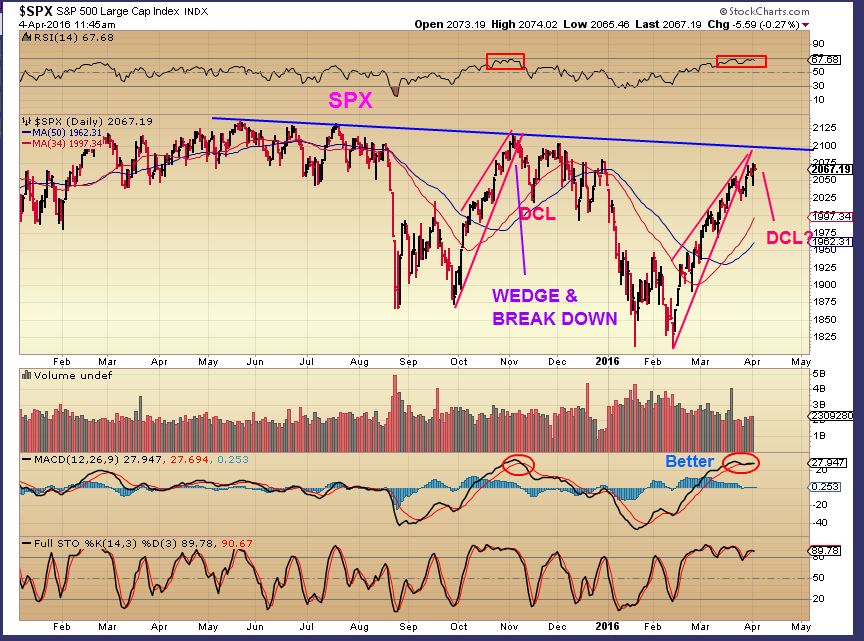
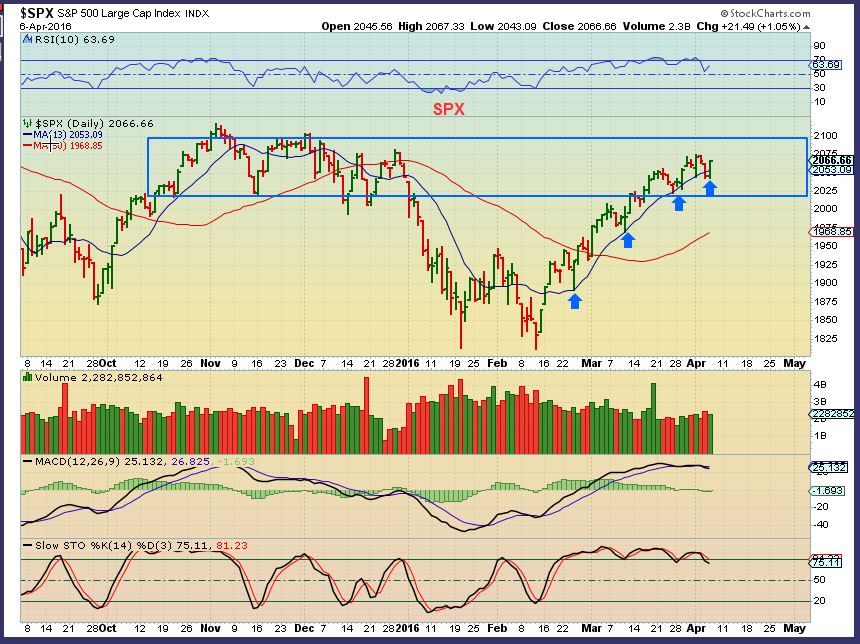
We had the Fed Minutes released today and the SPX ( or markets in general ) is NOT breaking down. These markets are not breaking down at the 13 sma, and they look like they still want higher prices. Is this just going to go sideways as a consolidation?
Consider this too…
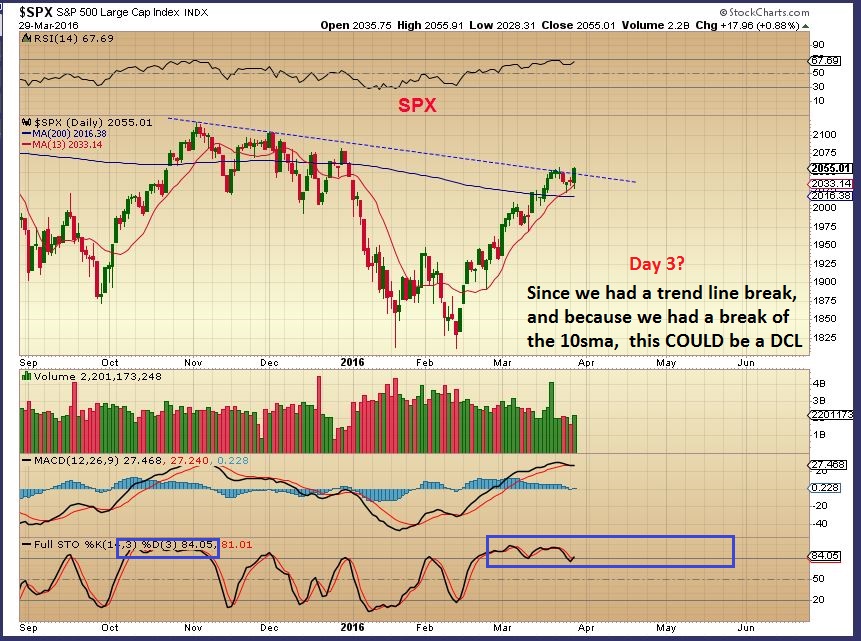
You may recall : A while back I said that for a couple of reasons , I suspected that march 27th could be a DCL. I said that due to a few indicators that I use that indicate where a DCL could be. Well, it seemed too early and too shallow , so I wanted to continue to be cautious and wait for a deeper dip. THAT MAY NOT HAPPEN. MARCH 27 could be the DCL, and this market remains strong.
EDIT: I awoke to futures down, but each morning sell off has been bought and the markets keep closing green, so I am still thinking that we could be on day 9
.
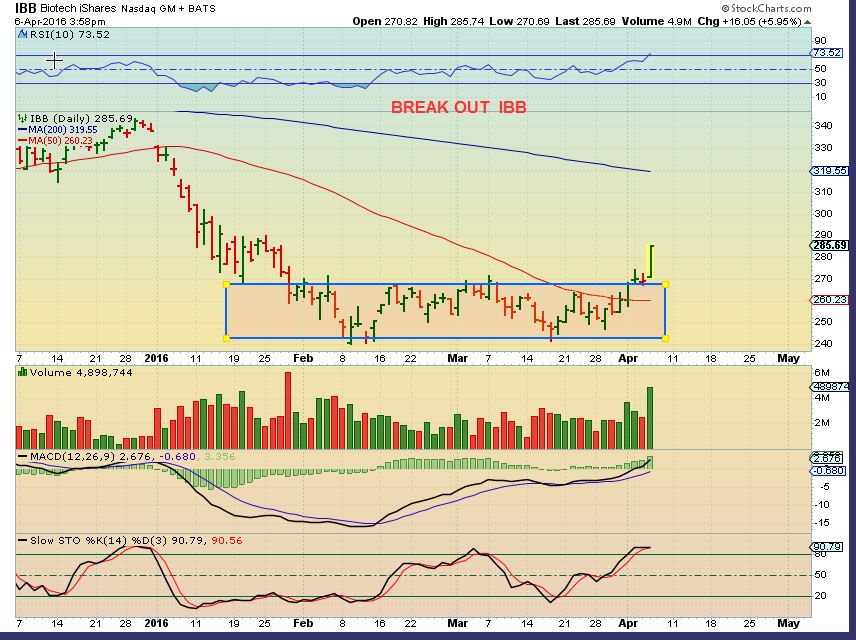
We have been discussing / anticipating the break out from this base in Biotech. IBB, XBI, etc . What a nice break out today, a Real Sign Of Strength!
.
WTIC – This was Tuesday with a reversal. We have been stalking a DCL in OIL for many many days. A day 25 high makes it likely that this will be Right translated (R.T.) . So we should run to new highs from the daily cycle low.
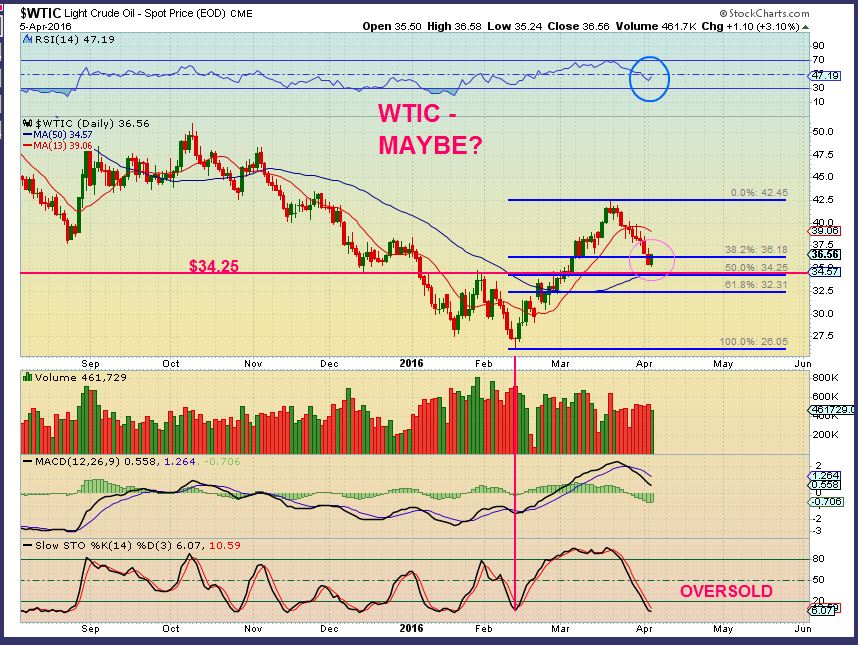
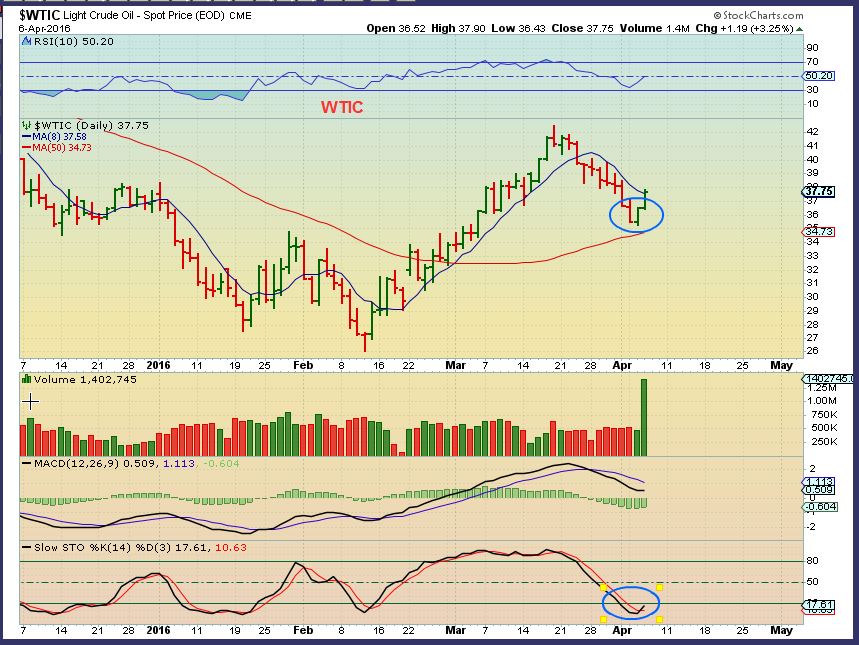
We have a swing low , and I believe we have our DCL in place. The follow through was a nice sign of strength. Very R.T. – Energy stocks are looking good again and the last time they ran, the gains were HUGE. More on that later. OIL IS A BUY ( USO, UCO, ETC). The volume was high, but it was only 700,000 – ignore that spike.
.
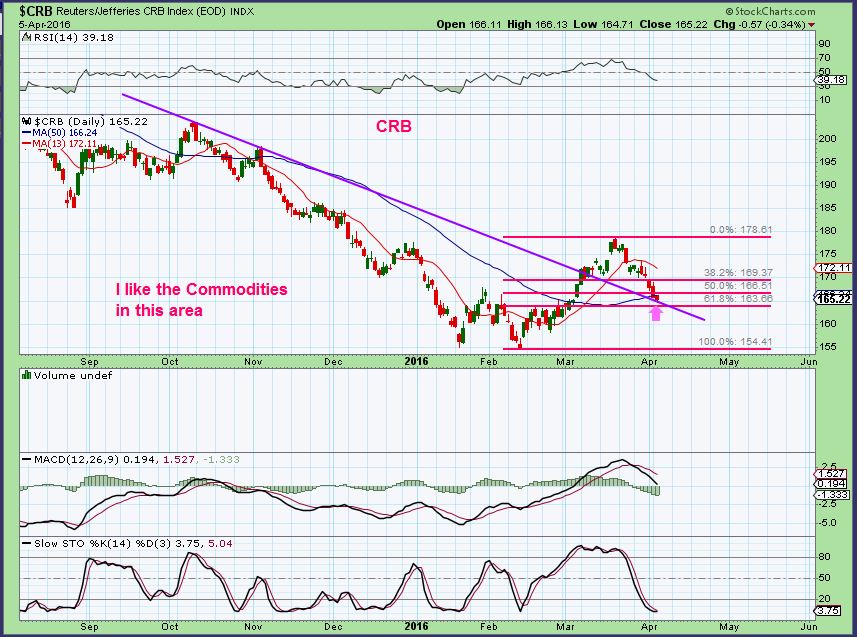
CRB – I’ve been watching the CRB for a DCL too. It is deep in its time to find a low. This was Tuesday, April 5.
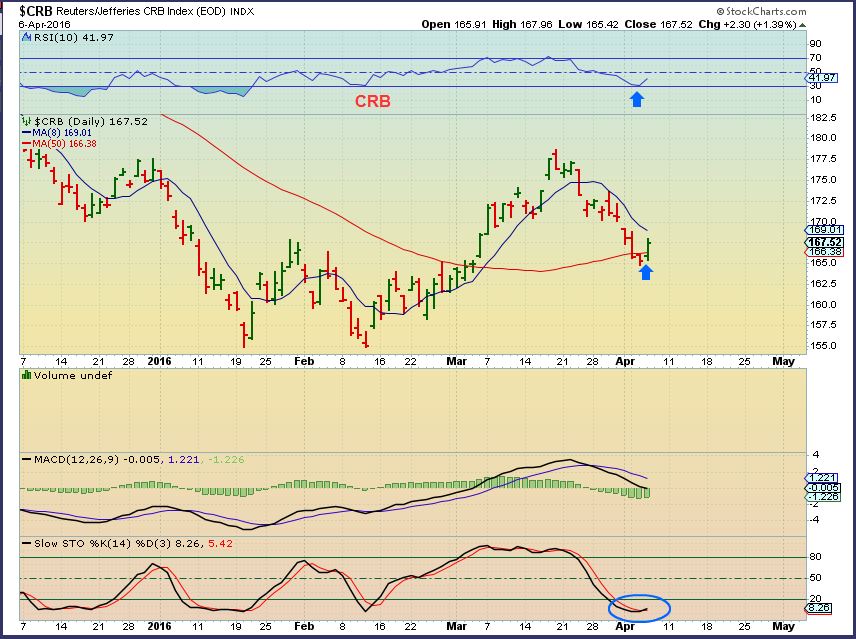
CRB – April 6th, A SIGN OF STRENGTH 🙂 This is a swing in place too and cycle-wise this is also R.T. (Bullish). That could be a shake out at the 50sma, to lose the weak hands.
.
GOLD – Speaking of Signs Of Strength, this is also holding up very well. If EVERYTHING is looking so Bullish, we may want to keep our eyes on Gold too. I expect a deeper drop, but as mentioned in yesterdays report, some Miners are set up in a high consolidation that is very bullish looking. They are showing a sign of strength too, by not selling off.
Notice the 50sma has held. If the overhead trend line breaks, I have to think that this can run higher. EDIT: I woke up to Gold at $1240 
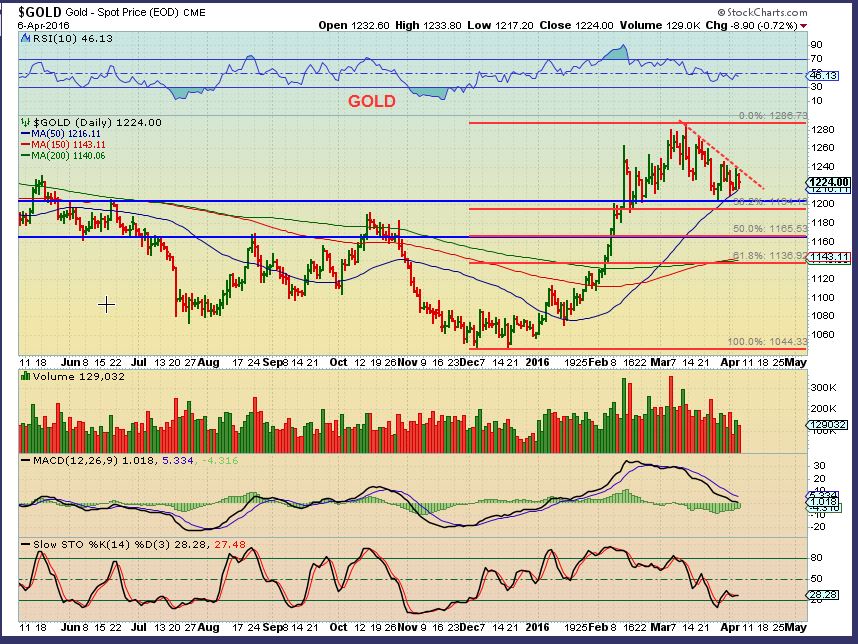
I want to remain patient in the GOLD , SILVER, MINERS area. I still have to expect a deeper drop into a DCL, but that doesnt mean that the Miners will drop. Some are just consolidating here. For now I am focusing on that red trend line overhead on Gold in the above chart.
.
Conclusion: We are seeing Signs Of Strength almost everywhere after a good healthy sell off in many sectors. It seems to be the clearest in The Biotechs, Energy and the CRB. I believe we are seeing the pullbacks and consolidations of our first run up in OIL/ Energy and the CRB come to an end. That first run higher gave us some great gains in Energy and Commodity stocks. It could be time for round 2. Also the Biotech sector is catching fire, I’ll discuss that a little too.
( For the sake of time, I want to release this report at 7 a.m. Eastern, but I also want to add some more charts. I cannot send a separate email alert for the same report, so please check back in a while and I will have added some more charts below. I will also write in the COMMENTS below this report – saying when I am finished. )
~ALEX
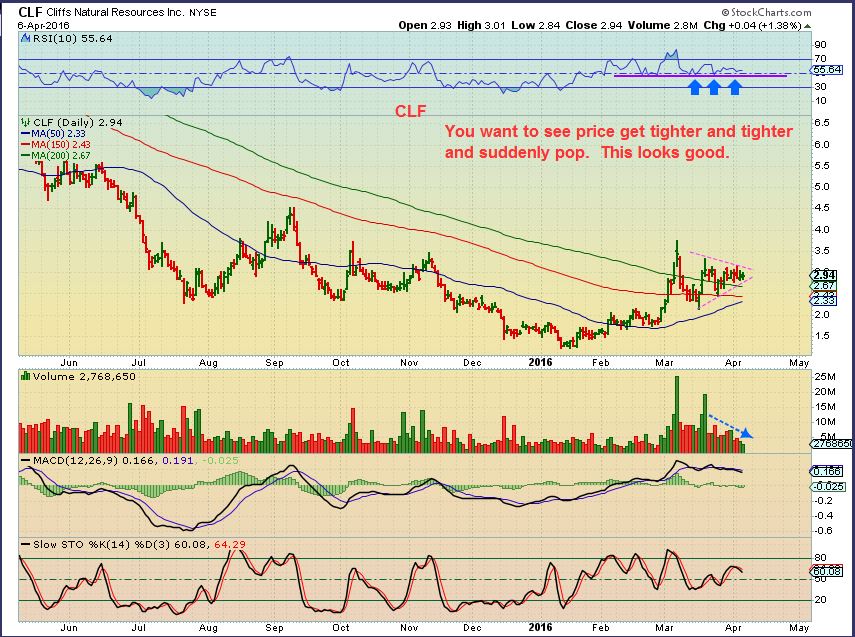
I have already pointed out many of the commodities endlessly as they pulled back, so to save time, I will just show CLF right now.
–
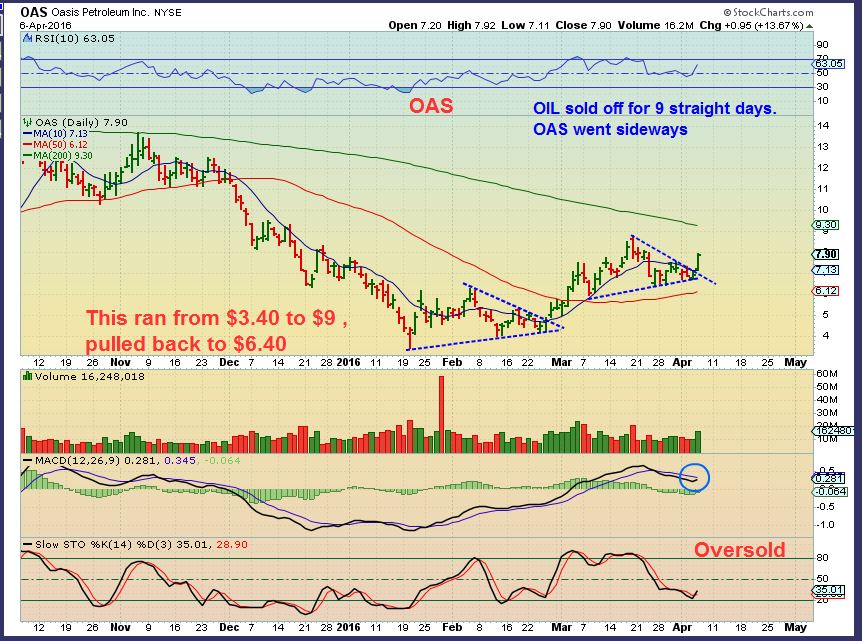
I wanted to post some of the set ups in ENERGY STOCKS. As you look at these charts, think to yourself OIL just sold off for 9 days in a row. Do I see signs of strength here? I am showing charts using technical analysis that are properly setting up. If you are concerned about fundamentals, do some additional research. I trade based on charts, keep positions reasonable, and spread them out into a basket. These performed excellently on the last run, when their fundamentals and future hopes were probably ugly.
.
OAS – OAS ran up almost 170%. On the pull back it remains over 100% off of its lows. Yes it is up 13% yesterday, but it could run right to the 200sma and even break out higher if OIL goes above $40 again.
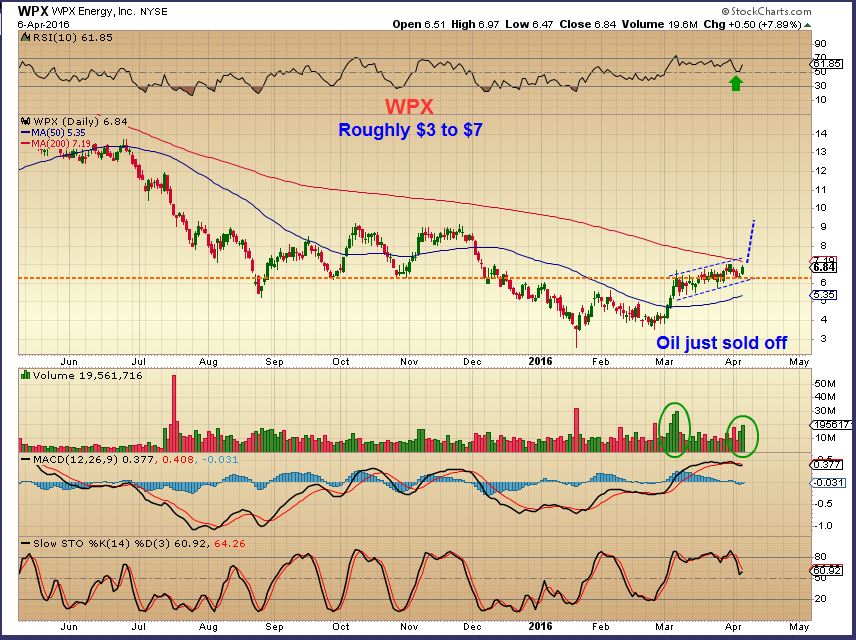
WPX – This correction is running uphill. Higher lows.
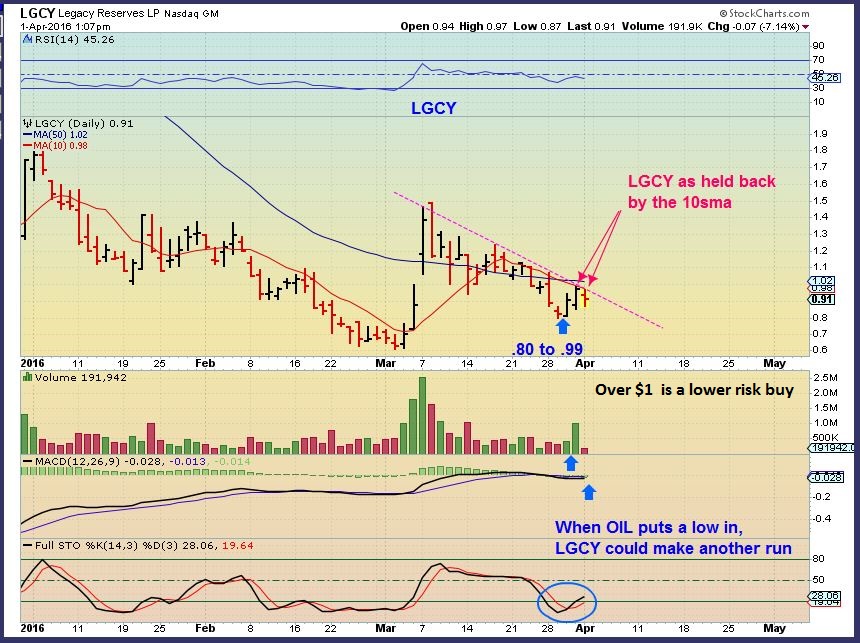
LGCY – I wanted to point this out on April 1st, but didn’t post it because I thought that it might be too soon and people would jump in early. I have been watching for a trend line break , and yesterday we got one.
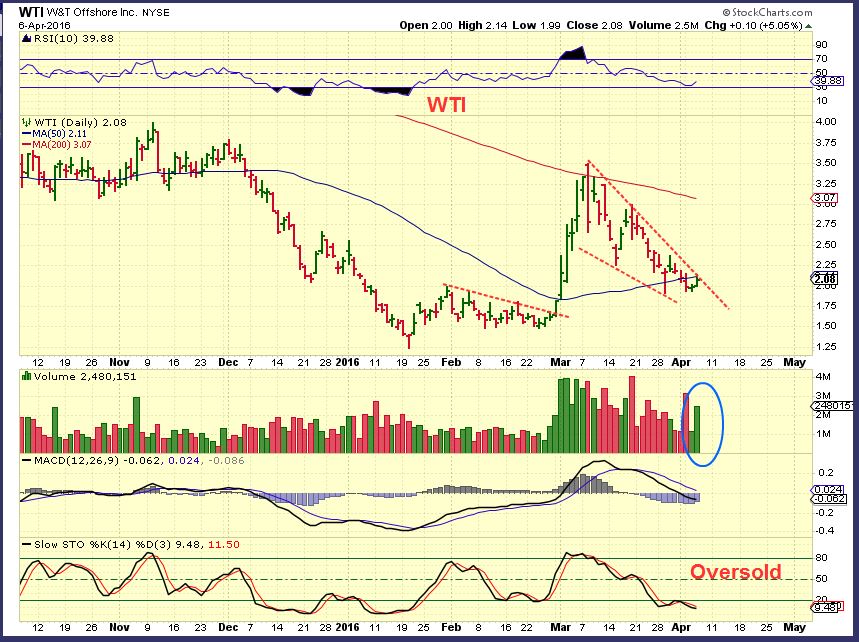
WTI – Quite a run at the end of February ( Short cover?).
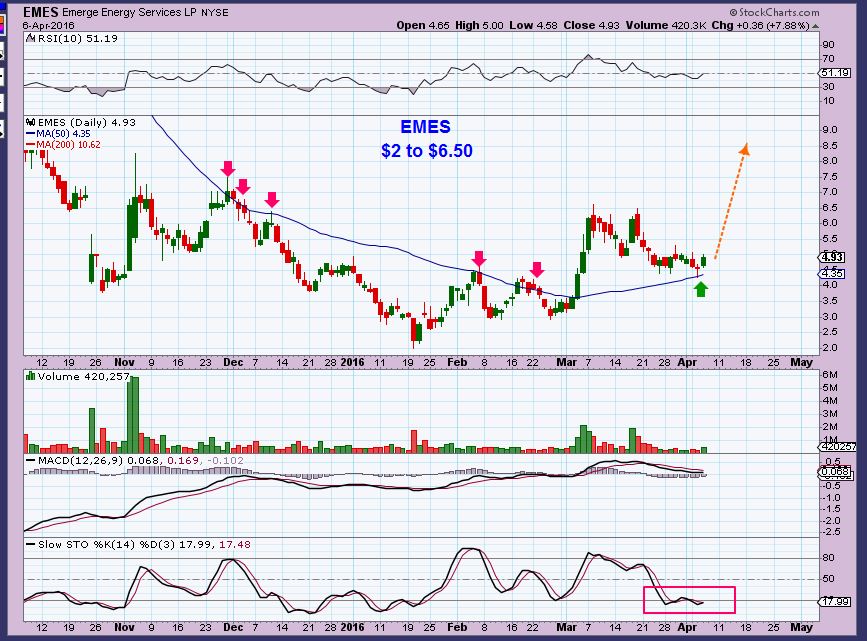
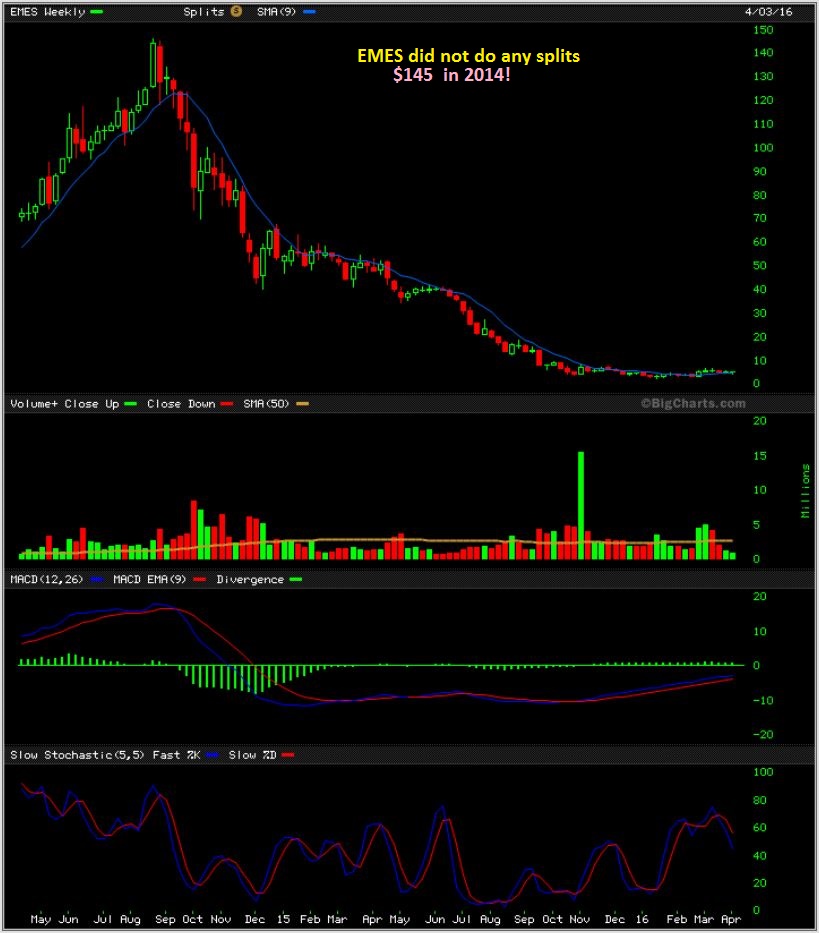
EMES – I want to show you this base. We saw a 200% + run, and a pull back to the 50 sma.
EMES WKLY – Now check out how that move looks in the big picture. THAT was a 200% move? In time, if this company can pull it together and Oil moves higher, the gains could be great. “IF” 🙂
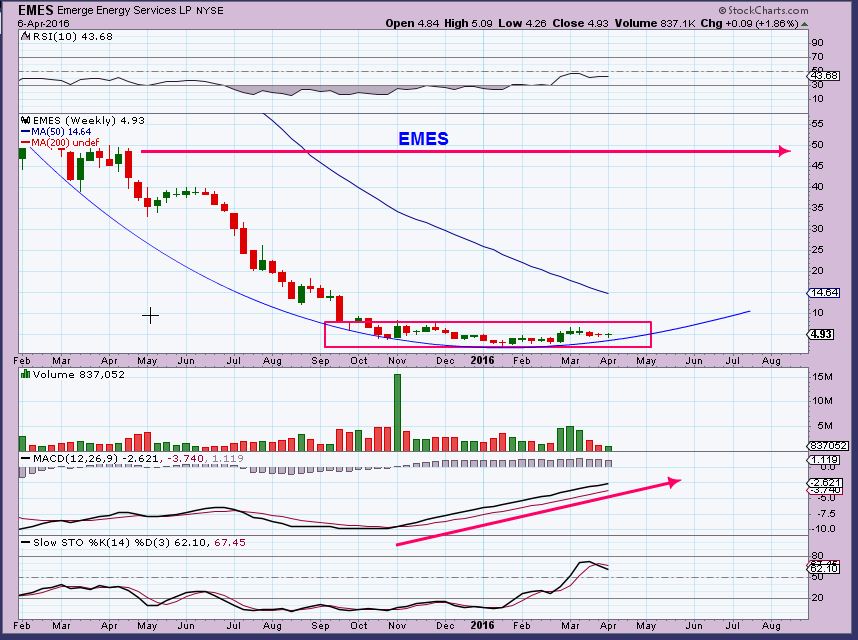
EMES from 2014. So , this is a FUEL PROCESSING COMPANY. They were involved in ‘sand’ and ‘fuel’ processing, so sort of a duel operation. They Mined and produced silica sand for fracking, so you can understand why their business slowed right down. This company must have had some serious business losses to drop this much, but it has been forming a base now. They expect a recovery, but of course they’ll say that. I am watching this one .
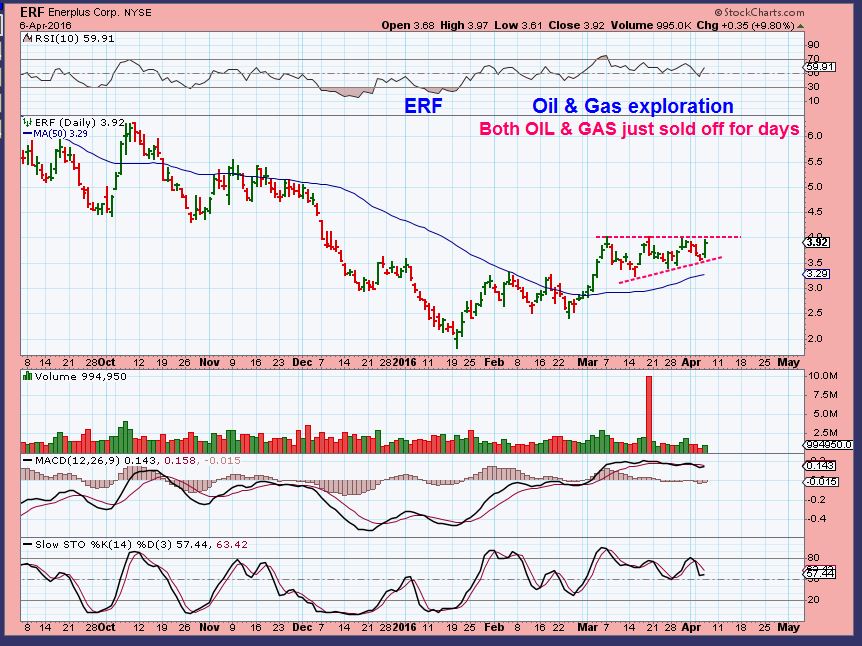
ERF – NICE CHART SET UP. Solid consolidation.
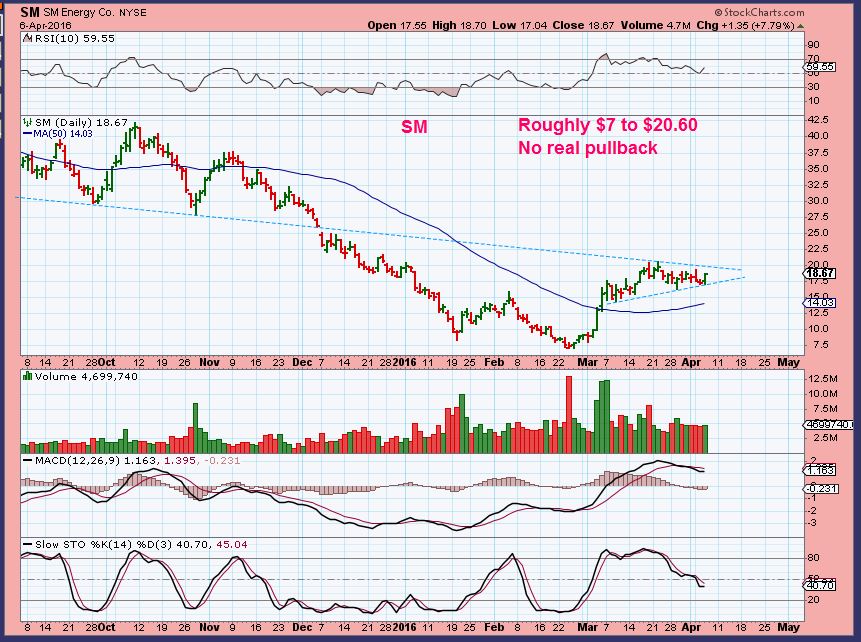
SM – Solid consolidation.
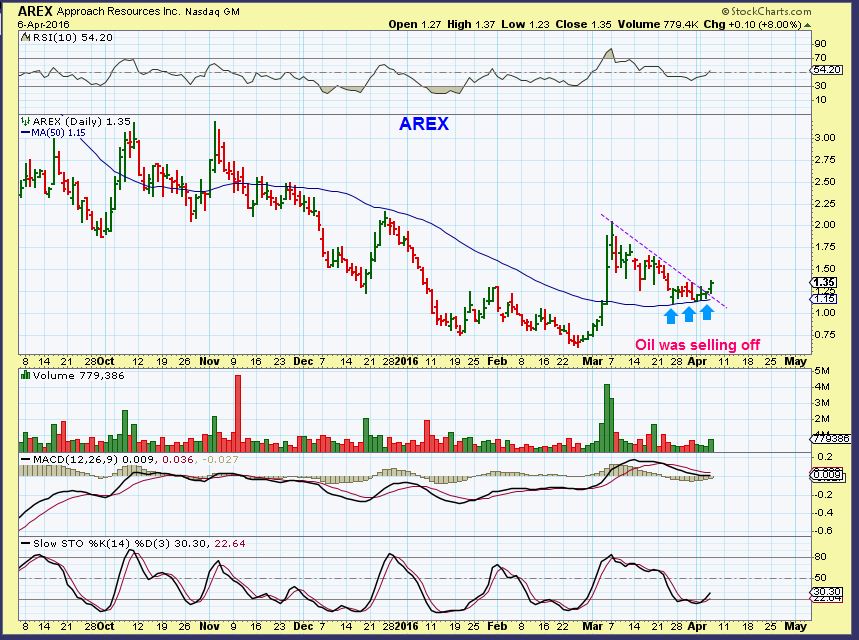
AREX – Some of the cheaper juniors are showing signs of life
SYRG –
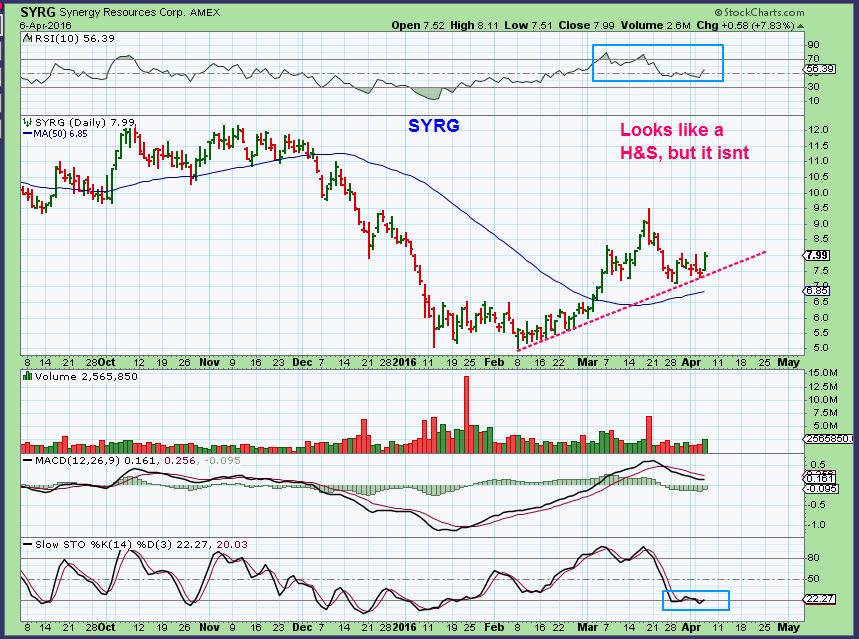
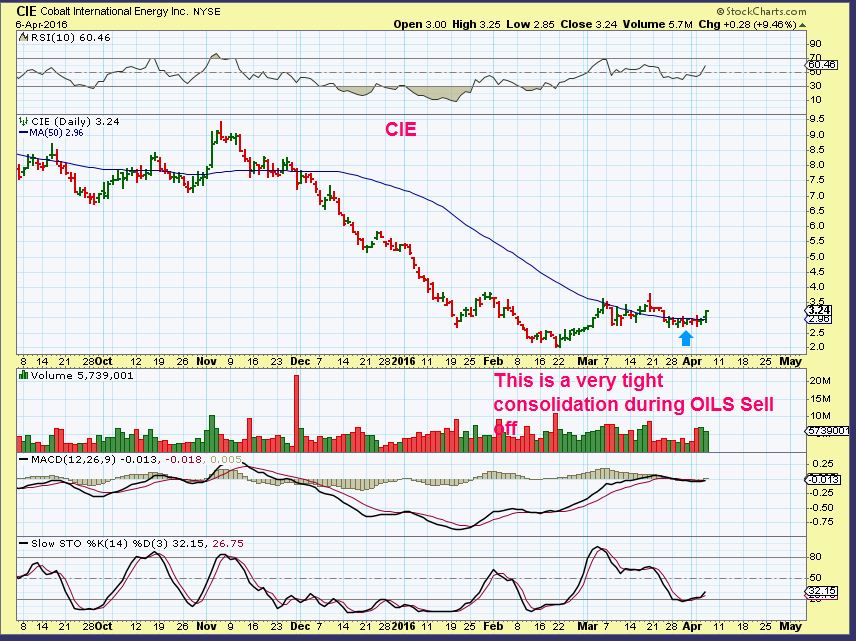
CIE – A really tight consolidation can become explosive when they break higher.


13 charts have been added to the end of the report since 7 a.m. Eastern. Have a great day!
Alex, really like the summary at the end, man. Sometimes I got overwhelmed with all of the possibilites, esp when entire sectors (or multiple sectors) firm up together. Really broke it down simple and clear for us, thanks.
Thx Cason, I know that it does get overwhelming when 20 great looking set ups are presented. Many want to know which one is best, but that often remains to be seen .
Like RPTP in biotech yesterday – I liked the set up and it was a tight consolidation, but you cant tell if its really going to POP or not .
I do like the really tight patterns though when they consolidate sideways.
And, its changes after the market opens. One pick goes up 4% one down 4% which do you pick? The one moving higher or the one on sale?
Right –
Personally , they both still may be good. The one pulling back may just drop on light profit taking ( IBB today seems to be back testing the break out), but the one moving higher may be showing strength or further upside, as long as its not over extended.
I do tend to buy the pull backs , if they are dropping to a support area.
I usually go with the sale unless something appears out of place.
Brick wall on s&p at 2080 that’s going to decide if we go down to correct again or new bull run. Watching closely we very near
Great thanks, CF!…. PS remember Janet speaks again today …. With all the other former Fed chairs… The afternoon will be telling 🙂
Yes, Thx for the reminder Ms C.
She is getting a lot of attention lately, isn’t she . They have become fairly transparent. I think most of the news is baked into this cake at this point. Just a few wiggles from here possibly.
I remember when Greenspan would come out mid day and surprise the markets out of the blue with a rate hike.
Would not be surprised if she says something really attention getting – “crystal” 🙂
http://www.wsj.com/articles/feds-yellen-says-gradual-rate-rises-still-the-most-likely-path-1460071201
Check out AAU – Gold Miner
wow…35% up … what is going on the minor space? seeing lot of strength. Cannot find reasonable pullback .. job report/fomc. Can we get any chance to get in?
It was one of my worst performers.. not anymore
wow…..I see ….what a rocket. what happened?
CF picking up xon maybe some clf while it is not taking off yet
GDX breaking out? (Refresh)
.
If I was going to add or start a position, might as well wait to have a new high in.place against which to take the trade off, in case of a false breakout. But look at KGC (which I sold 2 days ago to cut back on miners a little, :-/). New high and has kept going, so if the others are to follow, could get interesting. AUY, EXK, looking real nice.
MRO trying to b/out above 1year down trendline. VRX trying to break out of base, with a massive air pocket up to near $70. I am out of words to describe what miners are doing. Kinross has been nuts!
Everytime I sell some miners to cut back risk, they pop higher!!!! :-/ Cason can’t be enjoying this!!!
Everytime recently.
When I look at KGC and AU for example, that is a stock acting correctly ( Despite Golds selling). reat base consolidations and then breaking out higher ..
These miners are being accumulated instead of profit taking and being re-bought in my opinion.
In that case, against better judgement to wait for a dcl in Gold, It doesnt seem like buying select miners is a bad idea in anticipation for the next run higher. IF YOU CAN TAKE A LITTLE DRAW-DOWN if that happens.
Quick survey shows SA and RIC at New 52-week highs today. Many others close.
Anybody take my lottery pick from Yesterday? AVLNF up 40% today.
I think there maybe a glitch in your quoting system? It’s up nicely, but “only” 10% today on TSX… Still holding some from months ago but dumped a lot at break-even several weeks ago after being bored :-(( (Win some…lose…a lot)
I have it closing Yesterday at $0.1235 and currently at $0.1727
hmmm…stockcharts has it closing at .1727 yesterday on my version.
I see it closing yesterday at .1727 also, on scottrade and stockcharts.
The .1235 looks like Tuesdays close on this chart.
Scottrade shows that from noon yesterday onward it never dipped below 15 cents, but Bill – 15 cents to 22 intraday today is still a winner : )
I see the problem. I don’t have any info for today’s pricing? Must not update intraday? I saw it was up 40% that was Yesterday. Anyway 0.1235 to 0.1727 is huge. refresh
LABD already very oversold, so I would expect a final move in XBI to between 60-62 to create a possible negative divergence now that everyone is bullish BIO’S. Would sell LABU into that area, if that is what happens.
SXE standing up…
Need some ENRT to go with that 😉
No, don’t do it!
Alex, I had been expecting a possible move up in miners also just to close the gap in jnug and nugt. We’re filling those today. So I would n’t go crazy chasing here. Safer entry on a breakout to new high with a stop if it breaks below previous high, a confirmed failed breakout. If we get a confirmed failed b/out, big money is gonna jump on the short side big time.
Do you ever use the 5,35,5 series for weekly MACD? Thats what Gerald Appel really suggests for weekly measure. The weekly macd histogram for KGC, for example, looks horrible to me. Very strong negative div. Just bring it up as an important point to whats happenning with miners today, for if anyone feels like chasing.
Not chasing, but this has been horribly frustrating that they refuse to pull back. So I’m going into energy for now, lower risk right here in my opinion.
I did the same thing.
…and me too.
but still,..gimmee a bottom anyday, when you know there’s seller exhaustion.
MEEEE tooo.
If I may mention something here, just to be helpful.
When you said, “The weekly macd histogram for KGC, for example, looks horrible to me.
Very strong negative div. Just bring it up as an important point to
whats happening with miners today”
.
When I see a sideways consolidation like Miners are doing, I like to see the MACD HIST drop to the zero line, I dont consider it divergence.
.
And price trumps all, of course. But when I see that, I try to go with a stock that I think that has the same upside potential, but without that chart feature like a neg div. A breakout above prior highs and I would add to my positions. Other option was to add on pullback (meaningful one), but we’re still waiting!
Check this out with AMZN. Those sideways consolidations can lead to nice moves, but they do get boring. The HIST dropped on these too. We could be seeing that in Miners now .
.
refresh
.
Great chart Alex! Again, price trumps all! The hardest thing to do in a bull mkt is hang on. As long as price is above those major ma’s, you *should* hold and let it ride. Easier said than done though. I have core miners that I dont touch also, so it’s all good.
Once things get further away from the lows, It’ll be easier to just buy and hold.
Some long term investors only want stocks above the 150, 200, 300 sma.
After the long bases from this summer, many are now way above those – maybe even too extended (ABX, NG , RIC, EXK, AG, etc for example) , so with some pull backs and consolidations, these uptrends could start working out a bit more smoothly. That will encourage more fund buying, etc. Longer term uptrends.
i always used to get mixed up with the different MACD/histo readings…
came to realise there are basically 6 permutations, depending on whether MACD and histo are above or below centre, and whether histo sloping up or down.
MACD above + histo above + histo up = really good
MACD below + histo below + histo down = really bad.
all other 4 positions come in between these extremes
You left out one of my favorites.
MACD below + HIST below + Both climbing at an accelerated rate = Miners off of the lows : )
See SA last Jan/ Feb and SA last July/ August
yeah, fair enough.. i was just referring to the established positions..
you’re the early bird contrarian who spots these potential set-ups.. that’s why we follow what you do 🙂
Oh, the established positions. yes- good to have healthier conditions after the initial run and consolidation for sure. At least keep that MACD above the zero line is encouraging.
and… i should say i wasnt just referring to the daily MACD.
i use the hourly mainly, for jumping in & out… and the daily for an overview
Added WPX, OAS, UCO
My patience is wearing out with CENX, CLF, VALE…
I know ( me too) , I hate prolonged sideways moves, but they are often very constructive when the break out comes.
The fact that patience is wearing thin ? That means the consolidation is working 🙂
I hope so!
Me too, I think that I may I have a number of readers ready to hang me : )
Sure, I’m bored with them too. But it’s not that bad!
CF……are you thinking a possible run to $1300 on gold when everyone is expecting a pullback to complete……then the real pullback comes?….you had mentioned some time ago that this small possibility was out there….if we don’t pull back in the next day or two I could see some shorts covering.
I did mention that, and I have had another thought kicking around too. I was going to put this thought into the weekend report with charts.
See if I can say this so it’s easy to follow with out charts here….Consider this, remembering that I use CYCLES TIMING to roughly time these events. I go from the ICL to peak ( 2-3 months) and then a drop to another ICL. That whole process may include 3 or 4 daily cycles of travel. It can be 4 to 6 months from ICL to ICL. (low to low).
GOLD Bottomed (ICL) DECEMBER 3. So it has been 4 months .
MINERS built that huge base from AUG to FEB and bottomed ( Their ICL) was a month later than Gold with a shake out in Mid Jan.
SO…Miners are only a bit more than 2 months into their Intermediate Cycle. THEY could run and make a new high and then drop into the ICL, Gold could pop up from here towards that $1300 and then drop.
It is all pretty much left to guess work now, because the consolidation phase here is very strong- leads me to believe that accumulation is in the works here.
In my opinion: It is best to just look at it as ” A strong run up, and a strong consolidation phase preparing for another run higher.” – That’s the technical analyses view.
awww… great picture you drew with the explanation. I can see the possibility. Thanks….we’ll see what happens….holding some miners that are not pulling back much just in case…if wrong I buy more at a cheaper price….
Yeah, I wouldn’t be too worried if I was holding miners either ( I have some ‘core’ in a separate acct. from the Jan lows )
I hate any draw-down, but I honestly think that after the next run higher, these will all be much higher.
HMMM, LEI did it again ( see a 1 yr chart)
I dont know if anyone bought TCK as a commodity, but that looks like a real H&S, and I would sell it today
Thanks, Alex. it was tickling my stop and rebounded just a little. You certainly made up my mind for me.
Hey Edward – I just didn’t like the volume on the way back. Normally I would have thought that its going for the 50sma ( and it may), but just a gut feel on it.
Here is an interesting thought about this consolidation. The 3xETFs decay in consolidation phases. I rode NUGT from $17+ to about $48 + and sold in February.
It kept going during its consolidation to $75, and even with the HUGE SWINGS in recent volatility, it has not even dropped back to my $48 sell point since February!
That kind of amazes me here in April.
Things have definitely changed in that respect. The typical maximum correction is 38.2% but its stealthy.
CF, does FCX look bad in your eyes? Thanks!
Thats tough, I’m seeing consolidations that do look like H&S, but I dont know if they are.
FCX actually has not even fallen 38% from its last run lows to high, so thats good. FCX follows copper and may just be falling to the 50sma. If you look at Copper, it took a rather big hit today, so that considered…
Doesnt look ‘bad’, but could experience some downside toward that 50sma
OBSERVATIONS:
NATGAS took off today- up 8cents
Oil was down $1 and I saw…
LGCY dropped 9 cents today, recovered and is turning green.
MPC looks good.
See also CWEI, SN, AREX, HL, SM,
UGAZ broke higher ( UNG/ NATGAS)
Nat gas was really boring for a long time, volatility has returned last 2 weeks. Just when you think it’s all over from the recent pop it rises from the dead today.
Wonder what’s wrong with BAS, needs to change ticket symbol to BAD. Garbage.
volatility sucks a$$ (unless you’re daytrading specialist).. get whipsawed out of positions like crazy.
gimmee a nice steady rise or fall plz!
… i LIKE these observations …
AwesumNuggets … 😉
KeepinTheStreetsSafe
This LABU chart posted when it went from $21.99 to $25 on MARCH 29.
It almost hit $40 today – about a week later.
.
refresh
I don’t know what just happened to RLYP but I like it!
Yes, and VKTX
Don’t have that one, but nice too. Considering all the tantrums I’ve had to deal with today RLYP has made my day 🙂
A couple of the Shippers are perking up again. ( I dont like their volatility lately though. Just popping from bases , still struggling to gain traction for the most part) .
SALT, NM,
CF, why don’t you think NUGT could be a H&S pattern? On the right shoulder now.
Bill , I dont remember saying that.
Refresh for last weeks chart ( one of a few).
.
(But it looked more likely then than now.)
Well okay then. I must have read it somewhere else? I spend most of my time here, but not all of it. So, could be, what breaks it will be a higher hi, right?
Yepper
No Prob – You might be thinking of earlier in the comments section when I said that FCX looked a bit like a H&S , but I didnt think it was.
Two things…. When the Fed Speaks is Tonight… So that explains a lot about today http://m.huffpost.com/us/entry/flip-flopin-thursday—ye_b_9632692.html
(Hope you don’t mind the link–love this kind of stuff 🙂
Also this afternoon, oil and the spy didn’t move together for once decoupling? Alex seems to me when gold dropped it took the market with it for a while before it decoupled…..
Funny picture.
Dangit…..my apologies Alex, in my haste I only read the Ist paragraph and noted the picture….. Now that I read the whole link I realize it’s really a piece by another “competitor” who I do not follow nor endorse…. …. I deleted the link. My bad 🙁
… no soup 4u … 😉
And there’s Louise, right on time ( or is she Thelma?)
well … either works .. we do need a male to join the roadtrip tho…
ChartFreakSammy?
lol
I’ll walk, I only trust one of the 2 in THAT car 🙂
EDIT: She was right – No soup for you!
And now I trust NOBODY on that road trip!
Shoot, I edited that! But you have to admit that when you wrote that this morning, it was open for interpretation ….. Sorry,
ahhhhhhhhhhhh ha ha ha ha …. 😀
….
Well he is known for prolonged sideways moves lately 😉 (Maria you are a bad influence.)
u took the …words… right outta my mouth .. ;o)
#LongLostSista
Yes …and note, I am NOT the one who wrote the first subhead for today’s report ….and then read Alex’s reply to Peter this morning….just saying…..
… good catch on the subhead btw….
hilarious…. good to know I’m not the only one with my mind in the gutter…
HA!
Lol.. I prefer to think of it as a fine appreciation for the double entrendre
Lol I eat dessert first !
… nice :o)
me 2 … literally …
#rebel
USO was up 5% yesterday. Today it dropped, touched to 50sma and bounced. This is very positive IMO.
Yeah, I went long this morning.
As did I..
Here is a little chart
Nice use of the Ichi. Once above flat top should then provide support.
correct.
Rob is an old friend of mine, and he is the ‘ICHI MASTER’.
Sorry Rob, I had to say it 🙂
Ha. Didn’t do me much good in the bear market. Funny how things work in a bull, eh? 😉
.. nice Ichi master ….
Congrats to all who had/held/traded LABU and IBB. I was traveling for work this week and wouldn’t have account access during the days so didn’t want to carry a 3x then. If we pull back further to support, may provide a secondary entry.
I was thinking this morning that yesterday’s move in S&P may be the takeout and now we’ll drop to the DCL. Will have to see what tomorrow brings, but keep that possibility open. I’m hedged with a bit of VXX and some TLT.
Alex see anything different recently in bonds/TLT? I know she is a slow mover. Pretty crazy how low the 10-year is even though SPY had recovered all of 2016 losses (as of this morning).
So is this a H&S? It has the higher volume that I didnt want to see
.
The drop would be a shake out below the 50 sma
A lot of selling volume in LABU and BIB today, but the price held up pretty well! What do you make of it?
That was just me trading the daylights out of it Bill 🙂
.
( actually, I didn’t, must have been someone else)