
PUBLIC POST – REVIEWING THE BIG PICTURE
Here at Chartfreak, we discuss the day to day market movements and trade set ups, but we also review the bigger picture at times too. So in this weekends premium report, that’s what we did. I’m going to release about 75% of my weekend report here, to give you some of my bigger picture views. Please remember that since this was the weekend report, many of these charts are from last Friday. Enjoy.
.
SPX QUARTERLY – In 2015, I pointed out bearish signs that I was seeing in the markets and expected a drop. Then I showed subscribers this chart back in January. I was pointing out the break below certain critical areas where bear markets began at prior tops. I said we would watch these on a Quarterly, Monthly and Weekly basis, to see if we have put in another top.
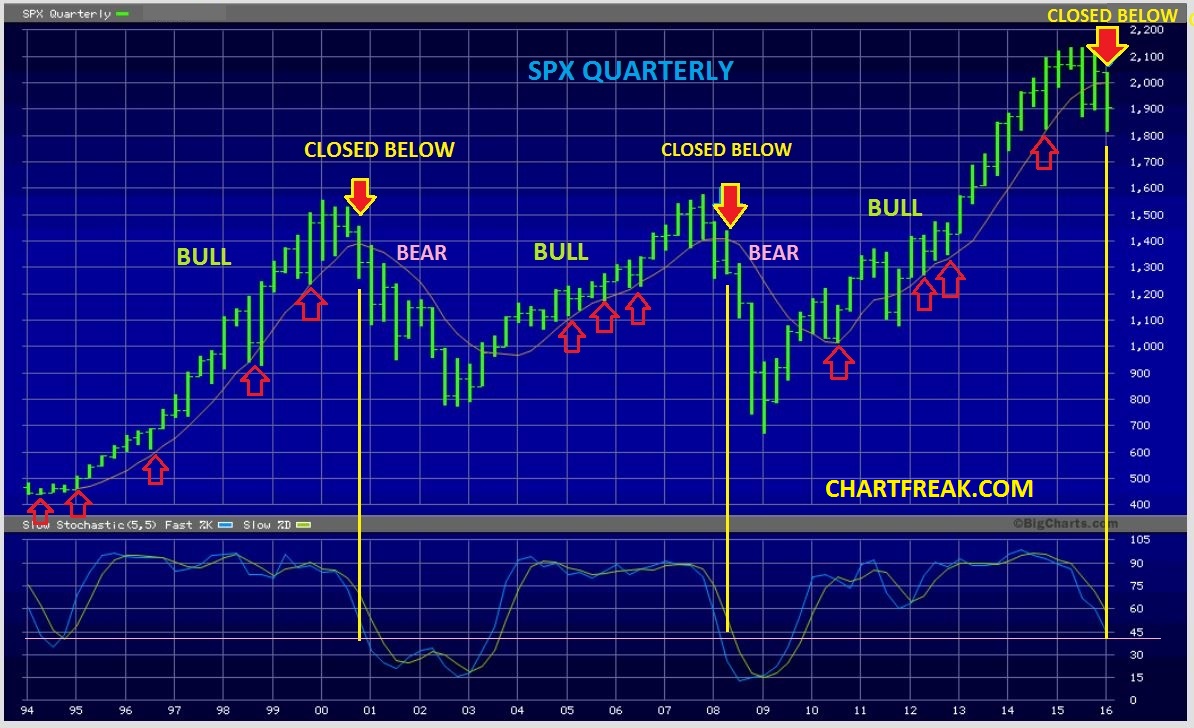
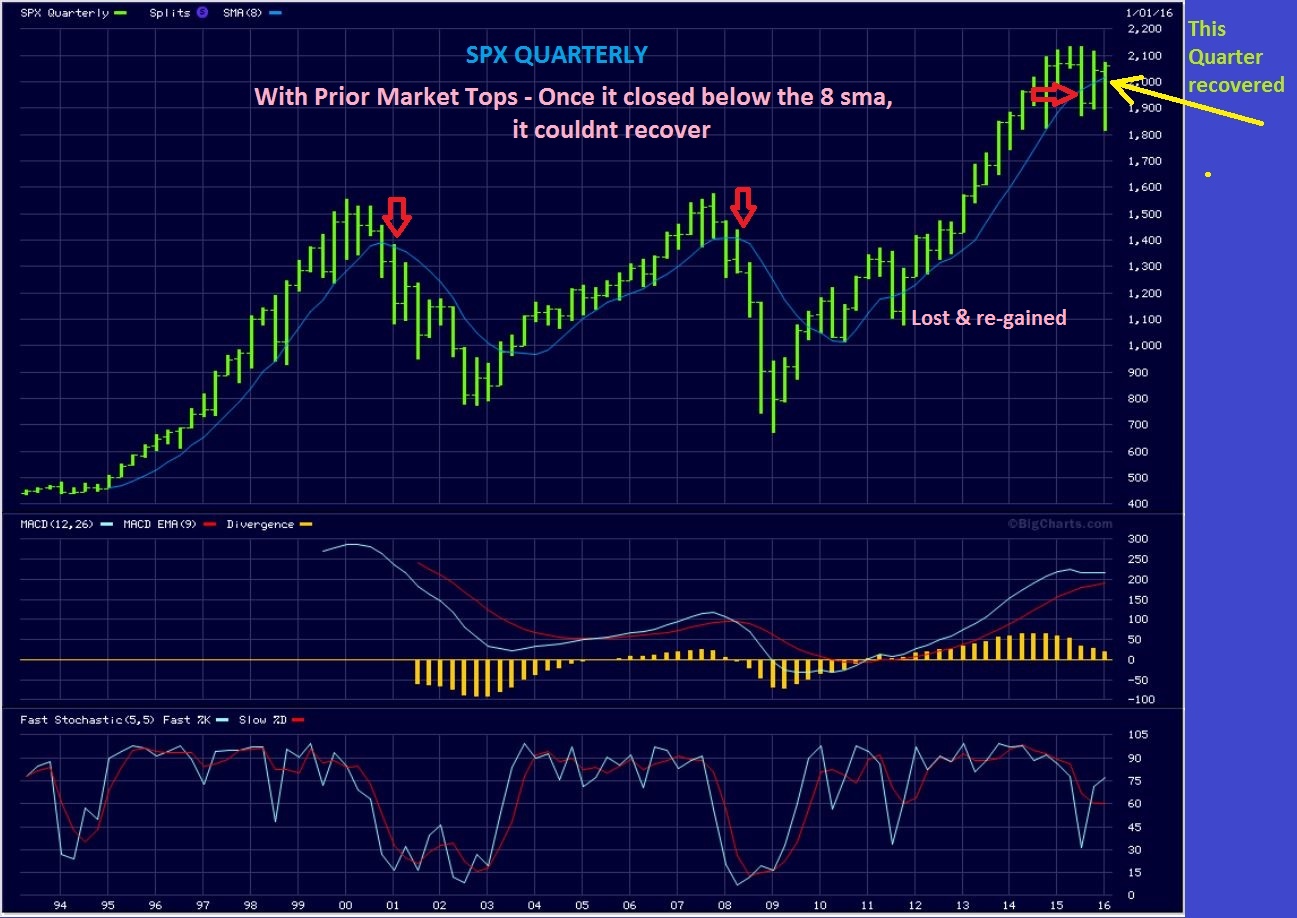
SPX QUARTERLY – The quarter has ended, and the SPX recovered by the quarters end. That did NOT happen during the 2000 and 2008 topping process, (See the RED ARROWS below). I discussed possible implications.
Another interesting observation
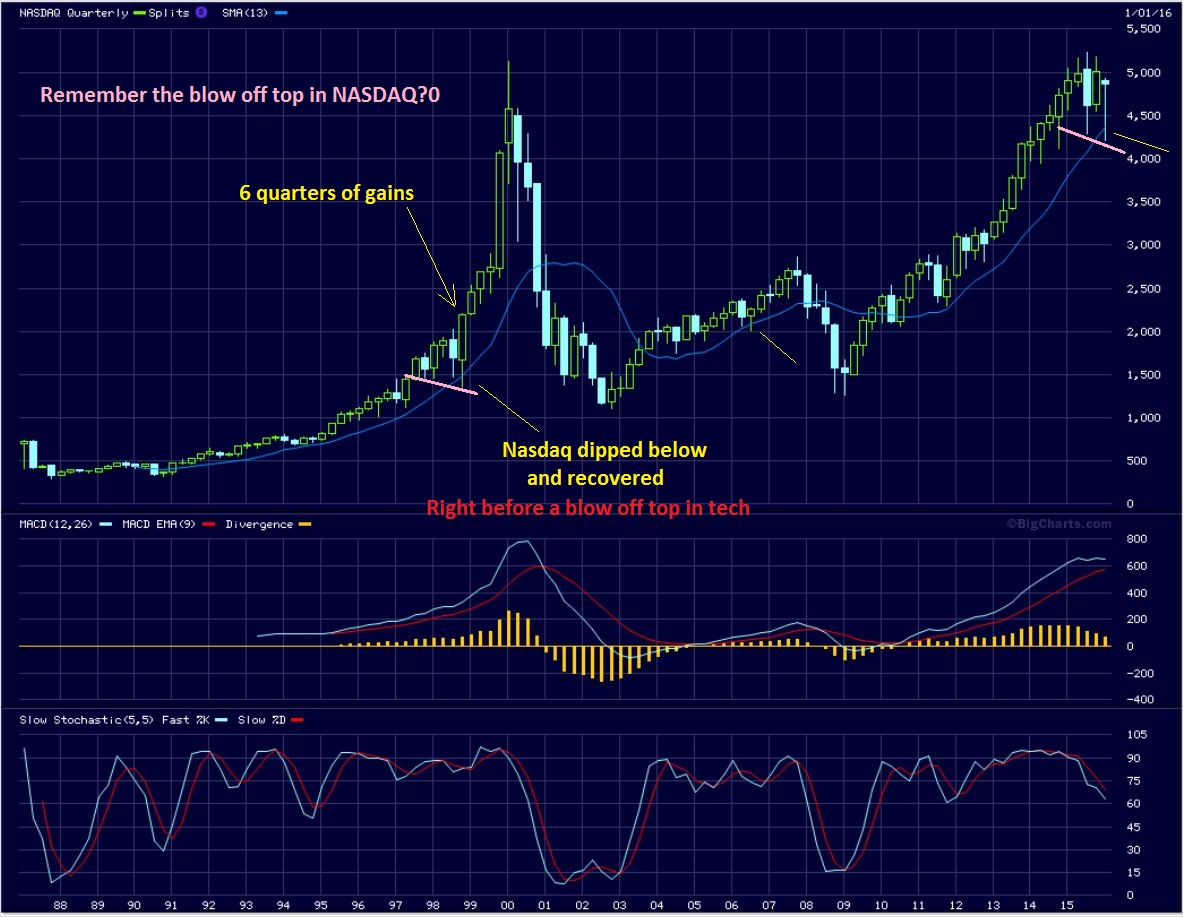
the NASDAQ QUARTERLY –
Do you see on the left side of our chart how the NASDAQ rode the 13ma (Quarterly) all the way until 1998? It then did a shake out break at the pink line and recovered. That shake out was followed by 6 straight quarterly gains, a blow off top to the Tech bull mkt. We just saw a similar shake out/ reversal now. Here at Chartfreak, we will watch for either a break out to new all time highs, or a struggle and continuing topping process.
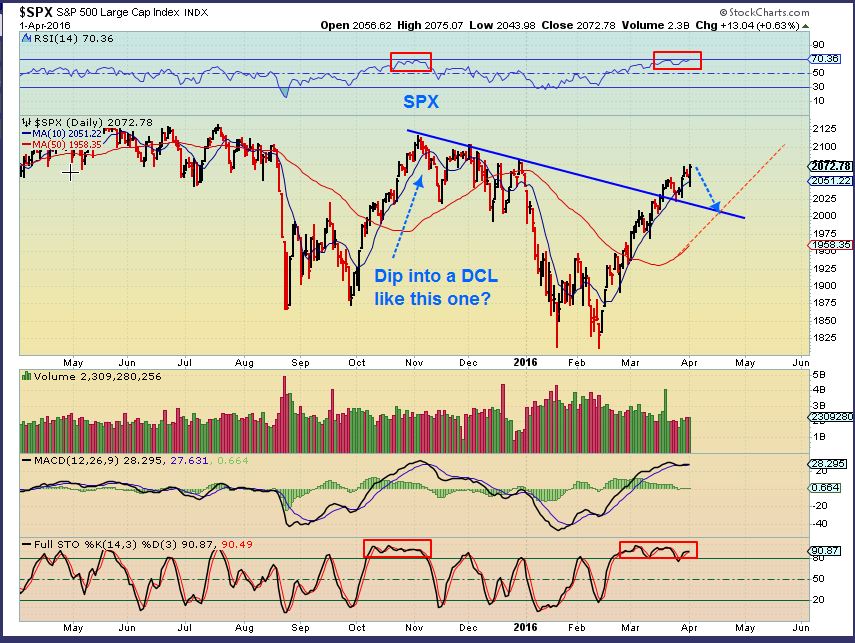
Friday – The conditions resemble the top in November, and I expected a pullback this week. . If this Drops to a DCL and then takes off to new highs, we could see a much more bullish big Picture view (And plenty of time to react to it). The 6 quarter blow off in 1999 was CRAZY. This is where we’ll soon see whether we have entered a bear market sell off ( Top) or a return to the Bull run and possibly even a blow off top in the future.
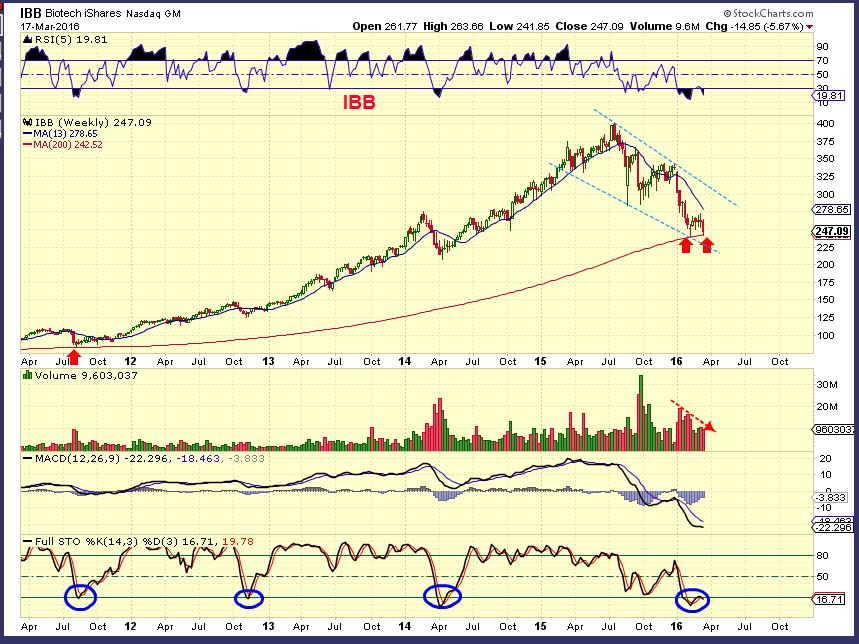
BIOTECHS
From March 17 – The weekly could have bottomed here, oversold and volume selling drying up.
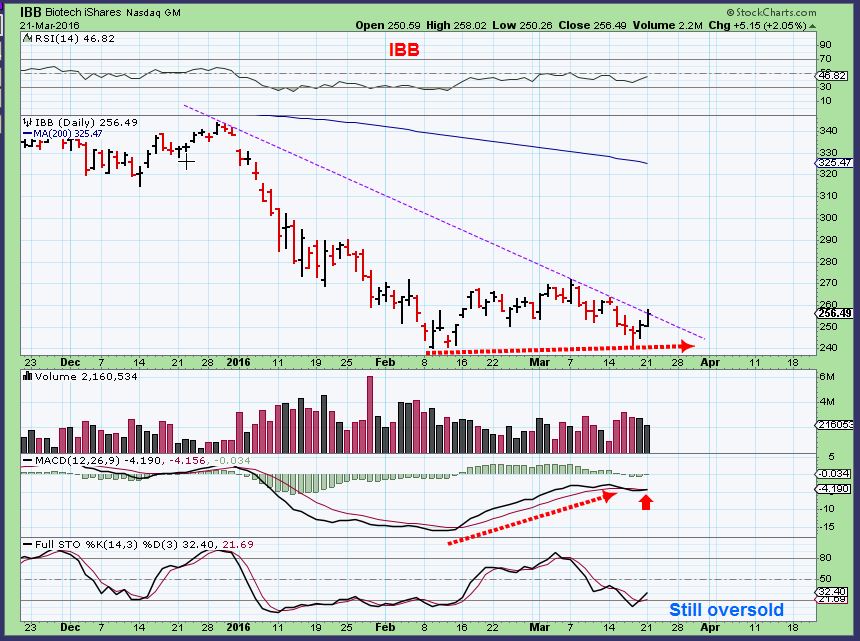
We’d been discussing the BIOTECHS as a possible double bottom. ( A low risk entry) This was my March 21 chart.
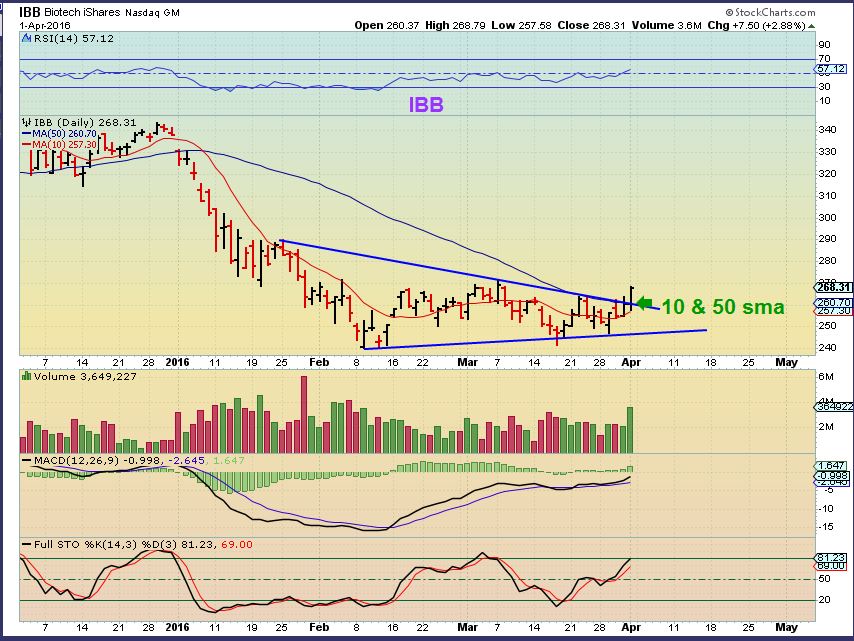
IBB FRIDAY – A break above the 50sma with good volume. Low risk too, with a stop below the 50sma if someone wanted to do it that way. We now see that the ‘double bottom’ before March 21 was part of a bigger base. We need to realize that this base building could continue, if this is a false break out.
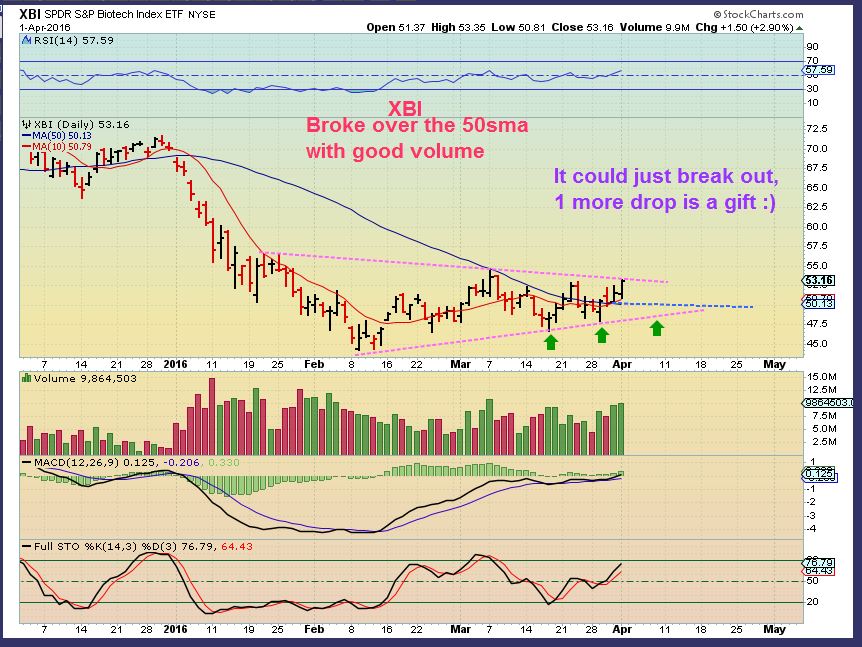
XBI – We have a break above the 50sma with good volume. We are still within a BASE however.
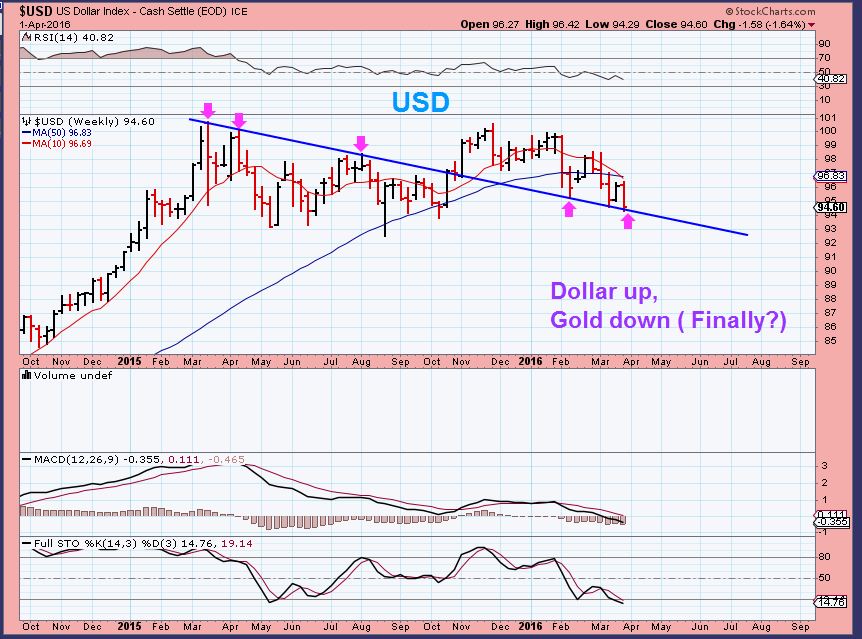
USD – I pointed out that if we dropped to the bottom trend line, the dollar could bottom and Gold could finally pull back in a more meaningful manner.
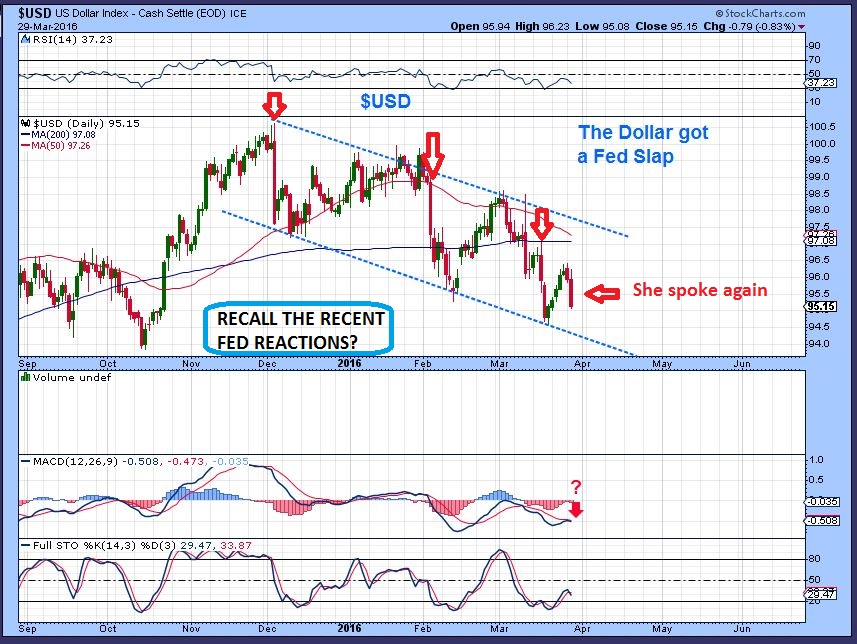
Friday – We may now see the Dollar move higher.
.
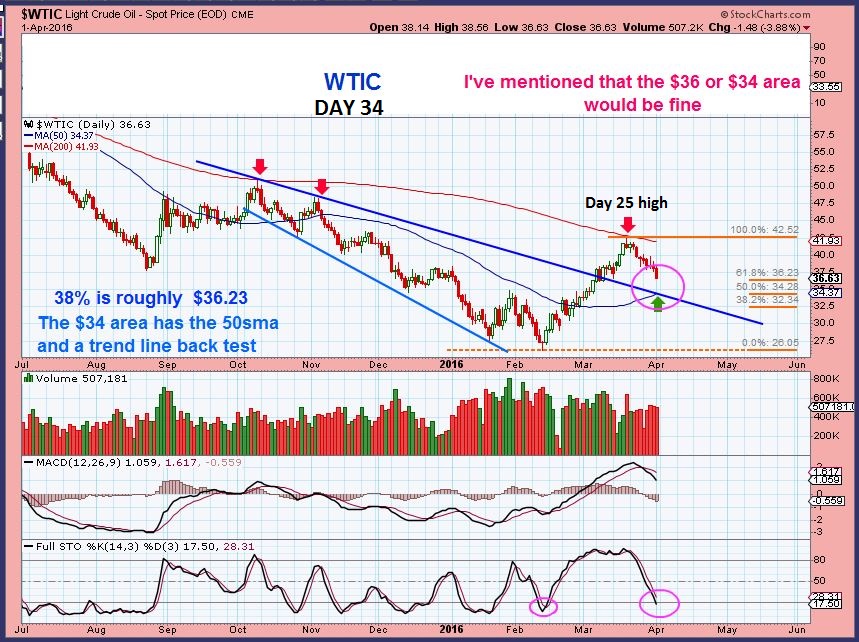
WTIC – I have been waiting for a drop to the DCL and discussed how long these daily cycles in OIL can be. I also said that $36 or $34 would be good.
When I look at this chart, the 50sma is at the $34 area, a 50% retrace is in the $34 area, and a trend line back test is in the ….$34 area. I’m watching the Energy / Oil sector patiently.
.
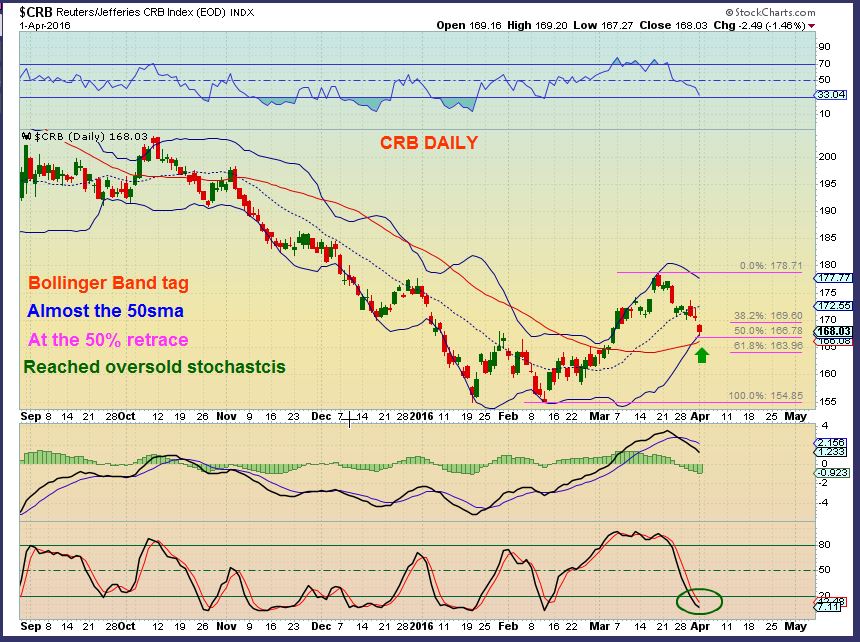
The CRB did drop Friday, and now is hitting the lower Bollinger Band . Also the stochastics is now oversold.I think we are close to a reversal in commodities.
The 50sma is right below price. I have mentioned that I still like the charts of X, AKS, VALE, CLF, FCX, CENX, ETC ETC – so a move higher could help them to move out of their current consolidations . Read the left side of the chart.
.
At the end of Feb and beginning of March – I was watching an inverse H&S for Copper. I posted this chart of Copper in addition to the CRB
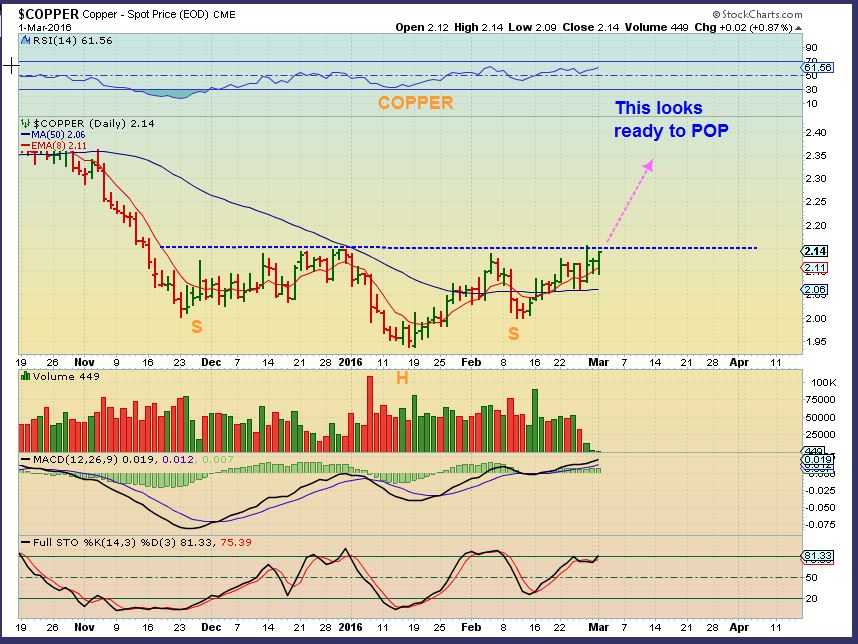
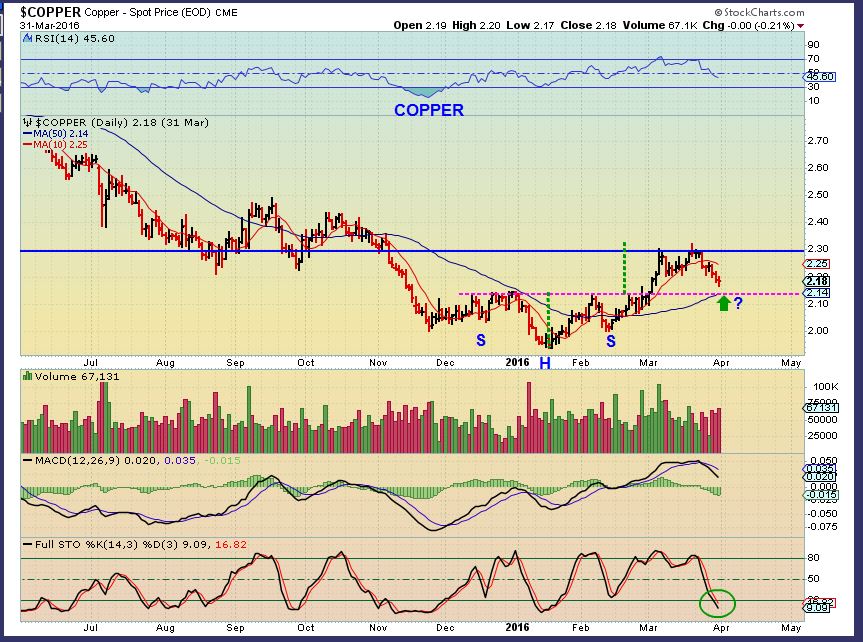
COPPER – It did break out and acted properly, and is now pulling back after hitting resistance. Copper is now oversold on a weekly too.
.
GOLD
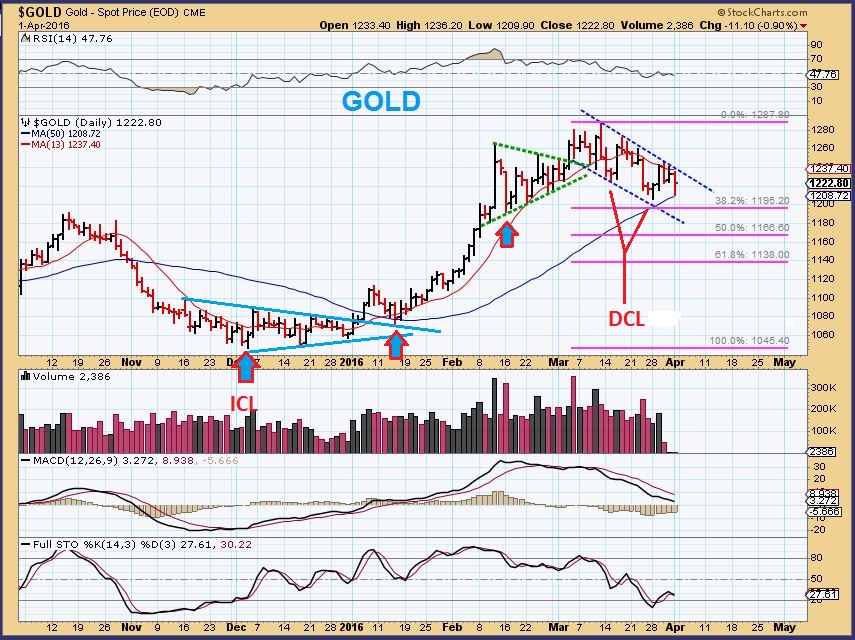
Gold is basically going sideways or topping as time goes on. There is nothing wrong with that. I am trying to exercise patience and keep an eye on things. Cycle-wise, it needs a little more time. Price may just keep going sideways for a couple more weeks, so why not just watch it? Gold found support on the 50sma Friday. That may or may not last.
 .
.
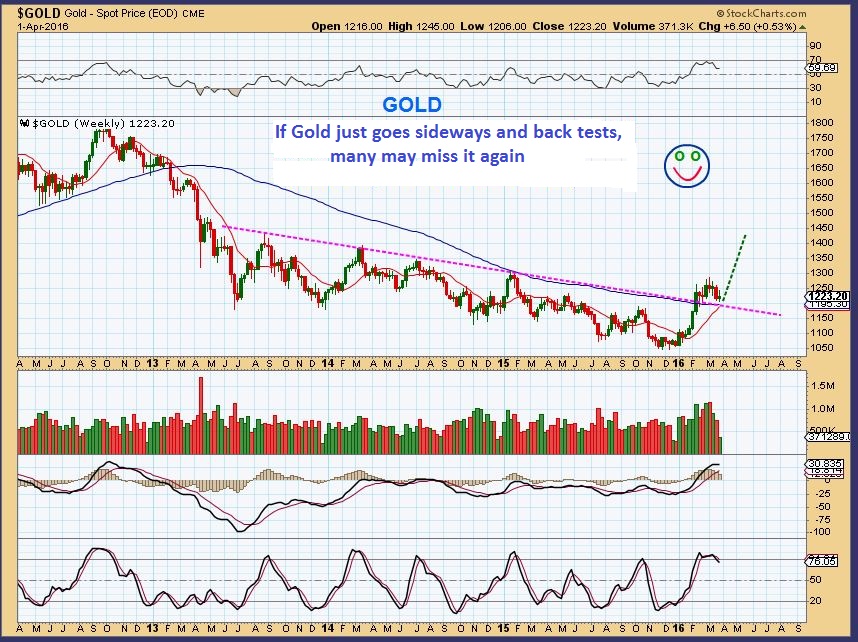
GOLD WKLY – Waiting for a big dip may cause many to miss the next leg up, so we are remaining open and unbiased to all possibilities as this plays out for the next couple of weeks. A reminder is that the dollar could be ready to POP, that might weaken Golds ability to hang in there.
.
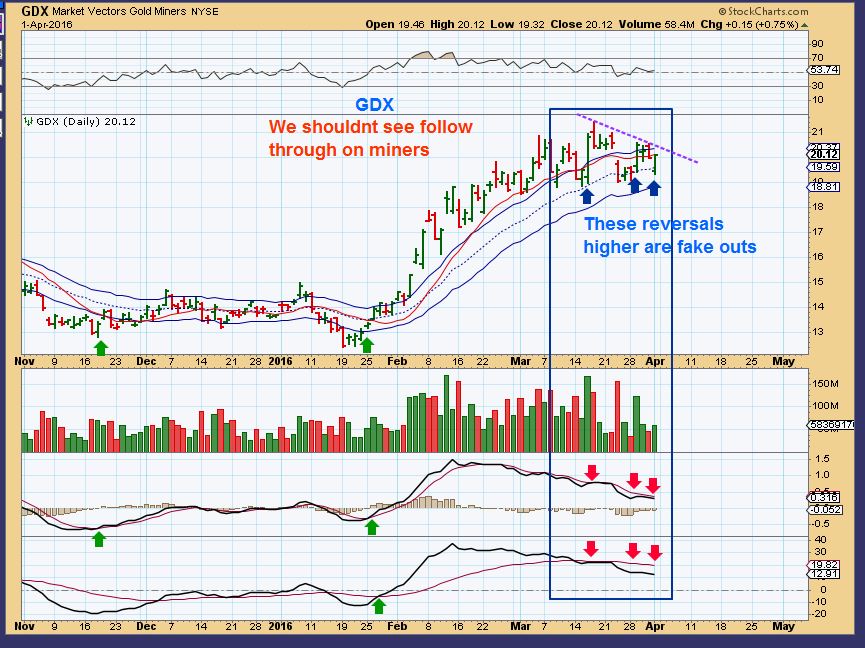
GDX April 1 – Miners are hanging in there with reversal after reversal, but my lower indicators aren’t impressed yet. I dont expect this move will break out above the purple line anytime soon. I am being patient before heavily investing in Miners, but I am watching things constantly.
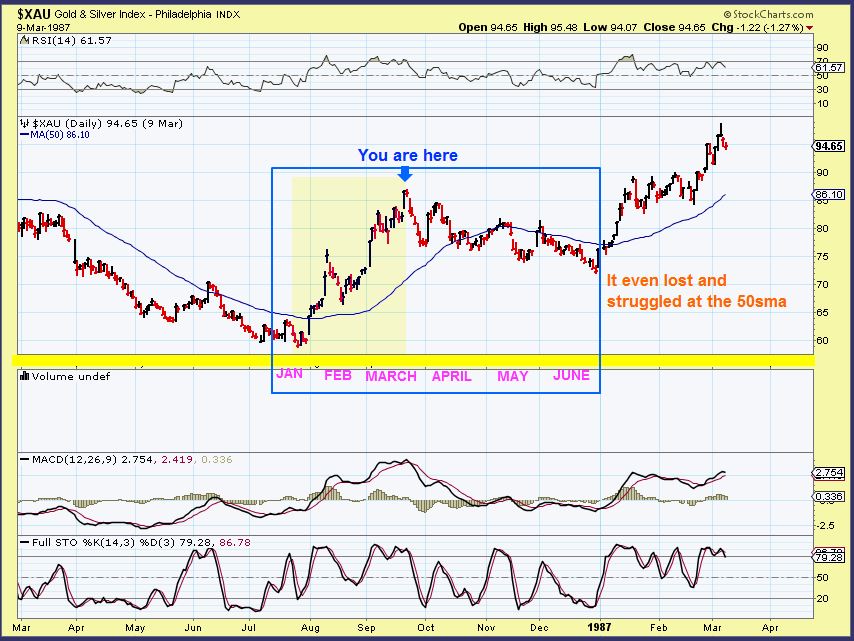
Look at this drop into the ICL in 1986. This went fairly sideways for 4 months, probably driving people crazy struggling at the 50sma.
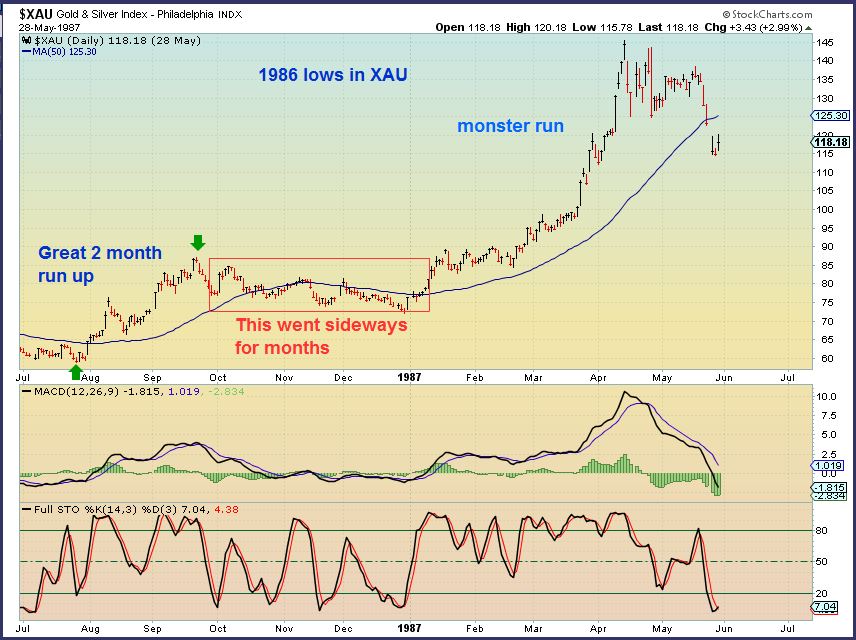
Here it is again, sideways for months above & below the 50sma That next run was HUGE. Maybe we’ll see that again. 
.
SUMMARY: Biotech looks like a good base and set up, we will look for follow through. The basing process of the past 2 months can continue. I only say that because buying that 3x etf LABU at lows 2 months ago has been dead money / bad timing. Good follow through will lead to a break out from its base, and that could lead to a strong run higher. Staying inside of the base could just continue up & down sideways. I will discuss this further in future reports this week.
I still like the commodities, they continue to act correctly. I think OIL is dropping into a Daily Cycle Low (DCL) and will present a buying opportunity soon. I think GOLD & MINERS will be dropping into a DCL too, and present us with our next buying opportunity in the near future. That means that things are lining up in various sectors for now. For some, trading has already been good, but others are just content to wait for Miners or Energy stocks again. For those waiting on these proper set ups, this time period may be boring and require patience. Keep in mind that when the consolidation is done, we should get another run higher. Those strong percentage gains lasted for weeks and I do expect that kind of run higher again. When we caught the lows in Miners in January, many went up 100%. patience pays off. 🙂
.
So that is most of what we covered this weekend as a part of Chartfreaks premium membership. If you think that this type of analysis along with daily updates would help you with your trading, why not sign up for a month at only $37.95? We also have other quarterly or yrly offers found here…
To sign up, click here and scroll down
.
Have a great day and Thanks for being here!
.
~ALEX

