
Perspective
It’s all a matter of perspective. If you fell asleep Sunday night and didn’t wake up until after the market closed on Monday, you may have thought that not a lot had happened. If, however, you read my report Monday morning , you saw that Oil had dropped 4% overnight. CNBC and many other sources of information where lit up. Was ‘Oil dropping to the 20’s again’? Was it ‘a great time to go short’? No, Cycle timing and the charts were pointing to possibly just a small pull back. We are invested in Oil & Energy, so this was important. This was our Oil chart in the report.
.
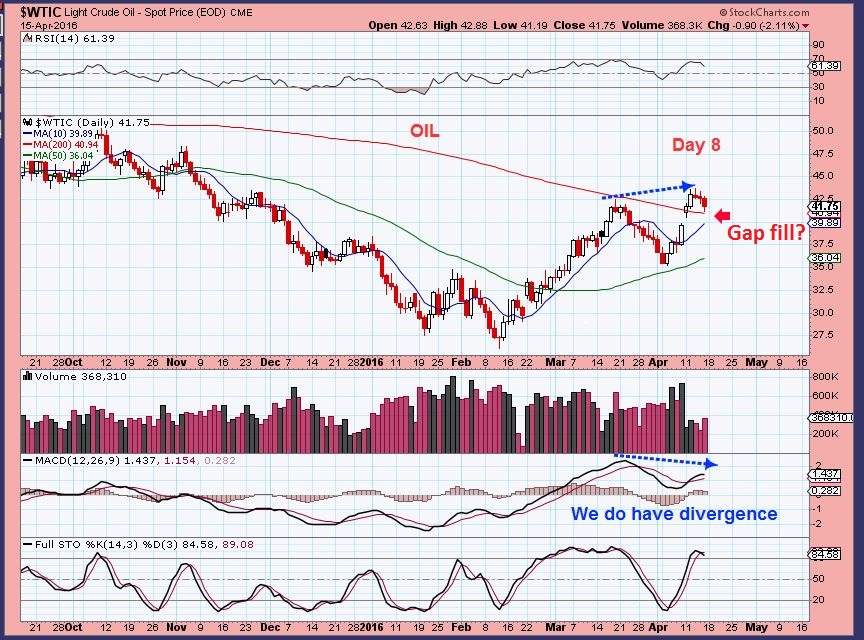
WTIC – Oil was early in the 2nd daily cycle, and the first one was R.T., so I expected more than just a day 6th high in this run. Maybe we would get a gap fill?
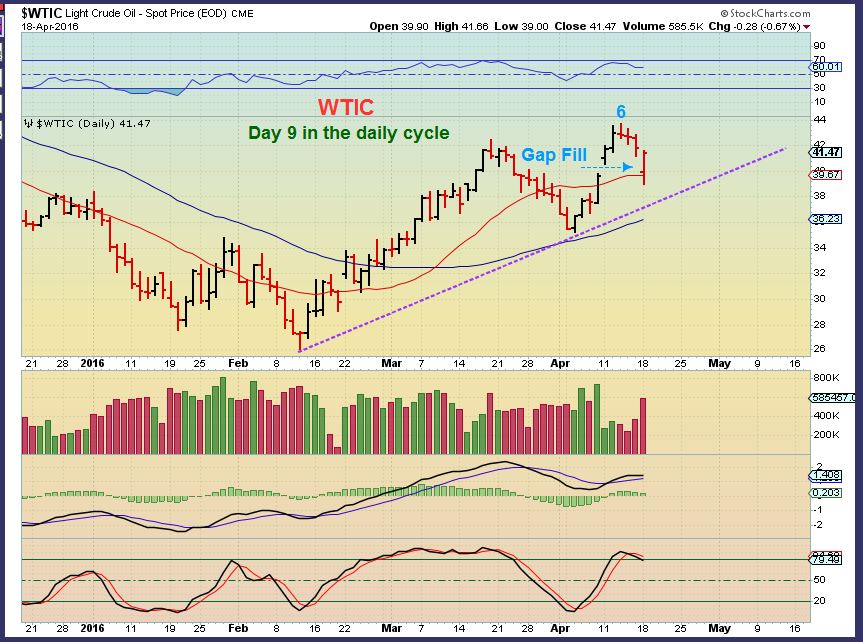
WTIC MONDAY – Many ( Not here at Chartfreak) likely jumped in on the short side pre-market, but the shorts got overwhelmed. This reversal did fill the gap and it did something else too…
Notice this important observation
WTIC – Oil had recaptured the 200sma for the first time in over a year after repeatedly being rejected. It also CLOSED over the 200sma for 5 straight days!
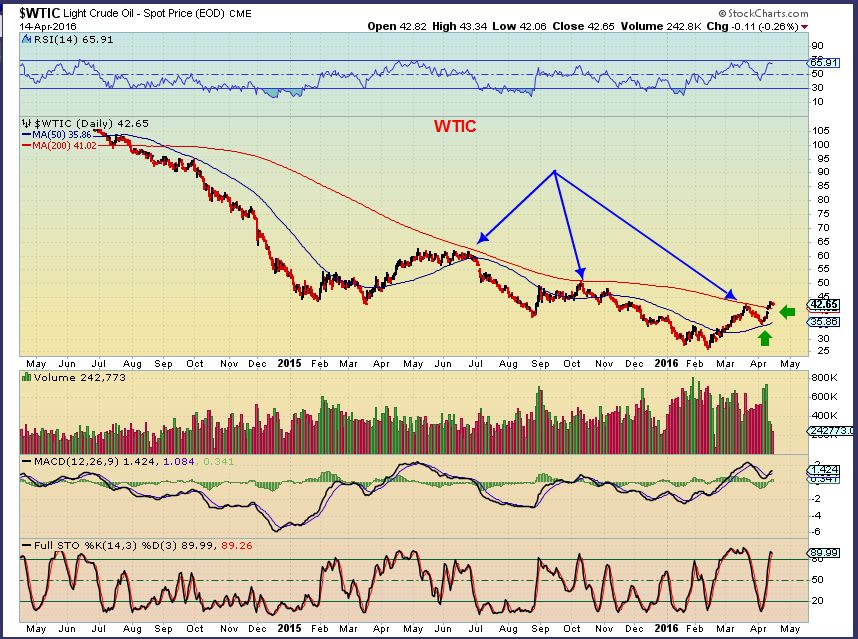
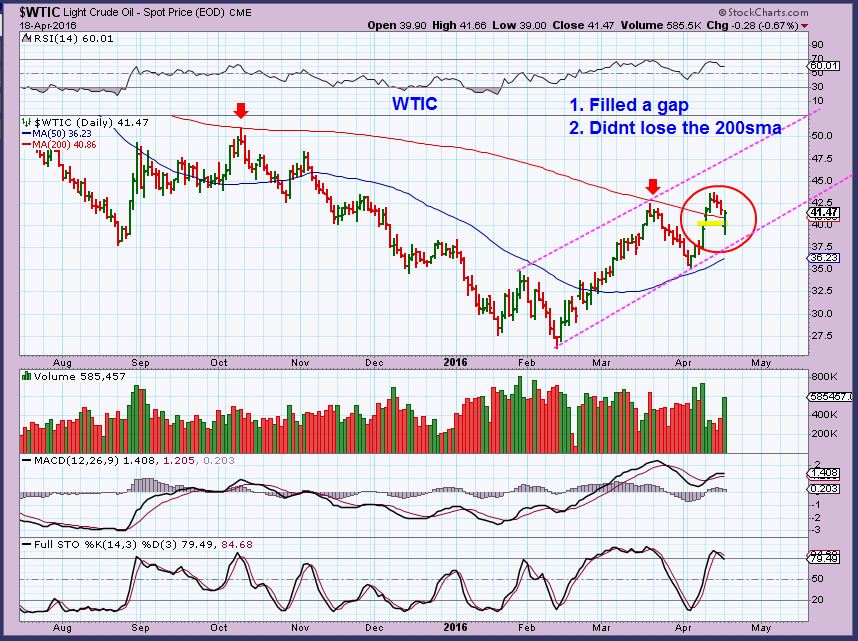
Today when Oil dropped and filled that gap, it actually also got back over the 200sma by the close. I felt that Oil ‘Could’ drop to the 50sma and still be fine, but holding that 200sma for 6 straight closes is impressive in my opinion. Oil remains bullish.
.
Oil reversed , but it still closed slightly down.
The XLE dropped right to the 20sma and reversed higher to close green. This also ‘could’ have dropped to the 50sma and lower channel, but it remained strong.
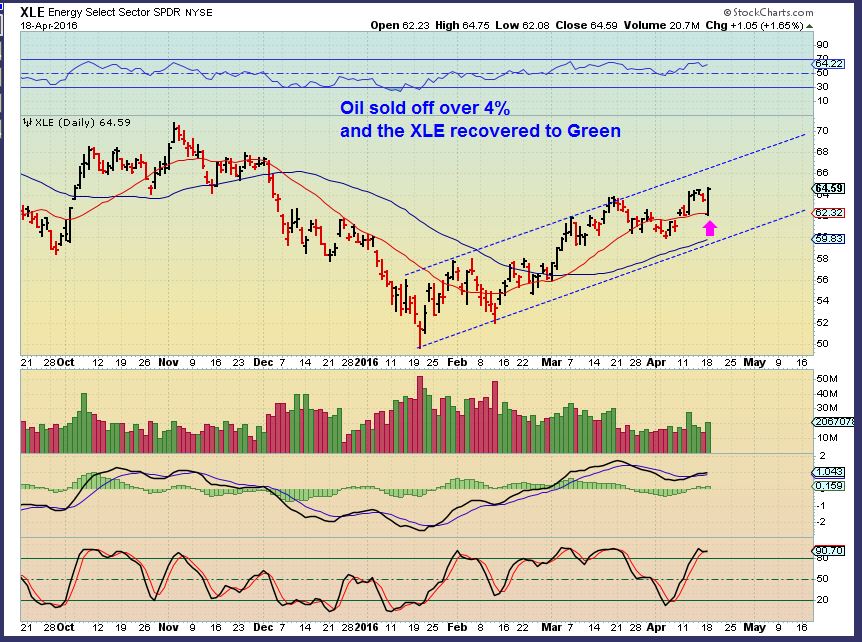
SO this was actually a bullish show of strength for Oil & Energy, I will discuss Energy a bit more at the end of the report. Lets review the markets.
.
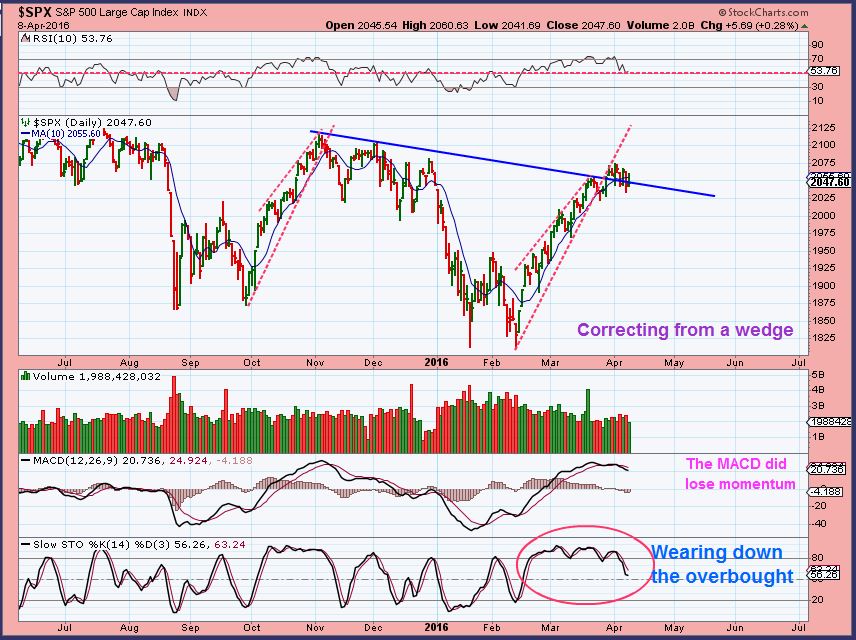
SPX – In march as we rallied higher, I had been keeping my eyes on a rising bearish wedge shown below. I expected a drop and then a rally to follow in the 2nd daily cycle. I also mentioned that the drop could correct the wedge.
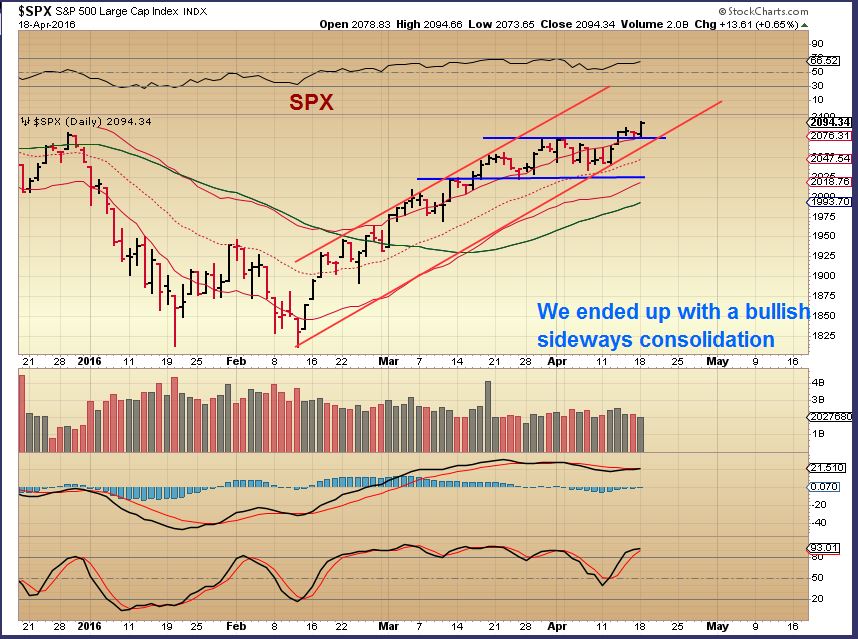
SPX – That wedge has disappeared and so far we are bullishly continuing to climb higher. The past few weekend reports have covered other bullish changes in the General Markets since the Jan – Feb correction.
.
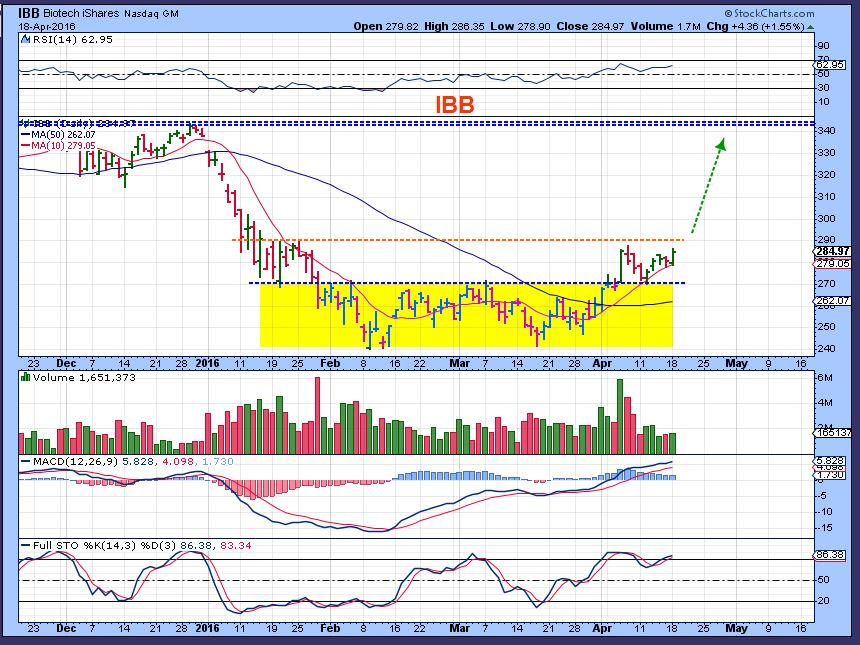
IBB – This is also an area that we have discussed going long due to the bullish set up and bullish base. I pointed out that This dip below would lead to a buying opportunity. There is risk in individual companies, so some buy a small basket of the ones mentioned here in past reports. Some use Options, others use ETFs, or LABU. LABU is 3x ETF, it is only for the experienced or short term trades.
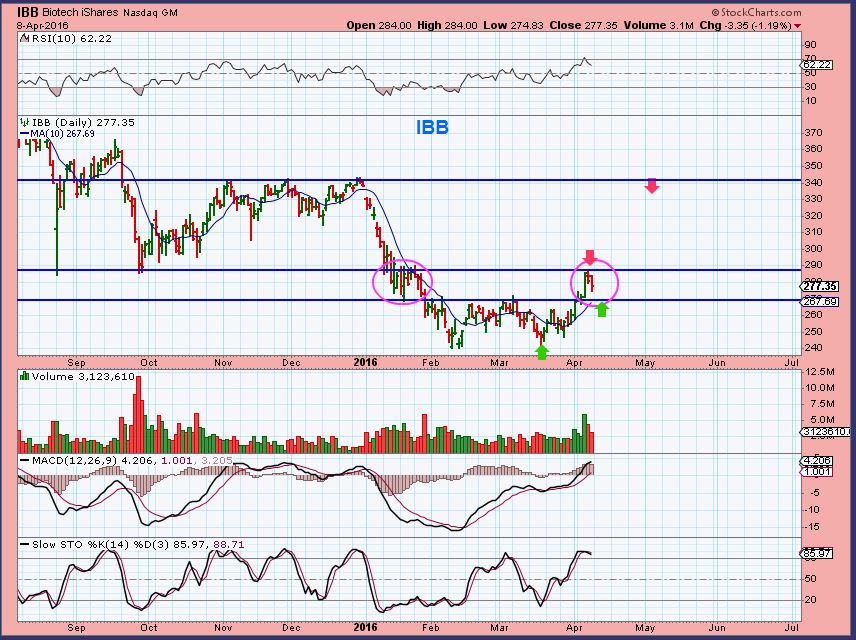
IBB Monday – Price bounced right off of the 10sma. IT looks like it is preparing to break out again, this time from a long inverse H&S type set up. The IBB remains bullish.
.
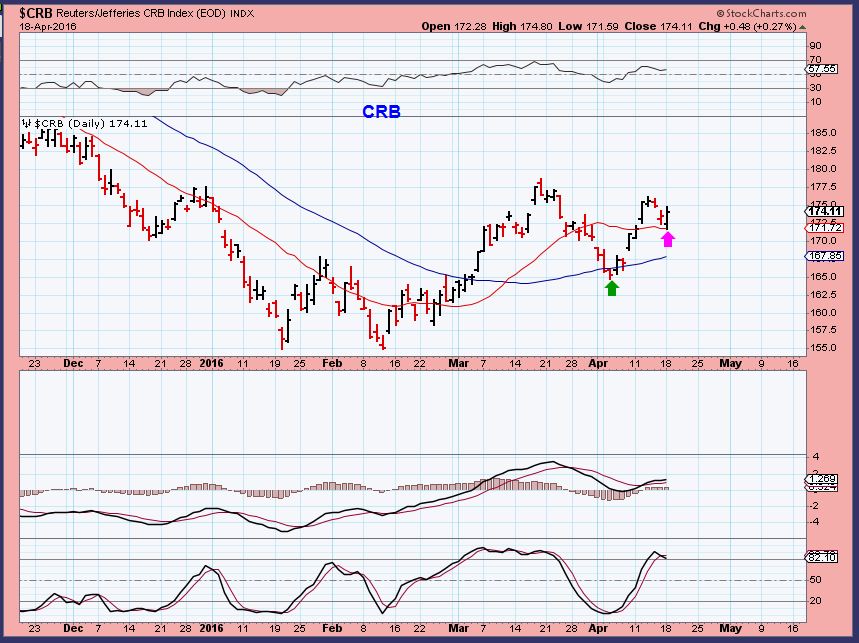
CRB – The CRB remains in a bullish set up too.
We have been trading many commodity stocks in various stages on their run higher. X, AKS, AA, CLF, VALE, SID, etc. etc. Some are pulling back, others are consolidating similar to what we saw when we were in CLF & VALE.
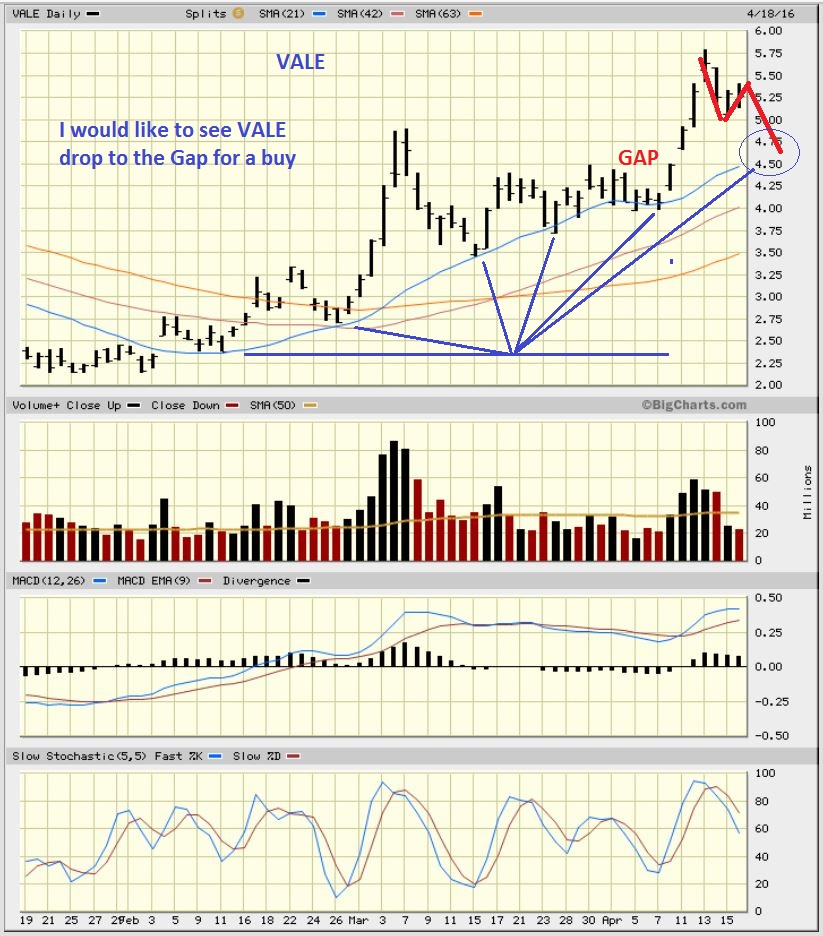
VALE – I’d like to see Vale pull back further, so I am patiently waiting for this, but it i holding up well so far. CLF remains at recent highs.
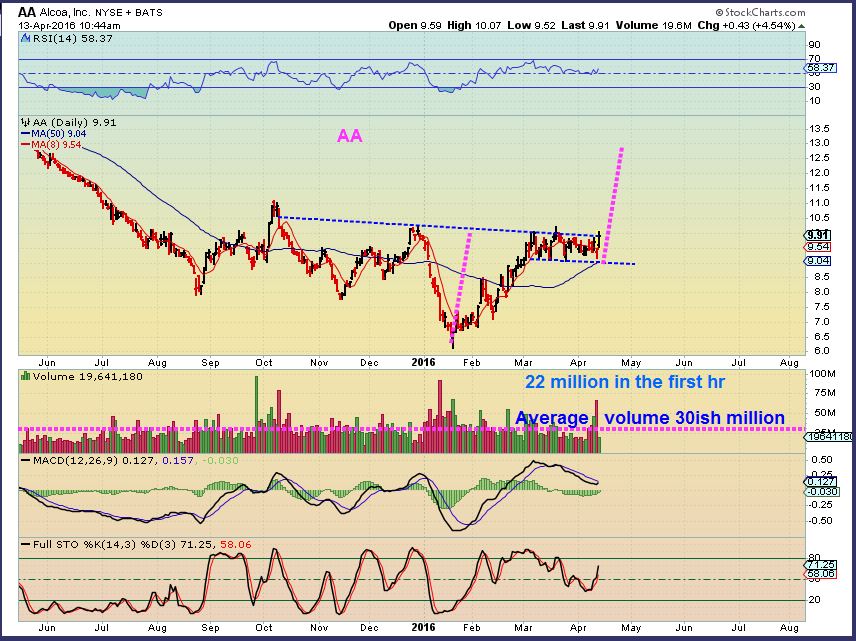
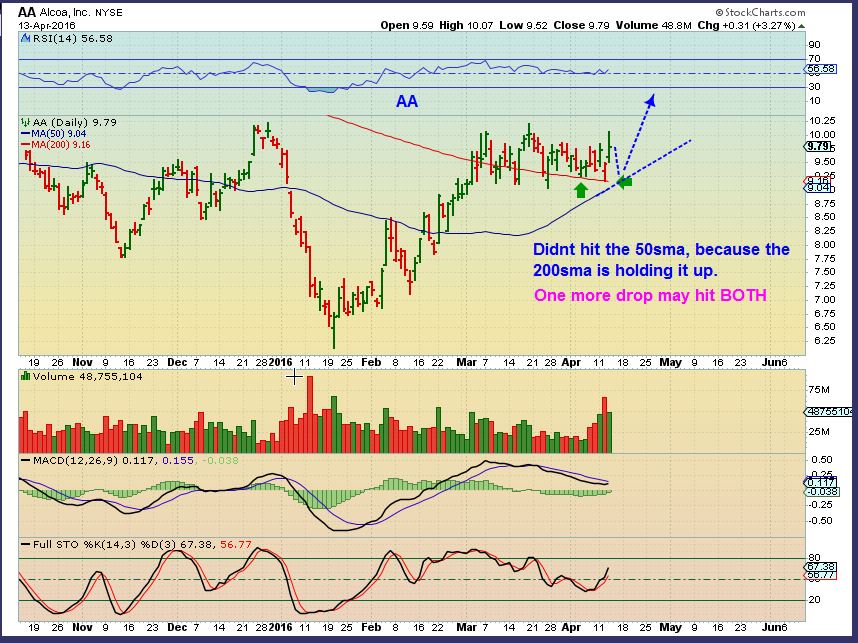
AA– It is still Consolidating, these are 2 older charts. AA continues to go sideways and while some wait and buy the break out, I entered at $9.70’s area. I DO think this will eventually run into the teens swiftly.
.
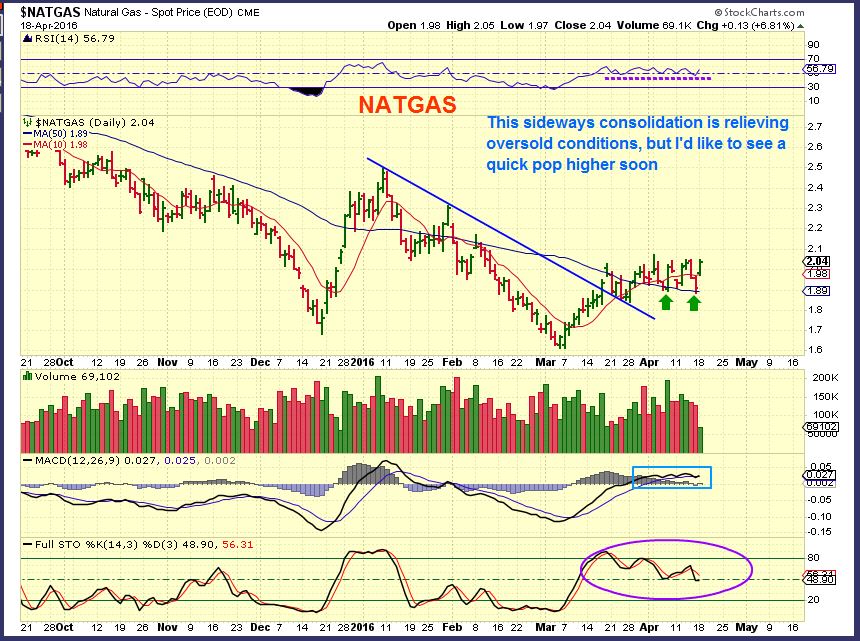
NATGAS – This is also just moving sideways. I was Bullish as it came out of its lows, I would like to see this break higher soon. As long as it remains above the 50sma on a closing basis, it should be fine.
.
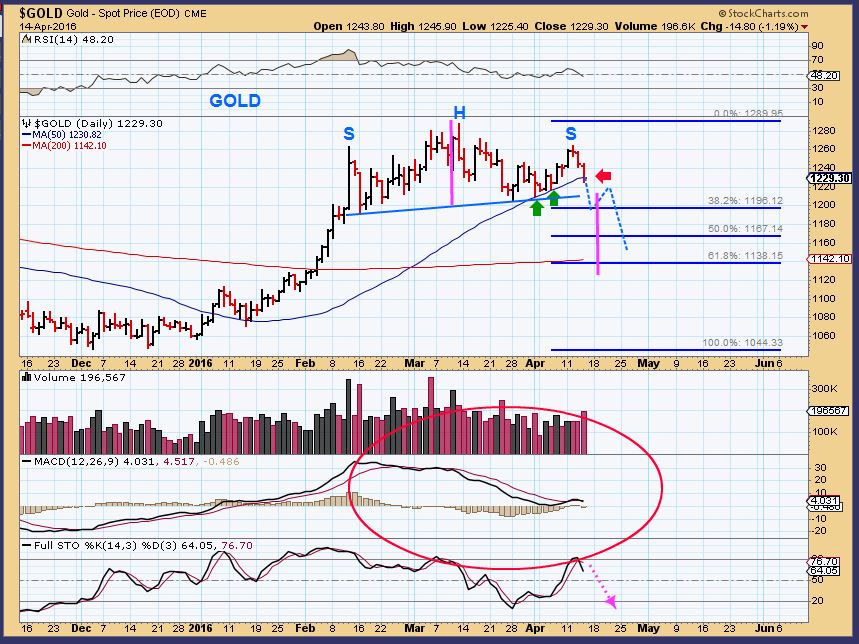
Nothing has changed with GOLD & MINERS Since the weekend report or for the past several days. I feel like I am writing the same thing over and over daily for weeks, so please go back and read a few of the last reports for more detail. Basically GOLD should pull back, it is due timing-wise, but it keeps going sideways. Miners are consolidating bullishly, and some are just being accumulated and flying higher. For some reason, Silver lagged and actually looks to be breaking out now. Will that keep Miners afloat if Gold corrects? 
.
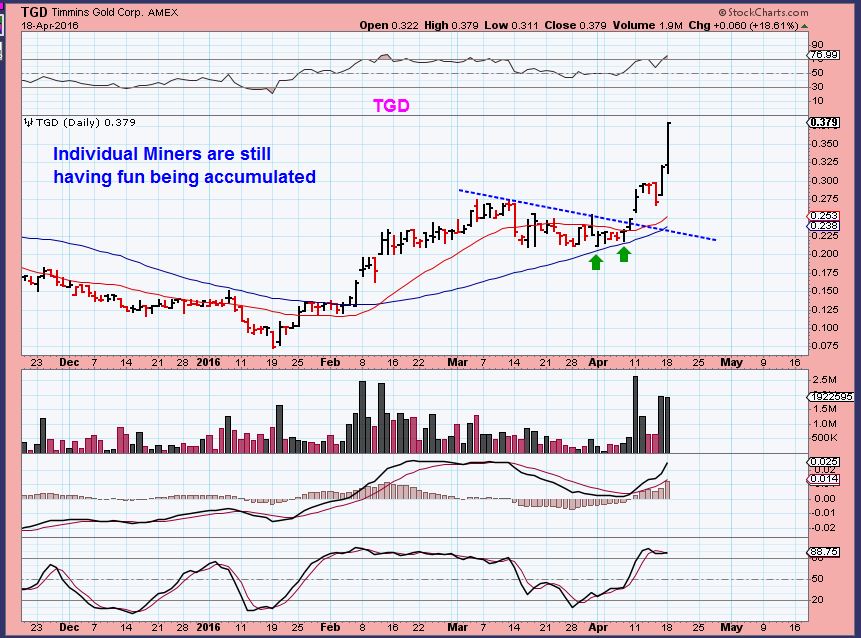
I mentioned TGD ( and a few others) in the weekend report as still acting bullishly.
APRIL 12 I posted this HUGE volume break out day. Why Were Miners like GSS, AUMN, MUX, VGZ, TGD, etc all still acting correctly, if Gold was due for a pull back?  I don’t know, but they could be traded for traders in front of the screen all day. It has been good for ‘core’ positions, that’s for sure.
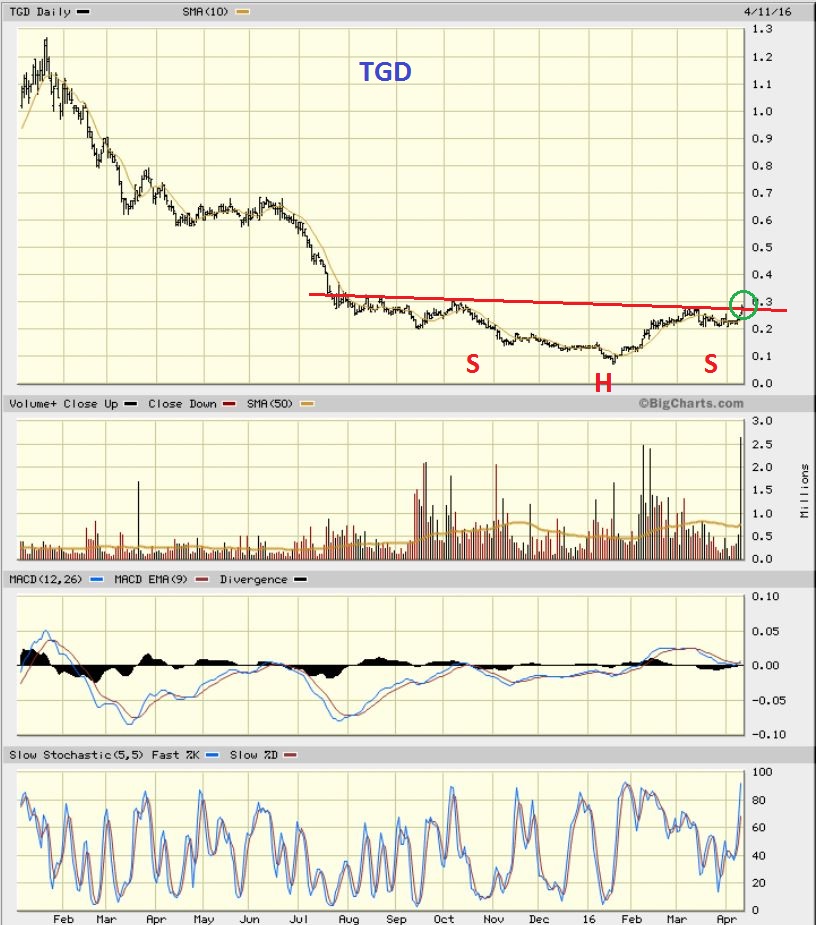
This weekend I showed this inverse H&S, also showing that BUY & HOLD core positions have been paying off since Jan lows too.
I’m pretty sure that Gold was down today, but someone forgot to tell TGD ( up another 18.6%) and GSS (up 11%) , VGZ, etc. Individual Miners that have proper set ups are still moving higher.
.
I still expect something like this in the next 2 weeks for GOLD, but right now a sideways consolidation has been the new pull back..
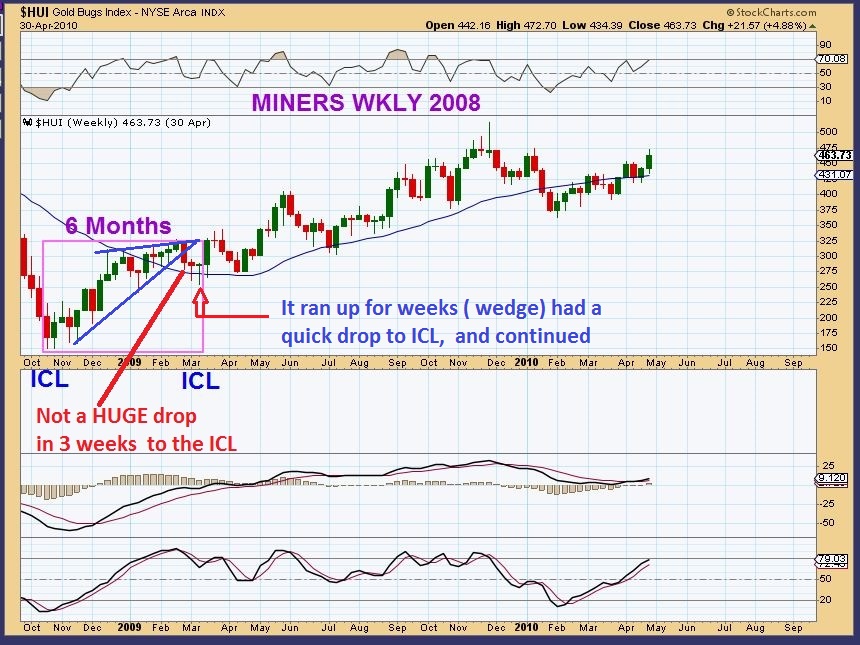
I found something somewhat interesting in MINERS coming out of bear mkt sell off in 2008. I’m not saying that this WILL happen, but MINERS are holding up here, what about the pull back? Consider this.
.
This is the HUI coming out of the bear market sell off lows of 2008. ICL to ICL in 6 months time, where was the BIG DROP in miners? A Wedge did form, and then we got a rather quick slam down in 2 weeks time. THAT was a 38.2% drop from highs. Currently a 38.2% pullback in GDX is $19 and 50% is $17.75 area, so…
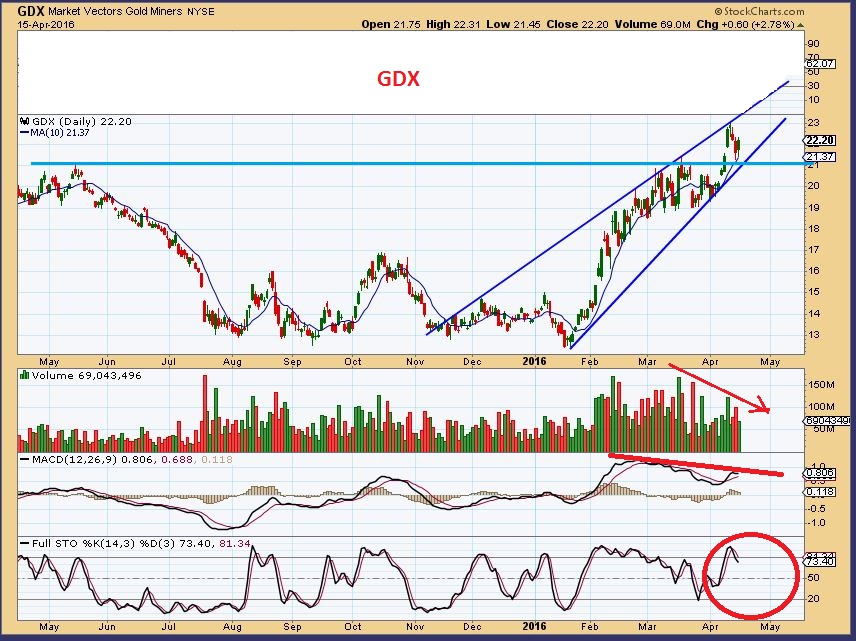
GDX – I Used this chart in the weekend report. GDX could break down from this wedge quickly in a shake out type drop similar to the one above in 2009. That 38.2% or 50% would be the $17 – $19 area. I’ll be looking for clues to buy in those areas if we ever get that drop 🙂
.
ENERGY STOCKS
So the ENERGY STOCKS mentioned in last Fridays report ( And the Friday before) Still remain valid. They went on sale today, but most recovered. I did get some feedback that some readers here were buying. I also got feedback that after reading scary things in other trading forums Monday morning, a few sold at the open, basically at the lows of the day. Not knowing whether to buy the recovery as the day went on, I’m asked are they still bullish set ups or did the drop ruin things? Lets look at a few and see why they look and remain bullish to me. In some I’m going to go over the whole big picture for them – it may help.
.
CPG – Breaking out from a long term trend line. It ran $7.50- $11.86 . I show this to show the progress that they are making since being mentioned in the report. This was at the end of Feb.
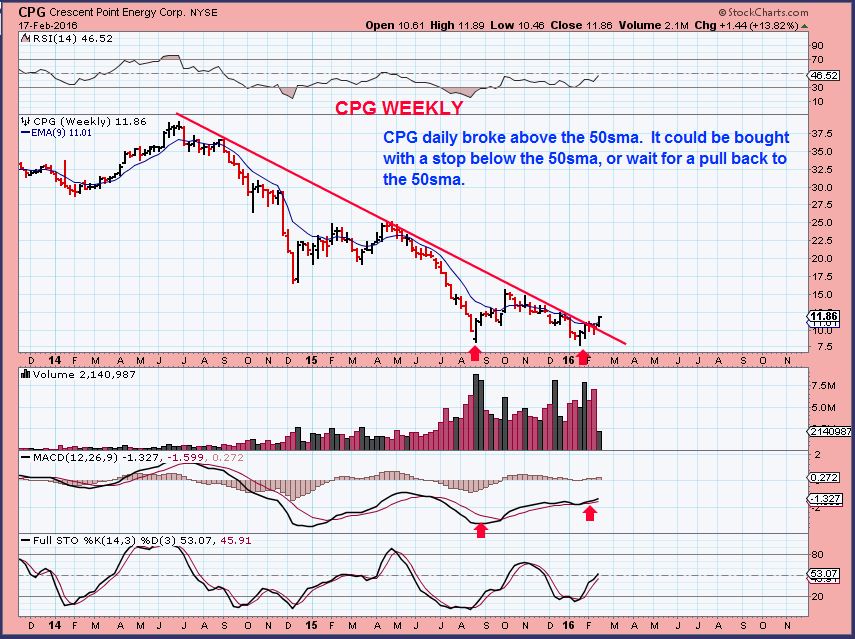
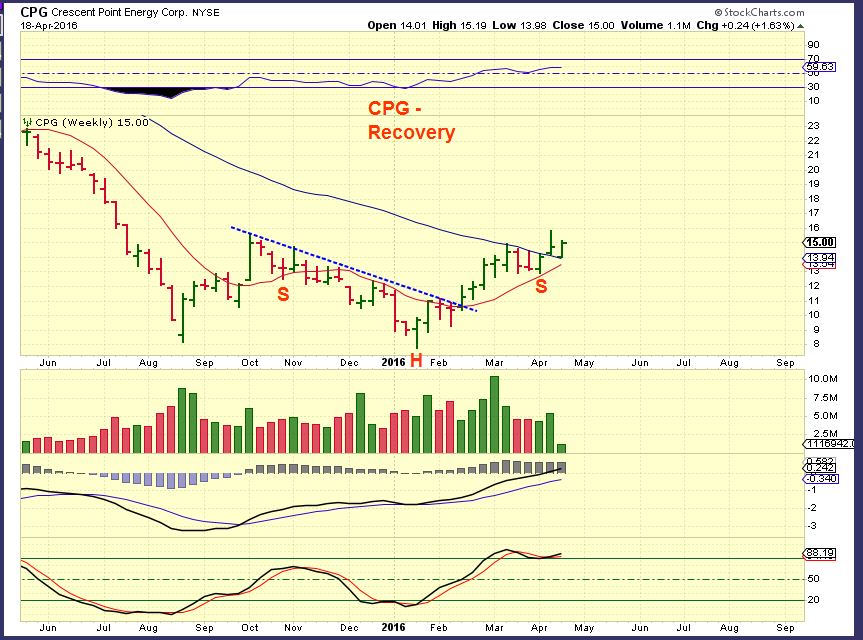
CPG WKLY – Now $15– It gapped down Monday morning to support, recovered and looks ready to run from an inverse H&S base. This also did not sell off when OIL sold off for 9 straight days.
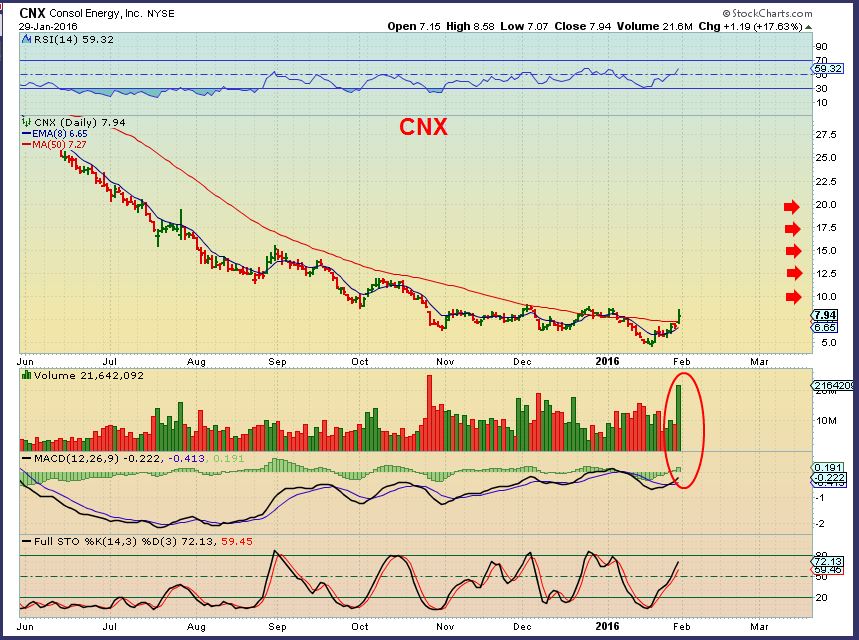
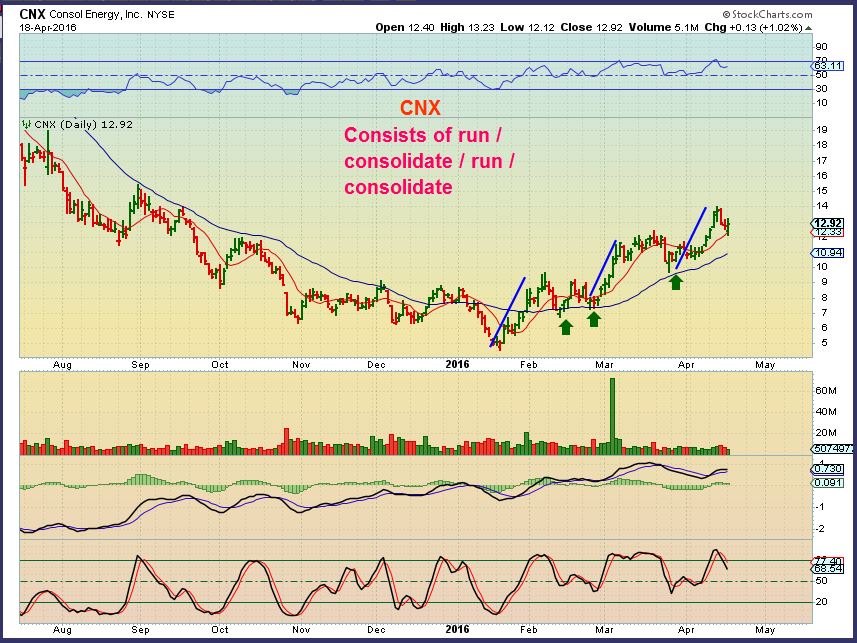
CNX- Breaking out from $4.53 to $8
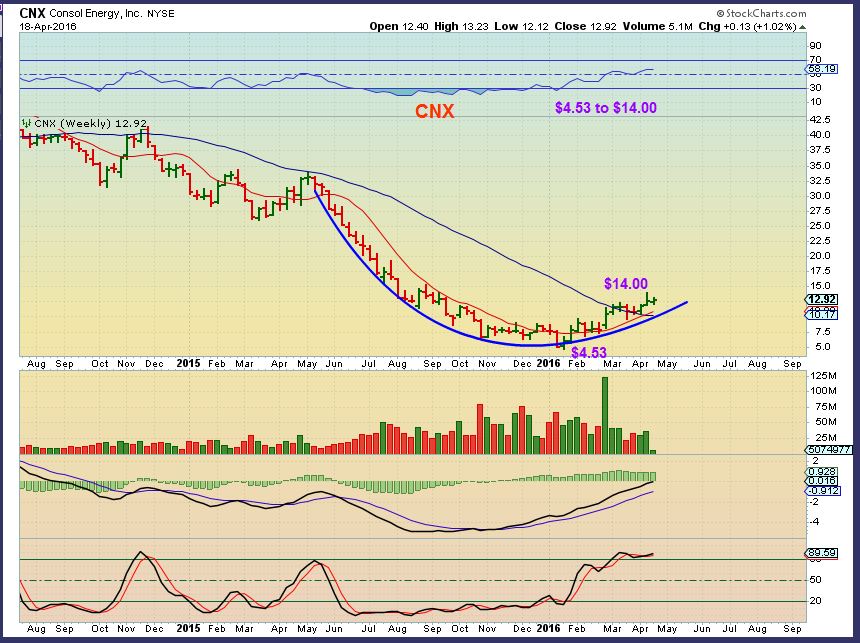
CNX WKLY NOW – When you look at a chart like this (weekly) it looks like we would say, ” I could have easily just Bought and hold that from $4.53 and tripled my money soon.” So I wanted to show you something very familiar to us now.
CNX DAILY – This was not just an easy ride. Patience in the consolidation phases was needed, sound familiar? I am showing you this to give you the visual of the day to day volatility in those consolidations. We rode consolidations in CLF, VALE, AKS, SID, and now AA. Also some energy stocks are jumping around and bucking us up & down, but longer term the recovery can be quite rewarding. Just use stops and remain alert. Look at the weekly chart above again 🙂
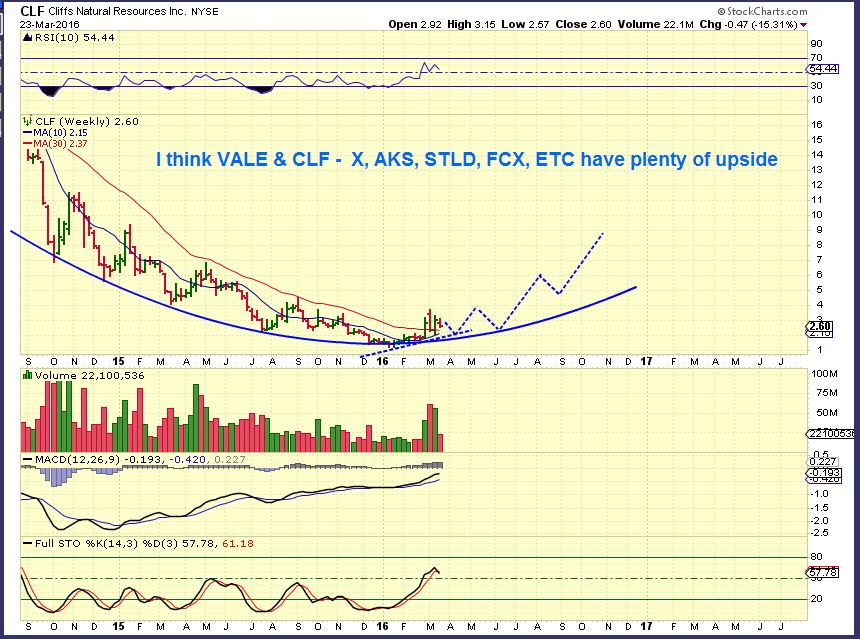
CLF – Do you recall this chart 1 month ago at $2.60? We probably all wish we could just go back, load up heavy, and ride out that consolidation phase knowing what we know now about CLF. It wouldn’t matter if it dropped 35 cents and then recovered, knowing what was ahead when it recovered.
.
SO again, ENERGY . Many stocks are recovering and OIL is early in the daily count for the 2nd daily cycle. Sometimes it takes a little sideways consolidation before the brek higher comes along.
.
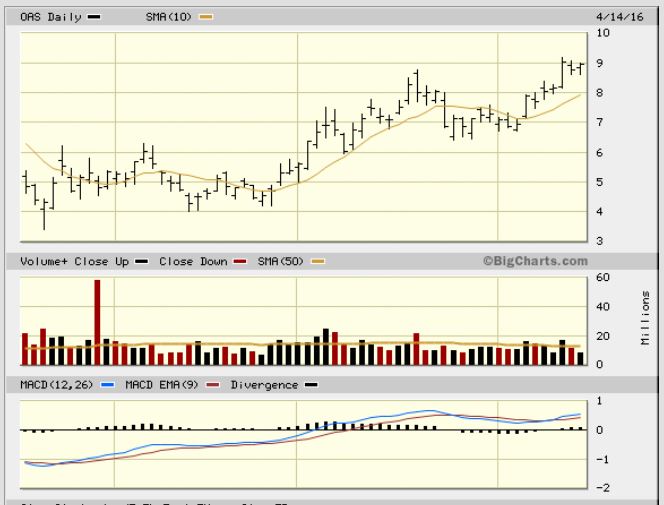
OAS – Roughly $4.20 to $9 since recommended. This chart was from the weekend report. Did it get crushed when OIL dropped 4% today?
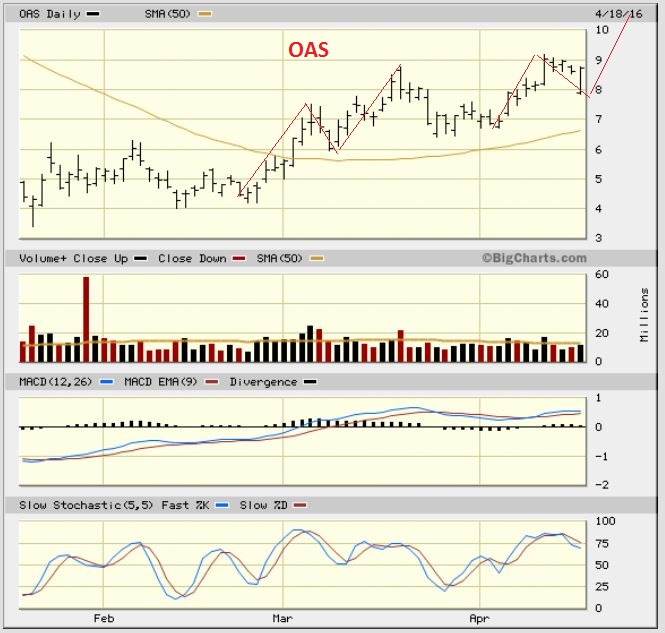
OAS – It did drop quite a bit, but it’s still a good looking set up. It went on sale today, but it would have been a scary buy until it moved a bit higher as the day went on. Even if someone didn’t buy it yet, it can still be bought here. Reminder: IT MIGHT continue to consolidate.
.
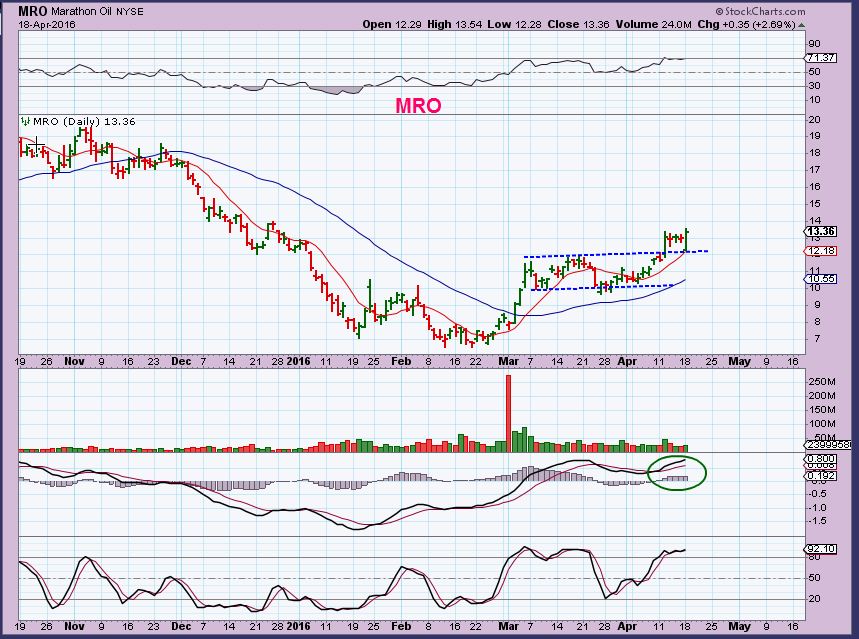
MRO– When first mentioned $14 was a resistance zone ( Keep that in mind).
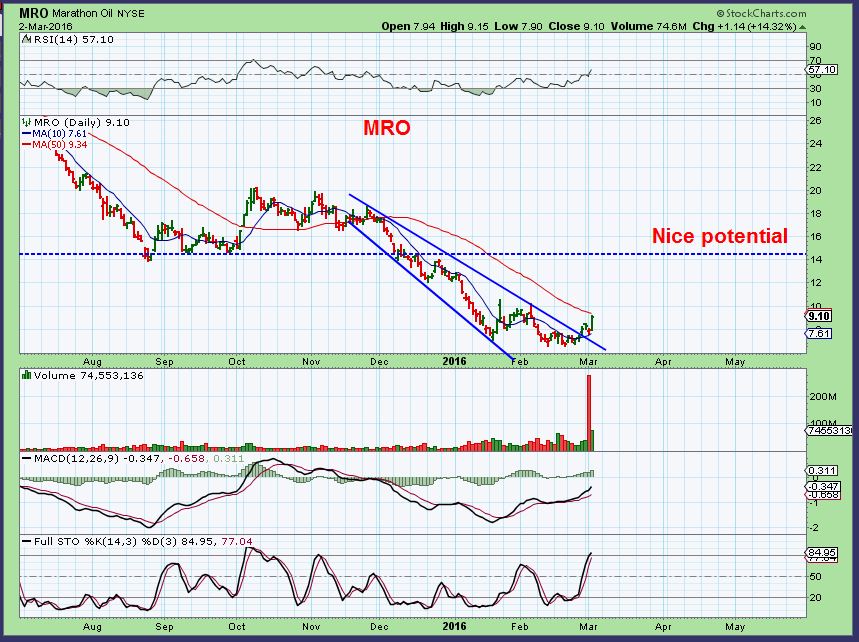
This was in last Fridays report, has anything changed?
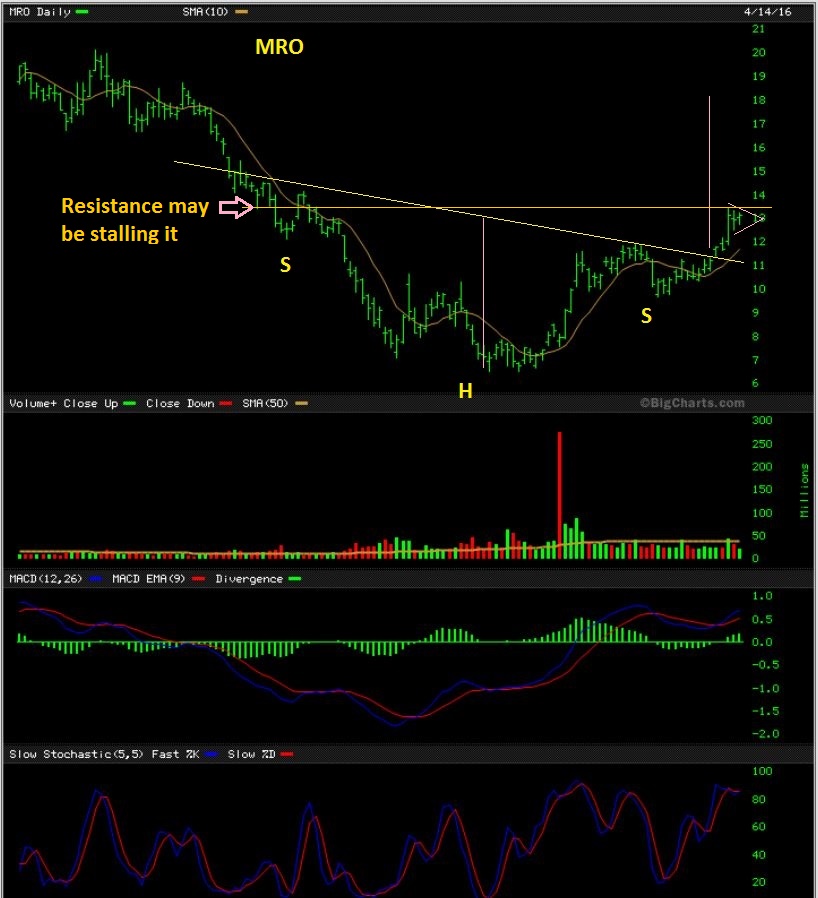
MRO Monday – Went on sale and recovered quickly. Volume was rather light, but that also means that it sold off on light volume when Oil was down 4%. Since resistance was at $14, it may be building energy to break higher.
.
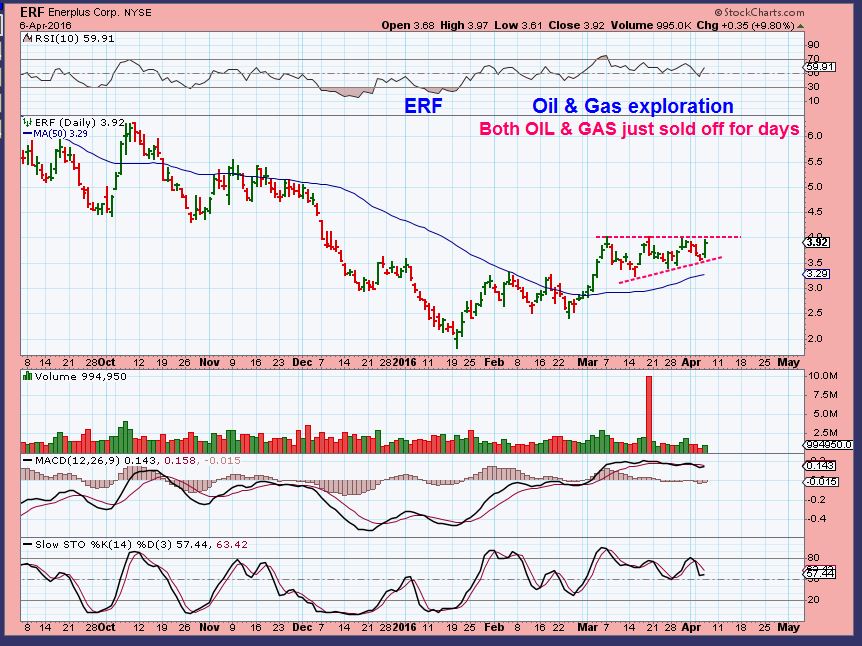
ERF March 1st- Notice the measured move to $4.
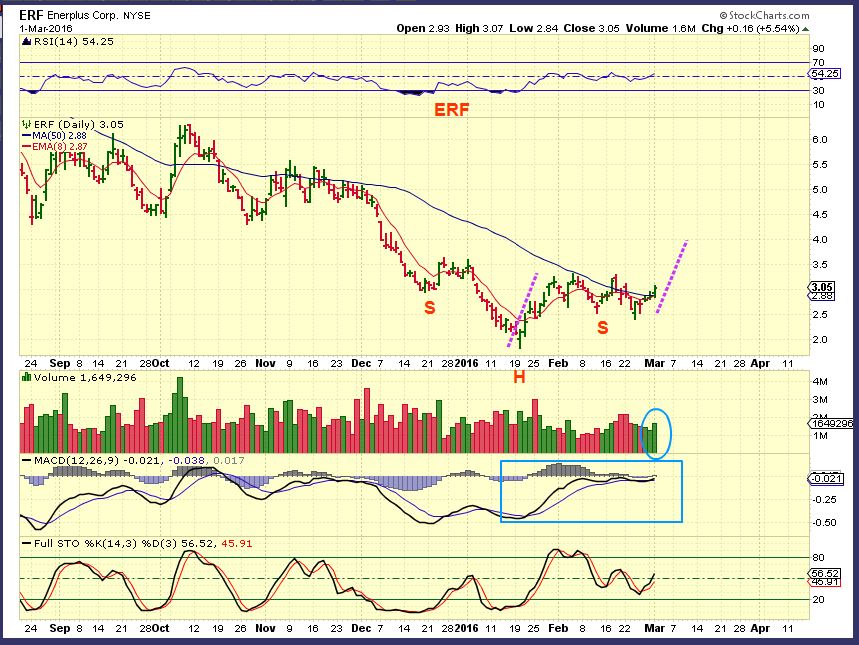
ERF – It ran to $4 and consolidated into a Bullish pattern. I recommended buying this consolidation, because OIL sold off for 9 straight days and this did not.
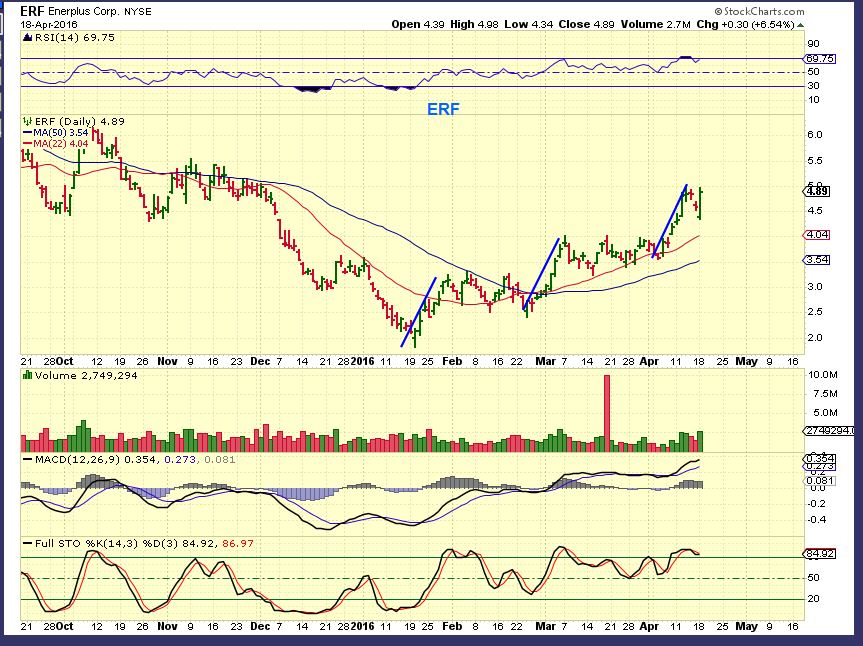
ERF Monday – After completing another measured move, it dropped today with Oil and reversed higher, actually closing up 6.5%. This has now moved from $1.84 to $5. Great gains.
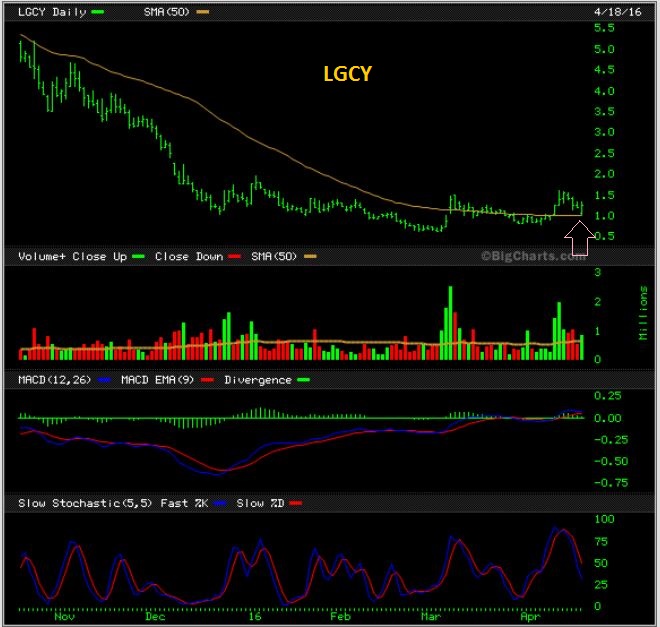
Finally LGCY– This energy stock moves in huge swings. It is scary at times, but this big picture is helpful if this is going to recover too. It was actually over $30 in 2014.
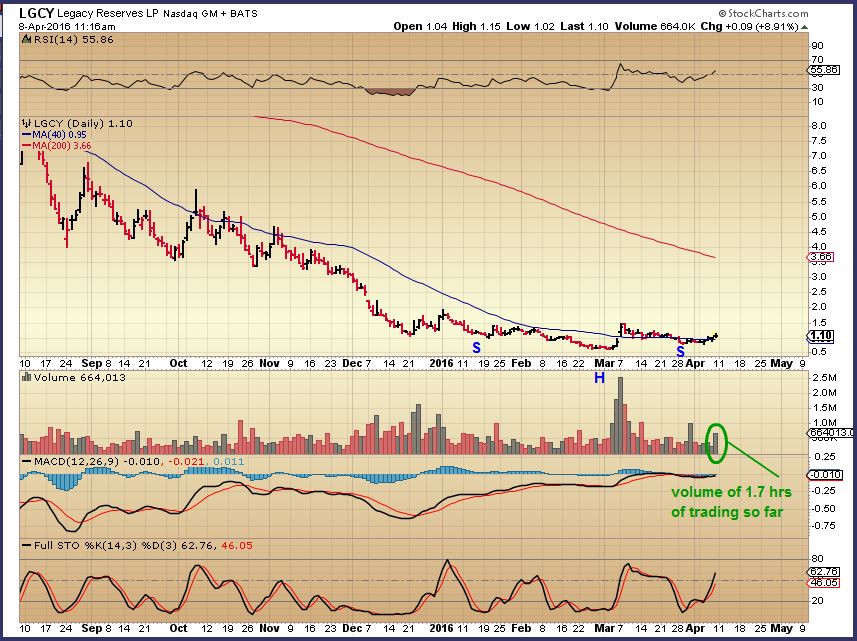
LGCY dropped to the 50sma and started moving higher Monday morning. It also ended up green for the day. Still a bullish looking base.
So please note that in every chart of a stock that recovered, it was NOT straight up. There were many boring consolidations. Mondays drop could be considered part of that process.
.
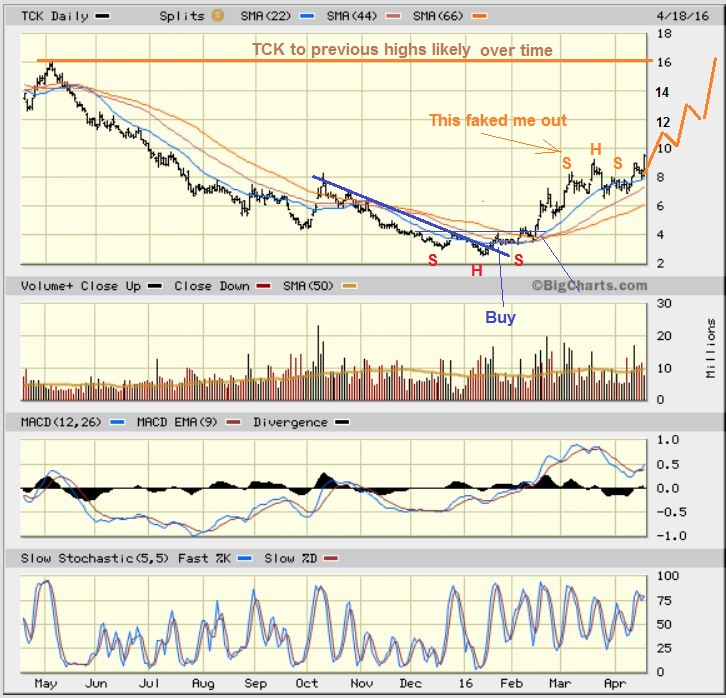
As a part of this lesson, I also wanted to show TCK. What a great looking run, but it too got a bit scary at one point in the consolidation.
Jan to Feb – $2.56 to $7.25 – NOT straight up. Notice the sideways boring moves and volatility.
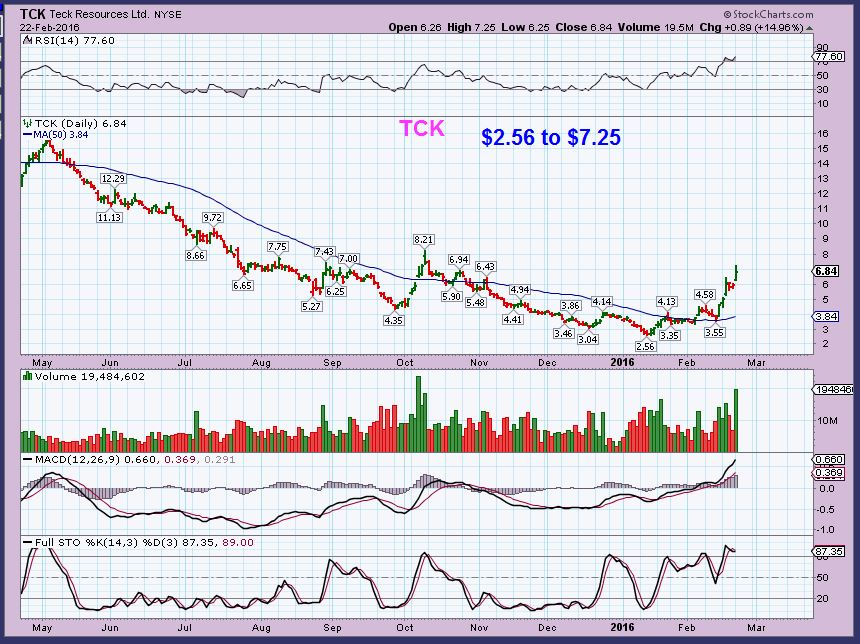
Then it got stuck under resistance and went sideways from $6-$7. That’s about 10 days or 2 weeks of trading.
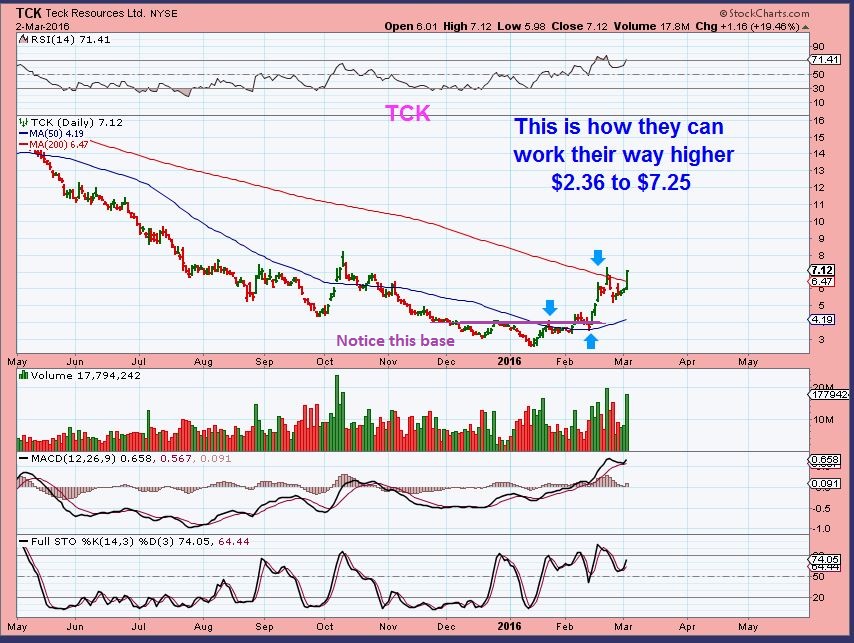
TCK Monday – Sideways for over a month now and I even warned about a possible H&S , but it never played out. TCK is now breaking out, possibly for a strong run out of this consolidation.
.
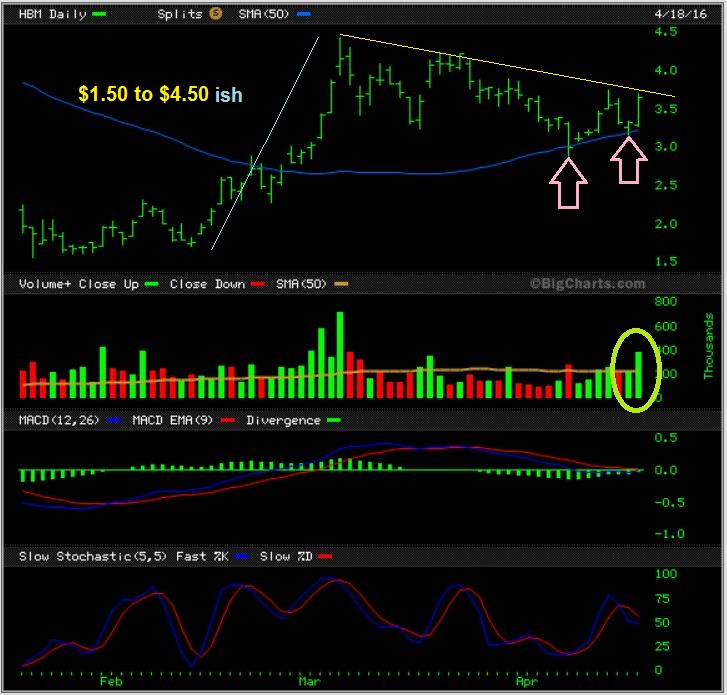
Finally – I found a new stock ( New to me, I have never heard of this company). Hudbay Minerals. They released earnings on Feb 24th , and the stock went higher. Their next earnings release is April 29th. They are mainly Copper Mining. Gold & silver also.
.
HBM – ( HUDBAY MINERALS) – I bought it as a trade since it bounced off of its 50sma and it just kept climbing. It has a long consolidation and a possible inverse H&S , so I will hold on to it until it tells me to let go. I see TGD, VGZ, AUMN, GSS, etc still running strong, so I will try this one until it lets me know that it doesn’t want to run.
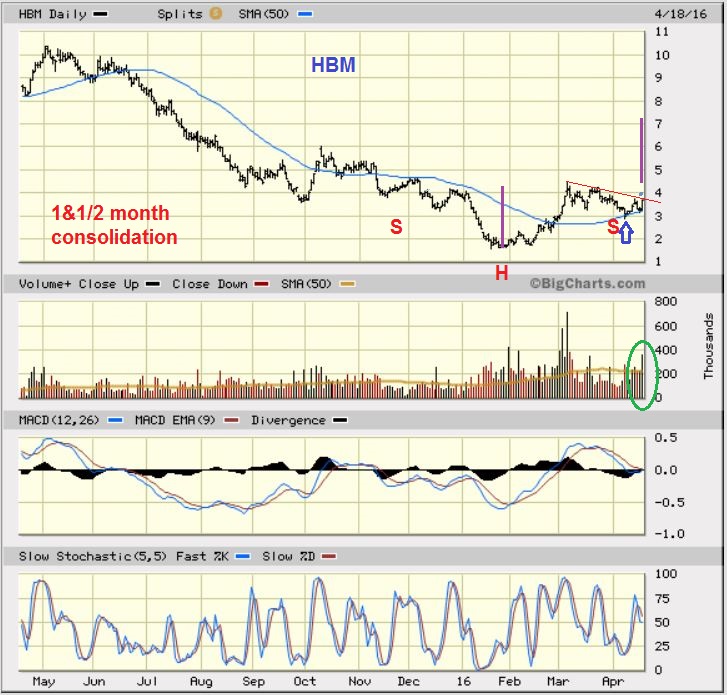
HBM close up– I think it may be ready to break out, so someone here also may want to trade it also? Just remember that it is a Copper / Gold Miner and could get caught in a pullback if Gold drops. You could use a stop under the 50sma, or just sell a quick POP if we get one. So far, trading in certain Miners has worked out well.
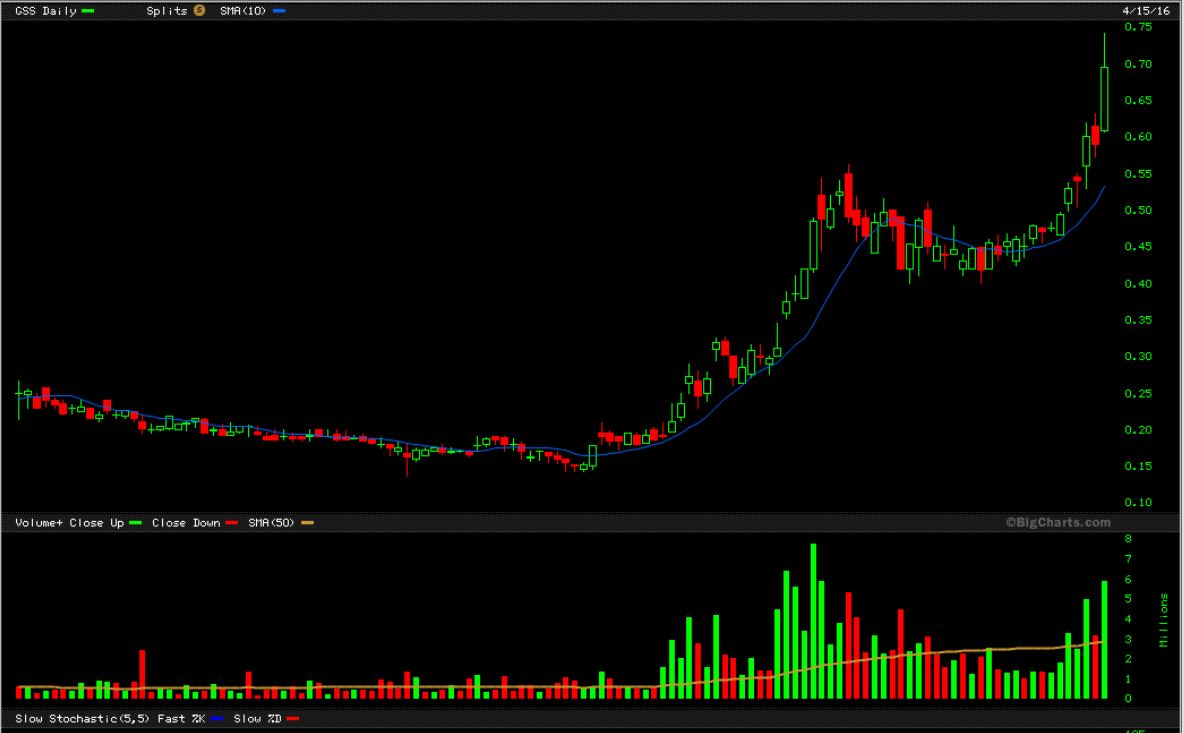
Like GSS in this chart from the weekend report. It continued higher Monday too.
.
FCX is a copper stock that has consolidated for over a month and also looks like it wants to break out higher. It might just continue to consolidate like AA has, so I’ll wait for the break out this time.
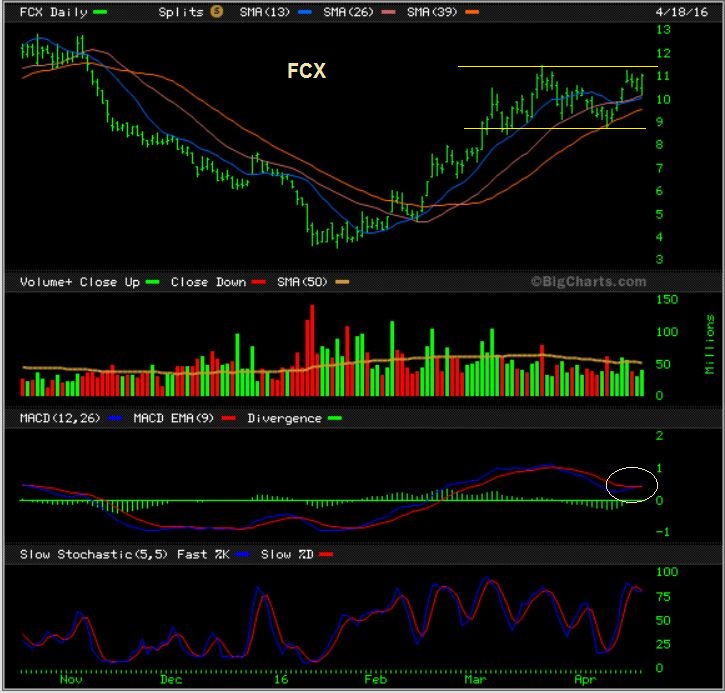
Again , AA is still consolidating. I own it at $9.70’s . Kind of Boring, but then again so was CLF. 🙂
.


Thanks for all of the great work with the site. I’m somewhat new to CF (<2 mo), but very glad I signed up.
I'm wondering if you have any thoughts on EVEP? It looks to have started basing at the beginning of December, and has put in a rock solid floor at $1.86 that's been tested 6+ times with several 50% bounces. If it breaks this sideways consolidation, it seems to have a lot of room to run…
Hi Dave – I was away this morning, really sorry for the late reply.
I looked up EVEP and I dont know anything about the company, but that chart looks awesome. $18 just one year ago and a solid base on a 1 yr chart.
You’re right about the base, and the result if & when it breaks out.
I tend to get in early on some set ups, and most would wait for a good break out so that they are not stuck inside a sideways move for too long. I kind of like it right here, see a chart below .
.
Hi Dave…. you make an excellent and perfect decision to signed up with ALEX.
This gentlemen is excellent…. oooh…. I hope he is not reading this.
Alex has a lot of experience and deals with ‘the most time’ the right answers.
See you more. Thanks for reading this.
Yours.
As always, nice write up!
Thx Moe!
Good stuff Alex! Lots of inverse h&s in energy names! Hopefully we hit those targets. ERX alone has a target near $38-40. Keeping my fingers crossed!
Crazy good looking set ups in many areas, huh Peter? 🙂
Definately. And the incredible thing with energy and metals is that everyone is STILL bearish! Hopefully GDXJ breaks out in that weekly chart and pauses to consolidate a few weeks. And for anyone interested, this should only be the first wave (A) in this move! The C wave is where the real fun is!!
Yes, I saw that weekly chart – nice. ( That is where it has failed before, so you know people are going to short it). If it just pauses sideways for a couple of weeks and more shorts keep adding on, and then decides to move higher again – that will be another nice short covering move higher.
CF, you showed a weekly chart on Gold back on 3-14-2016 that highlighted the ICL bottoms going back to 2013 and all the way up to 2018 cycle pattern…..can you send an update to that anytime this week or on the next weekend report? if so, thank you.
Hey Shermo –
I can, but I’m not sure which one we are talking about. You say it went to 2018? Like very forward looking looking, I dont remember that one. Did you mean 2018? Nevermind, I just saw that you dated it, I’ll go by that date and find it – have a good one 🙂
Thank you….
While waiting on the gold ICL, I have been in sgg, a sugar etn. Be careful as it is thinly traded, but sugar is in the middle of a wave 3 of 3 right now. May pull back some, but plenty of upside left.
Thanks Eddy.
CENX.. nice!
Yes, CENX is getting ready for that break I would say. Great volume for 1/2 day
My basket of shippers is doing well today 🙂
The shippers are set up nicely. They have had some good runs and still look like they want to move higher too.
CPST up 25% Yesterday down 23% Today. Do they make Yo-Yos? They announce after market they are adding more shares, diluting value. This has to take months to decide and work out details, applications, forms, etc. How does this stay quiet? And, what makes it run up the day before? Smart money forcing it up to unload? Not sure how that works either!
http://finance.yahoo.com/news/inplay-briefing-com-055139997.html#cpst
CF do you have any history on this type of event? I’m trying to decide if I should bail or hold? Anyone?
Bill – “Do they make yo-yos” – That cracked me up – LOL.
As you linked, they are doing an offering to raise money.
The DREADED OFFERING. I hate that, but I have owned Miners that have done that as soon as they run higher.
How can I find that date that they offered before? I heard they did!
I dont know, I’ve never seen it ahead of time or looked for one that far after the fact.
I wanted to see how long it took to recover from the last one? I don’t want to have dead money too long while the energy sector is exploding! Man that chart looked so good. I think I was duped.
It was a great looking chart, companies do this often to raise money and reduce debt. How quickly it recovers can vary, but I got caught in RBY when they did it.
From memory, I think It ran to about $1.40 and dropped to $1.20 on the offering, took almost 1/2 my gains back, I got in below $1. I will go back and see if I can see when that was ( A yr ago I think).
It took a while to bounce back if I remember correctly.
ooops, I went to look it up and RBY is gone. Buy out?
Well that can’t be good for CPST!
RBYCF now worth 4 cents….I got burned in that one.
WOW – Thx. I remember when big funds were buying that one.
I wonder why HMY is down when so many other gold stocks are flying? I’m not in gold now…been waiting for the drop…but just curious….
Saw a news report that there were problems with workers and expenses in Africa gold mines. Harmony is there and Australia and ? Maybe a factor?
Maybe that’s it…..good to know – I haven’t seen that report….need to look into which miners are in Africa and see if it’s affecting any others or just select ones…..:)
I did a report back in january or February saying how being an African Miner was bullish for them, that is when they took off higher and put in gains better than any of the others.
I listed HMY, DRD, AU, SBGL, etc.
There are certain risks, but the benefits were that they used the strong dollar to their advantage. They would sell gold for the USD ( Strong Money) , and pay workers & expenses in the RAND ( CHEAP), so their profits were getting healthy.
News blip was on Bloomberg early this am…These are the main ones with exposure in Africa but there are many more: Barrick, Anglo, Gold fields, Harmony, Ashanti, Rio Tinto. I just made a quick list, no time to research if true or not yet.
DRD and RIO both up much less than others also…..so seems there is definitely something in the news that came out that is at least depressing these a bit….
CLF just hit the AB=CD target?
Not sure what you are looking at, but I am watching for CF target area on his CLF chart from April 14 post [ I think]. He shows a resistance area and says he thinks it could go to @ $6+. Have a look at that chart.
Here is what I am thinking for CLF. Maybe a pullback here by 38.2%. Last one was 50% then probably higher again. refresh for chart
Thanks for the chart! I may lighten up a little if it moves back up a little.
Yes, I had 2 A-B-C-D targets Nancy, one was conservative, and one was the extended one, for both CLF and VALE ( Or any chart that sets up that way). That is why I usually sell partial at the 1st target and then may unload if it gets extended further.,
.
Attached is my chart for VALE – It shows where to take those measurements from
.
3.80=re-load! I love making the same money twice!
Really hoping Gold & Silver hasn’t put in a stealth ICL and left without me. Hard to chase at this point. I sold EXK last week, but at least there are so many other good trades.
Doesn’t look like a correction in VALE is happening, Re-entered today thinking it will follow everything else and continue to rocket higher.
GDXJ ans XLE attempting major weekly breakouts!!!
Notice the RSI B/out in XLE
Both “BB-Volatility-Squeezes”, Mar-2015 and Nov-2015, have “head fakes” down first. But after 9 months the “for real” move eventually prevails: up, up, and away!.
GLD Daily chart: if the big “bull-flag” / “channel” in March-2016 is drawn: then the 8 days through yesterday: a “break-away” up with a quickie down “oh wait! a goodbye, for now, kiss!” of the channel/bull-flag top. then the open today: the break-away up continues. Maybe up and taking out the March 04-2016 high at 122.37. {`_` } .
The GLD Daily chart going back approximately 1 year: approximately 20% of the days are gaps. The Dec 2015 low is an inverse “head & shoulders” low complete with an “island” bottom day. Gaps are common with instruments in which “the sun never sets” on the underlying asset, as is the case with gold. I want a big bar of pure 24K Au to bite down on. lol. {-_- } .
Will the GLD Daily gap today be filled? Probability is very high that yes, at some point, sooner or later. The attempt 2 days later to fill the gap up on Feb 08-2016 did not totally fill it.
love cf’s pic pick for “Perspective”: genre of M. C. Escher.
From Daves first comment of the day – This is actually a really nice looking set up. Thanks Dave!
.
P.S. Earnings released at the end of Feb, so the next time likely will be End of May.
.
Refresh – AAnd I know nothing of the company fundamentally. Great chart
Alex… Hi….. where is the first resistance in NG? (2.10)
I’m in UGAZ, always I make the BIG mistake to sell it to early or sometimes to late .
Thanks a lot ALEX !!!!
Hey Geurt!
I believe that we are getting a strong break higher in NATGAS . $2.10 would be an upper resistance, but after this consolidation and the action today, I think NATGAS will break right through it.
If I had taken a pretty large position just hoping for a POP and then I was going to sell? I might sell a little to lock in gains , but I think NATGAS is going to run with Energy / Commodities at this point., so I would keep some and let it ride.
Thanks my dear.
This moment I’m break even, I think 100 dollars profit.
Has just 200 shares of it
I’ve watched VGZ, TGD, GSS, etc setting up to break out and run, and as a trader, I could take some trades even though it is within the timing for a dip. I pointed out TGD the other day and it broke away and ran strongly, so …
‘Today I’m looking at BAA in its consolidation. Risky at this stage of GDX /GDXJs run.
3 Month chart, volume starting to swell, so I am taking that trade. It is risky at this point, but I like my chances ( I already own this as a core position in the teens, I am talking about a swing trade here).
.
Refresh
.
P.S. That HBM trade in this mornings report is really shaping up too. It hasnt even broken out yet, I got in early. I still think it could move a lot higher.
Anyone took ECA from yesterday?
Not me, but it looks good.
Many of those slam down reversals turned out to be shake outs and buying opps.
Alcoa also trying to breakout this week, and it’s looking mighty good AB=CD points towards nera $14-ish…
I have been in that one watching the paint dry for a while, now lets watch the price fly.
.
Both CENX & AA breaking higher today .
There are plenty of nice setups.. no need to be chasing miners really. If those reverse h&s end up playing out in energy, THAT’S where we wanna be. ERX meas. move to near $38?? What else can we ask for?
Whip cream and a cherry to go with that icing on the cake? 🙂
Idk, really felt like I was missing out today. Ok, still have a 1/2 position in EXK and AGQ. But not nearly where I would have been had I had any idea this rally would have gone like this!!
Hi Alex,
Hope all is well.
You highlighted EMES in a previous report. Just wondering what your updated opinion on it might be. thx
Hey Curtis,
It is still a good set up and a really nice base, but it’s only up 2% today. Not sure why its not participating as much as others.
It did run $2 to $6 and is still in the $5 area, so it’s not falling apart, just seems to be consolidating.
BTW Alex, either my luck has changed for the better, or I have gotten a lot better at spotting moves since I came back to CF. I don’t know which is it!! But I definately owe part, if not all, to what you put into your work. You should be proud of yourself man. Very thankful to be here. Show this to your niece!! 🙂
Thank You Peter,
And seriously, from what I see in the weekly/ Monthly charts- I think we are going to do very well for some time to come. Set up after Set ups may just keep popping up. 🙂
I am Happy for you, everyone else, myself, and little Kiara 🙂
UNG breaking out above that little $6.80-7 area. BTW, Gartman said yesterday that oil would hover between $32-$42 for the near future, so we should at least see $50 by May!!! Did not put his life on the line again though..
Ha HA, No doubt he came out and spoke now , so that THAT is the last thing people remember him saying.
.
Then OIL goes to $50 this summer and they say, “Gartman was right, it spent a little time in $30’s before shooting higher”.
How about Nat gas. She had lulled me to sleep then BAM! I’ll have to update my chart tonight!
Man, energy charts are looking VERY strong! Hopefully we can keep it going!!
WPX stopped at upper BB to the exact cent. Even in pullback never went below 20 day, reacting off 10 day now.
You taking anything new? Worried about diversity – have CLF, VALE, AA, WPX, BAS, OAS so not sure I want more exposure there in case something changes??
Not buying anything new really. I did buy HERO today, but thats been it. This is just a guess, but miners and metals have led the commodity charge, so i’m thinking they top ahead of other commod’s. As it stands right now, GDXJ, for example, is breaking out BIG time in the weekly chart, BUT, the week is far from over. Let’s see if it can b/out. XLE and a ton of oil & energy names have very strong looking charts, and not as stretched as gold stocks. Maybe energy can keep rallying into May?? And the moves in these names are just as wild as in miners. I already have a lot of names with strong charts and very nice upside potential, so I’m not really adding much. I would add to my positions though on a move down. Other than that, just letting energy run.
Nice. I grabbed WPX and OAS bc they are more stable than some of the real low priced ones, don’t go down that much with oil! I’ve tried to call a GDXJ top 3 times and it ain’t worked yet so not doing that today!
How many times have I said that HERO looks awesome? Sweet chart
Alex, just great looking breakouts in FCX, CLF, VALE, AA, AKS today. Feeling really grateful to be part of this community:)
Thank you Kathleen – Seriously, I’m very glad to have you (And everyone) participating in some great trading conditions. 🙂
#Killin’It
Good night All!
Will be hopeful and on the lookout for gold and silver miners to put in a big pop and reversal starting the ICL.
Should be a nice candle this week I hope
I know, right?
This run has been a killer!
Go enjoy the evening with the fam !!!!
Hello Alex – for something like LGCY, where would you place your stop?? Let’s say your entry is 1.10, would you put a stop about 10% below? Drawback is getting knocked out before the move up takes place if your stop is too tight. Just wanted to get your views on stop levels…..thanks!!
Alex made it sound like 50 day should it in his report. Some of other energy have held 10,13 SMA like WPX and OAS. If you can afford a few cents below that, do it to give her room but that is based off of your risk tolerance and position size. GL, setting the right stop on a volatile stock may be the hardest part of this game.
Good call, I just read this after I replied : )
Just trying to think like a Freak! Wasn’t sure if you’d be back later. Figured when the Night Ranger got on (that’s me) I could bat clean up if I had something to say.
How about nat gas? Out of nowhere!
I usually dont check back here late, because its hard to follow the thread – lol .
I’m writing the next report now figured I’d check out the top of the comments and saw some new ones
yes, NATTY needed to POP like that. Sweet.
Hey DJD-
LGCY is my hardest ( or one of the hardest) to trade for that reason. It swings like a major league batter in both directions. Some are easy, others are tough, LGCY is unpredictable at times. Mine is a mental stop, but I dont think that it should go below the 50sma again, but that is $1.00.
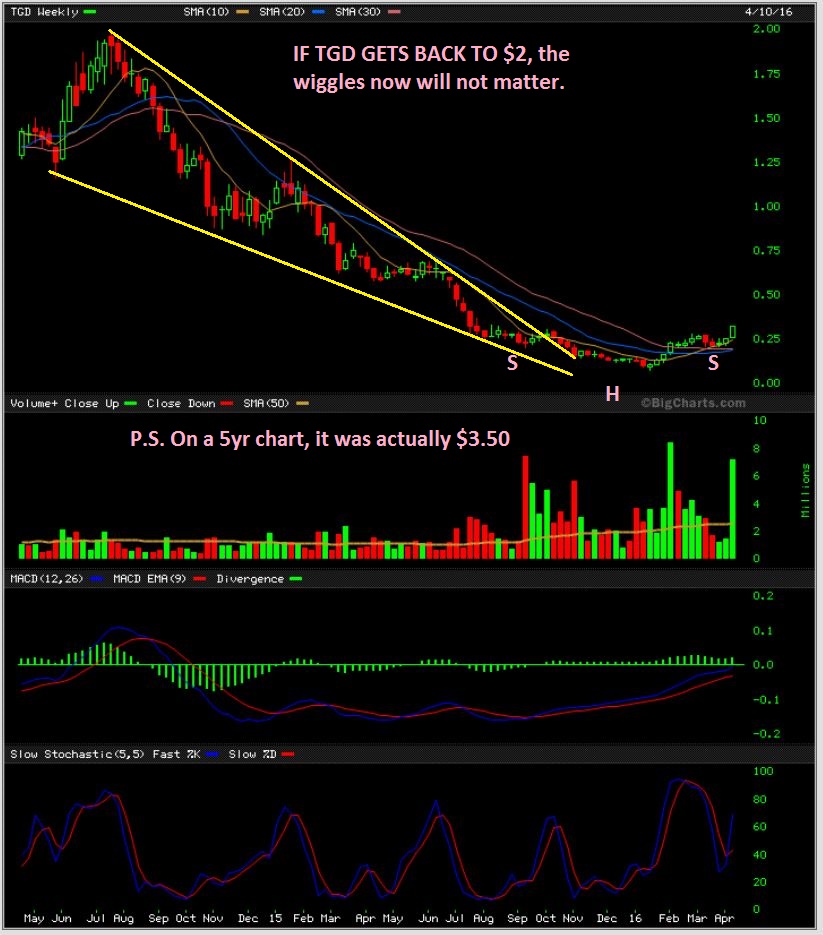
Lets just hope it takes off to $2 and we dont have to worry about the wiggles, but for now I’d say the 50sma ( About $1).
hi, chart freak, I just joined as a prem, member over the weekend, I found you on stocktwits, I am very impressed with you. let me tell you a little bit abut myself. I have been kind of a parttime trader for , well back when ameritrade was datek. I lost a ton of money in the beginning and was just about ready to give it up, cause I am not the smartest man, like you talk fib. and all that stuff, I don,t know if was blind luck or fate but I made a large sum on rlyp. I don,t want to bore you with long, long long story. anyways thanks to you I have already paid for my subscription, I can tell you if you want me to. have question for you alex? tia richie
Hey Richie,
Thanks for joining us here. Let me tell you a story too ( Datek, that goes way back). I started trading with the DOTCOM BUBBLE. I made very big gains, and gave them all back over time . I got chopped up when the market topped, I sold the drops and bought the tops quite a few times.
I consider those losses the cost of my education. Doctors pay a high tuition, Lawyers pay a high tuition, and we all do too, but if we learn from those lessons…. We can make it all back.
Most of all, I am glad that you made ur subscription money back !! : )
good morning alex, I made my sub. money back by looking at your charts[I am not real smart at reading charts ) but what I want to ask you is, I was already in mro and john kildorf, who I thought was and expert on oil said it was going down, ilooked at your charts and saw what yiou stated. I doubled down on mro. charts I believe ae the key to the direction of the markets. another quetionn, how do you know when to sell. ? part of my problem is riding a stock all the way up and all the way down. thanks richie
i’d be interested to know what % gains vs losses that ppl here consider successful.
at the mo.. im giving back 1 for every 2 made, which im trying to develop strategy to improve upon.
Doing a little homework going thru some charts. I really wished I had seen HERO a couple days ago, because the perfect spot (other than the initial break of the 50 sma) to have jumped on it, would’ve been yesterdays breakout above resistance. Still, a measured move of that break coincides with the 38% retrace of it’s entire move down: cents away from $6. As long as it holds above that break of resistance, this is a beauty!
Hi-Ho Silver!!! Highest close since last May. Clearly a breakout on short-term charts, what could the weekly say.
WPX continues to impress by not going down when oil corrects.
*Refresh*!
Seeking Alpha had a news article out last night about Chienere and LNG exports. 35B cf so far. Chienere data likely part of nat gas push yesterday. On the fundamental side, US is awash in gas, well over 5 year average. Why? Fracking. Although called ‘oil’ rigs they produce 80% crude, 20% gas. So really need to follow gas rigs plus 1/5 * Oil rigs for true count. So lowered US shale oil production courtesy of Saudi is now lowering gas production and now we’re starting to export to lower glut. If we get forecasts for a hot summer, this could start to move upward. Also will sometimes trade in sympathy with crude, which is bullish right now.