
What has been working lately?
The markets have been quite volatile and choppy, and that can be difficult to trade. At chartfreak, we’ve been focusing on bases and up trends, so lets do a market review and discuss this further.
.
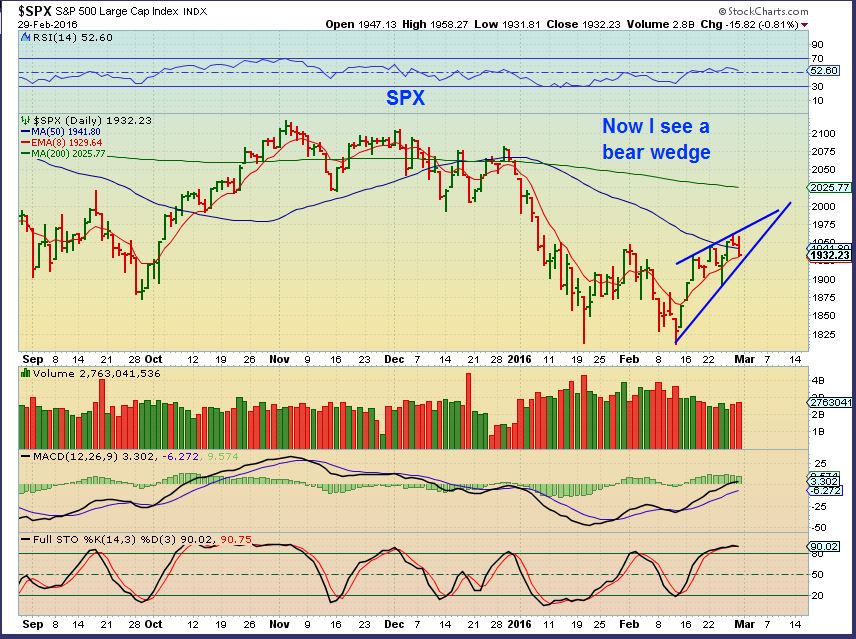
SPX– I’ve been saying that I expect higher price, but this has been quite choppy. If we dont get a surge higher soon, this could become an overbought bearish rising wedge.
.
I’ve been saying that I like OIL and it is still improving, closing above the 50sma.
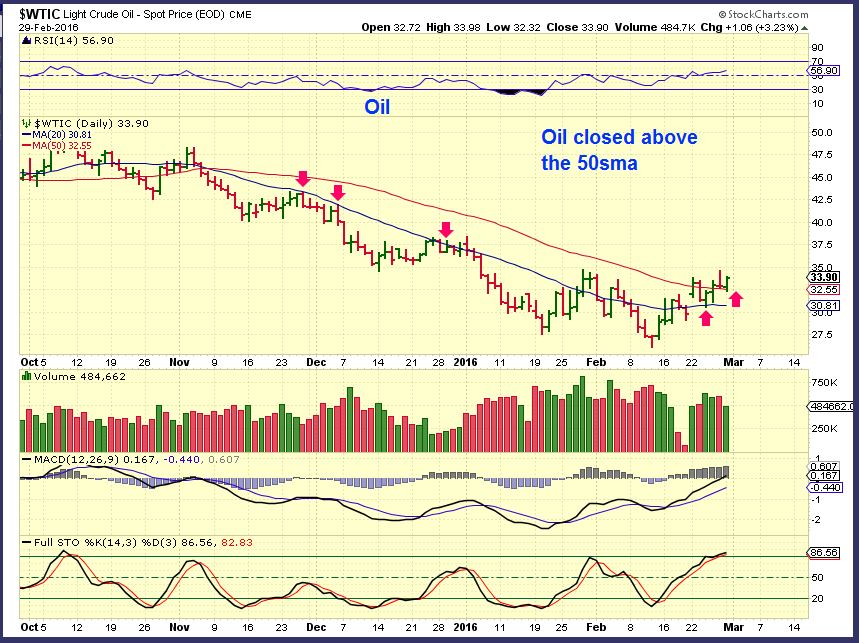
I had mentioned that when OIL dropped to new lows in mid February, the XLE and some oil stocks made higher lows, and that was bullish. Monday the XLE dropped while Oil was up and I’m not exactly sure why. I looked at XOM & CVX and they dropped, but several of the smaller companies actually looked bullish. We need more time to explain the XLE.
I’m going to show a couple of set ups in Oil, but these are really for ‘traders’ that can keep an eye on their positions. They are volatile and move fast up or down. NOT the safest trades.
.
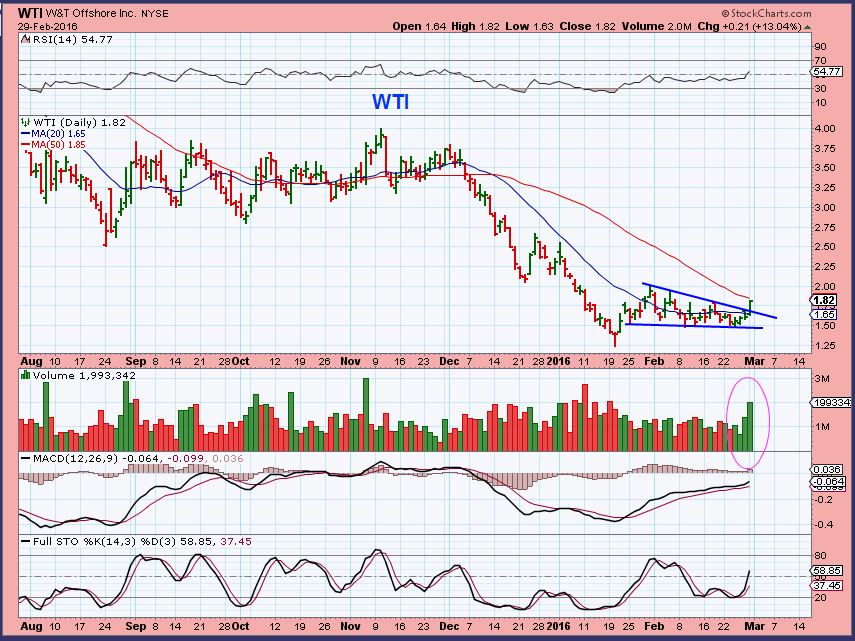
WTI – this was a stock that I mentioned a few times as Not breaking down when Oil made new lows. It finally popped, but the 50sma may act as resistance. Personally if I was trading this, I’d buy this break out and place a stop below the triangle.
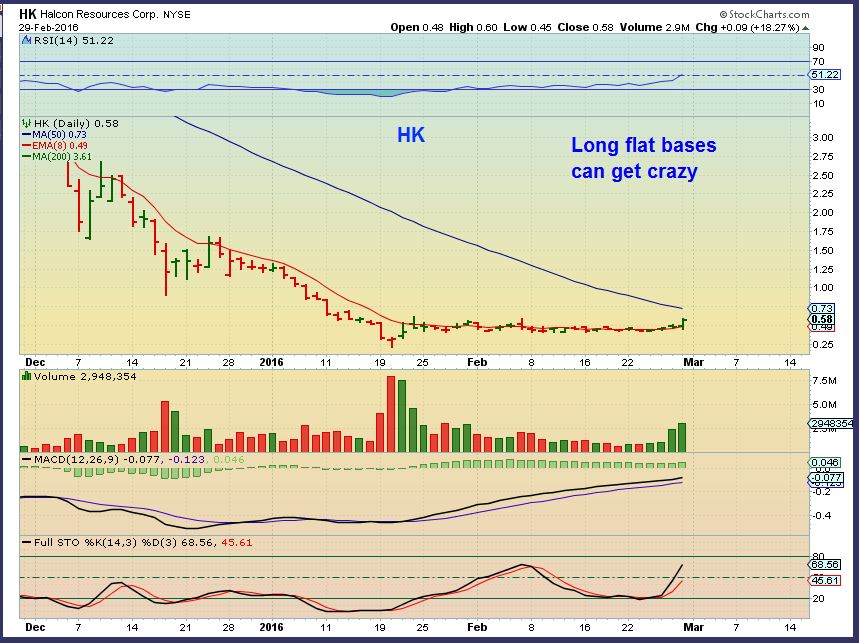
HK– I saw the volume surge Friday and almost just took the trade expecting follow through, but this sector is unsteady and I didn’t like the risk over a weekend. Flat bases can break & run nicely however.
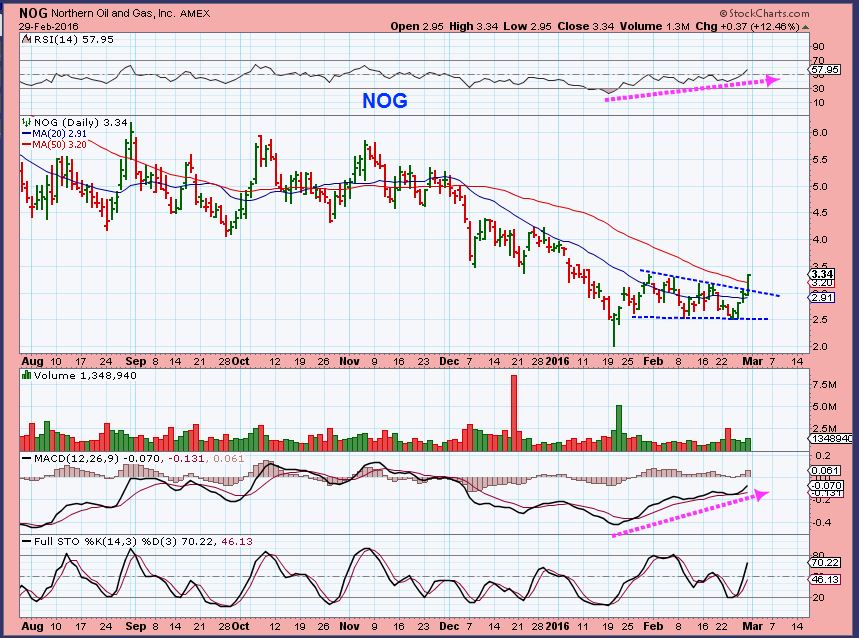
NOG – A trader could buy break outs like this and place a stop below the upper trend line. Dont get greedy with Oil stocks yet. I’d lock in gains and walk away sooner than later.This could go $3 to $4 in 2 days. Maybe $3.34 now to $4.50 in short order. Big gains in short time.
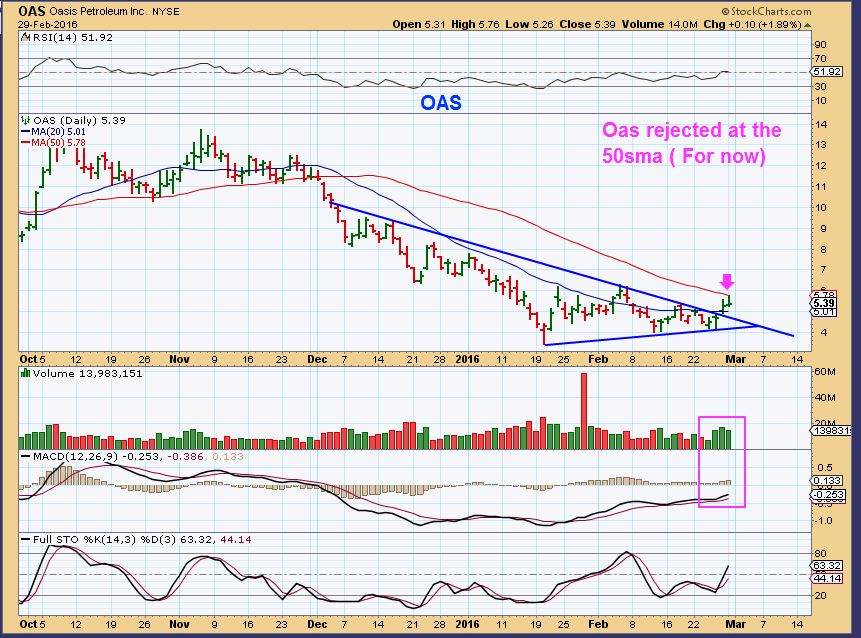
OAS – Popped but stopped at resistance. This doesn’t look like much, but it was roughly $4 to $6 . It could break out and run nicely if Oil has bottomed.
.
You probably have a list of Oil stocks since we have been trading them in the past. They are higher risk , since some have heavy debt and could be struggling to stay afloat with low oil prices. This is not for everyone, but for experienced traders in front of the screen, these pops are nice catches for a quick trade. Look for the above patterns and bases. We used to watch BTE, BBG, ANW, DQ, AXAS, AREX, PEIX, HAL, VOC, MPO, NBL, MRO , ERF, MDR, DNR, etc, and some are set up now similar tot he ones above.
.
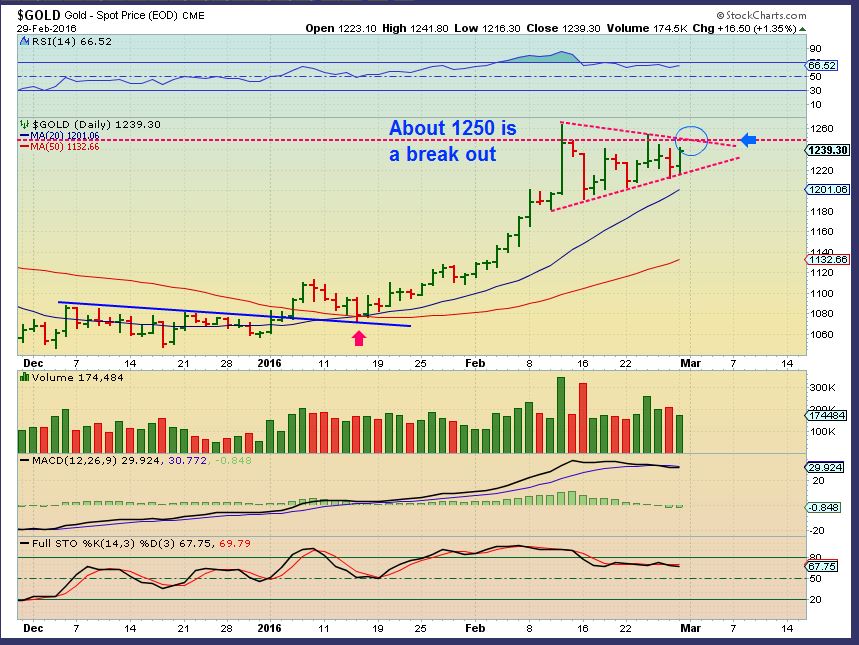
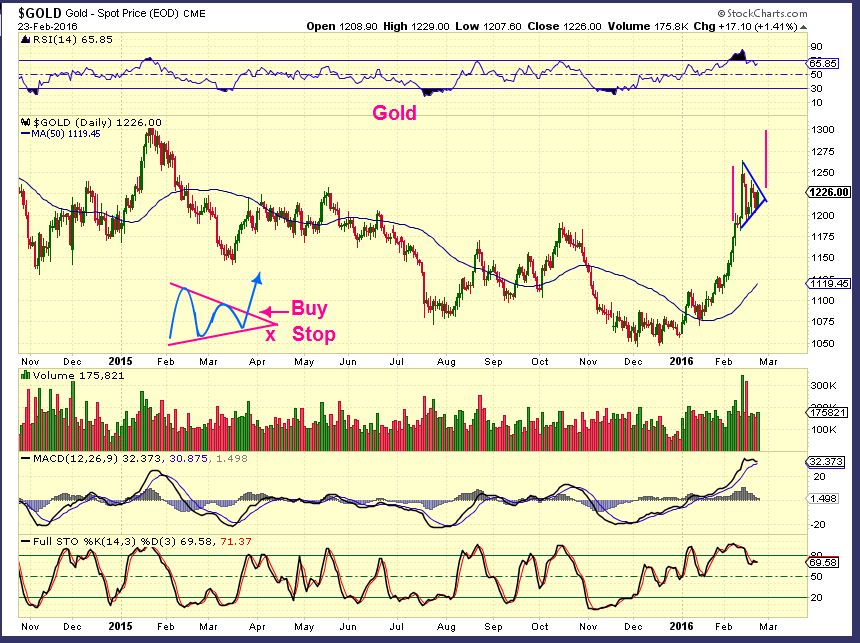
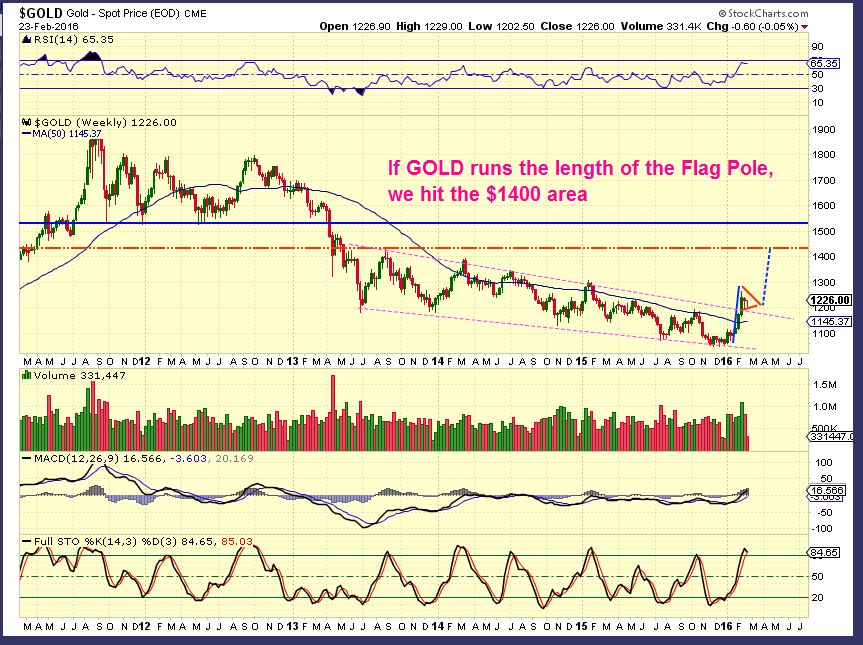
GOLD – Gold tagged the $1250 area overnight. That is the top of the flag that we’ve been watching, so Gold may still be stuck inside of this pattern until we get closer to the apex. THUS GOLD MAY POP & DROP TODAY (SHORT TERM) IF THIS FLAG HOLDS IT BACK. This flag has eased overbought conditions and that means that Gold may break higher in time .
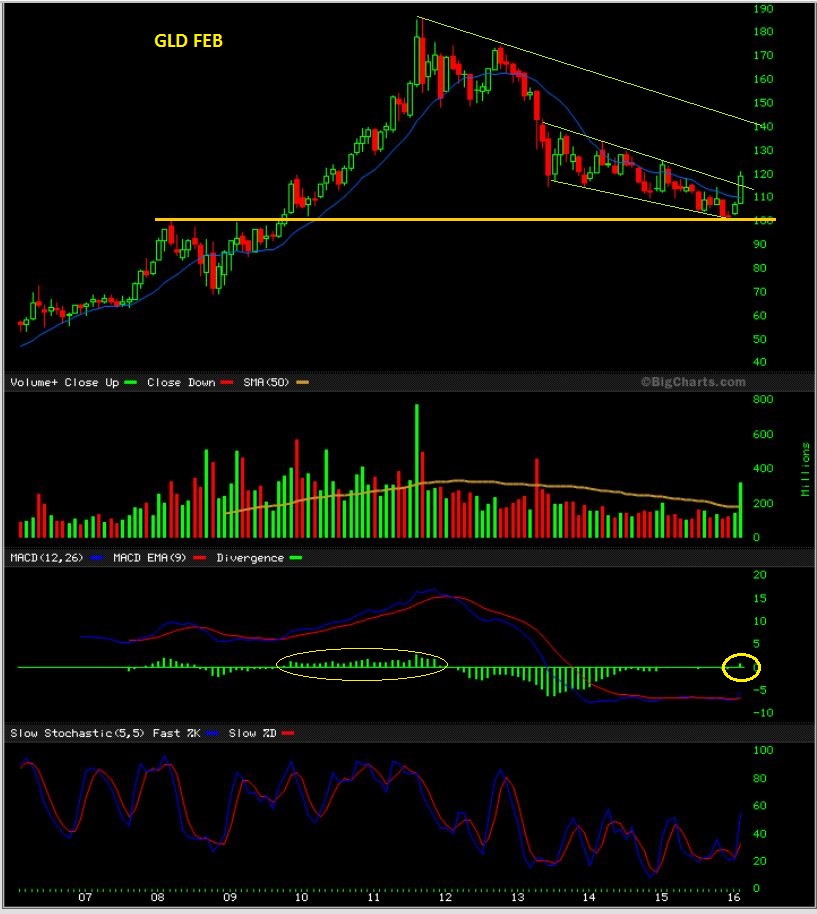
GLD Monthly ( Feb ended Monday).Thats a bullish chart .
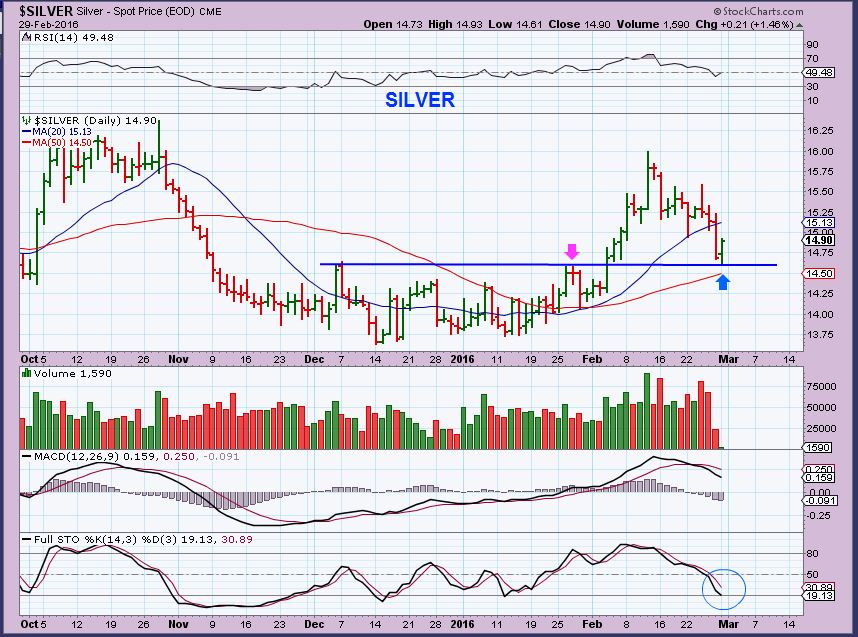
Silver- Silver actually dropped Monday and then bounced off of support. This can be viewed as a test of the break out and also may be relieving overbought conditions. ( I don’t know why volume didn’t appear correctly here).
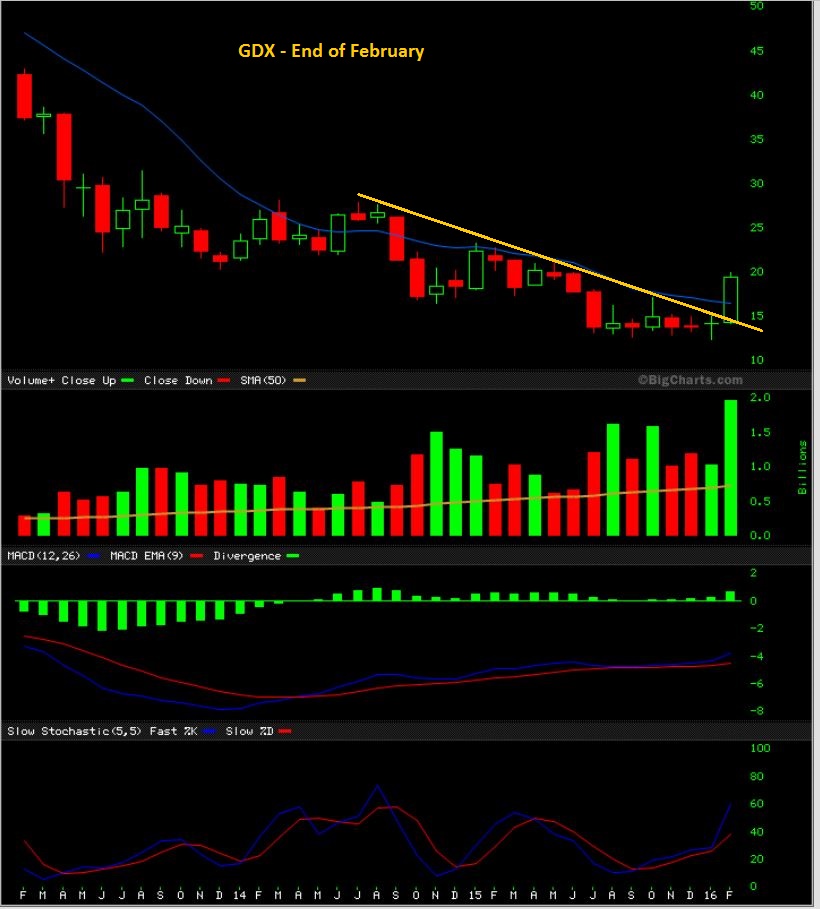
GDX Monthly since Feb ended Monday. THis surge with that kind of volume is exactly what you want to see.
Dilemma
Are we pausing / consolidating before we get another move higher? I mentioned in past reports that I had reason to believe that Gold would break $1300 before dropping into a longer consolidation period. I dont want to sound too crazy, but when I use technical analysis and see this flag relieving overbought conditions, I see reason to believe that GOLD could run to $1400 before a prolonged consolidation. The Dilemma is that GOLD CAN drop from the flag and find a short term low too, so we are in the middle of a move that is not 100% predictable. People want to buy, but I cannot say that it is all low risk.
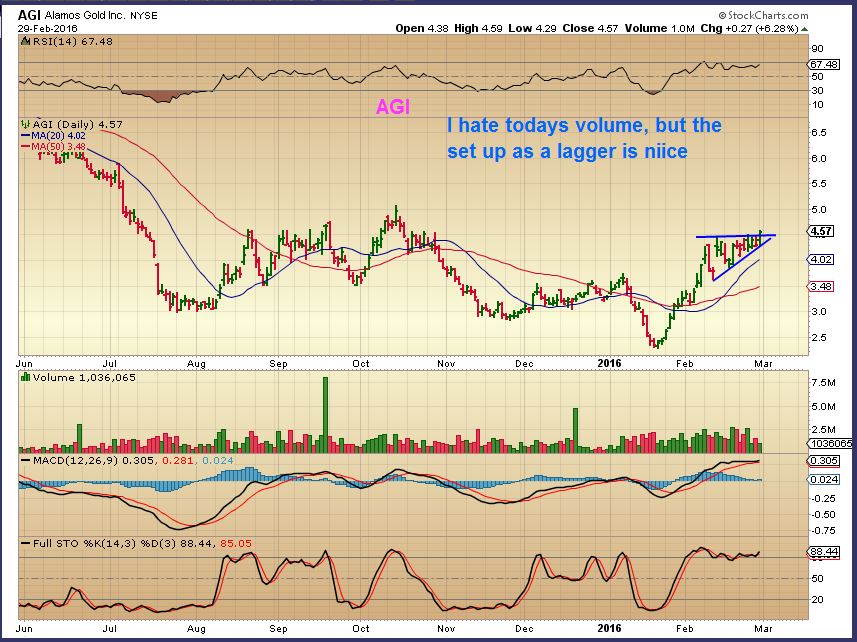
My idea of selling 1/2 of my positions and riding some and trading some has been working very well. I can look for what appears to be lower risk laggers and share a few, but I still need to say that this could get tricky, be cautious.
I will re-post this chart as a trade idea too. The lower left shows you that in a flag, one usually buys the break out and puts a stop below the apex. You can gain confidence if Gold breaks out.
Then I see set ups like this and they look fairly low risk, but remember that above I said that GOLD MAY POP AND DROP TODAY, inside the flag with a top at $1250. If Gold pops and drops, we may get pull backs to look at.
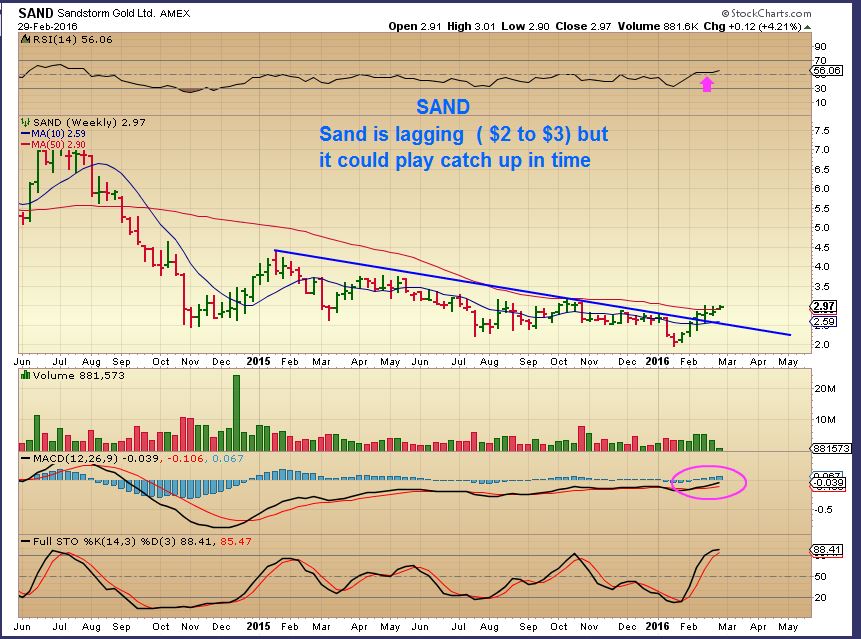
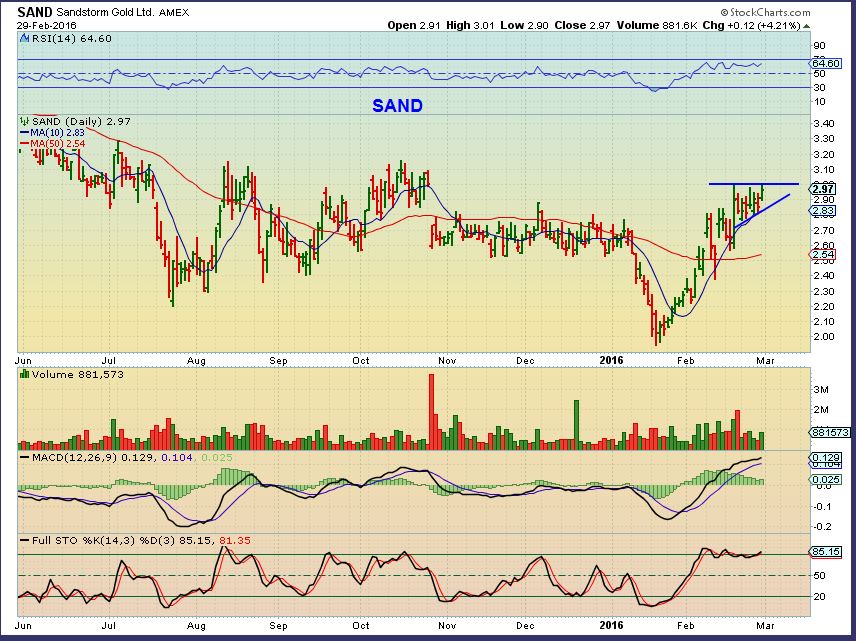
SAND lagged, this is a weekly.
There are other ideas that I will keep an eye on. I still like SWC (Platinum/ gold stock) for example. I had this chart for the weekend report and didnt post it. If our current flag ended up being a 1/2 way point, we’d hit near resistance at $1400. This is not the MOST likely scenario, but possible as the RSI would become embedded.
Let me just post some updates on some of our other trade ideas. I had mentioned FCX, VALE, X, AA, AKS, CENX, etc. etc. as bases that were buying opportunities that looked promising longer term too.
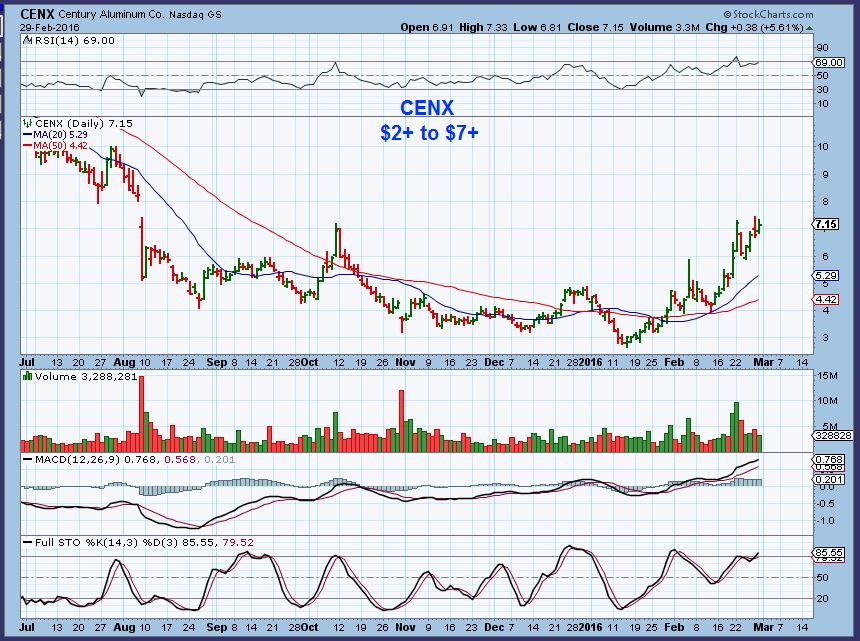
CENX – This is just to show the upside potential. Cenx continues higher.
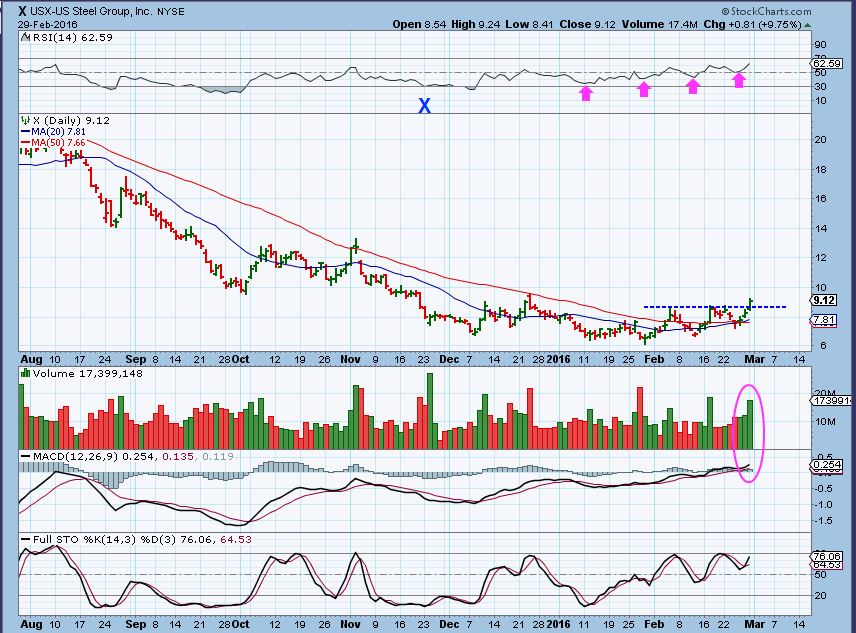
X – was a buy inside of its base above the 10sma. I think that it is still a buy as it breaks out here, especially if it pulls back. That volume shows good buying interest.
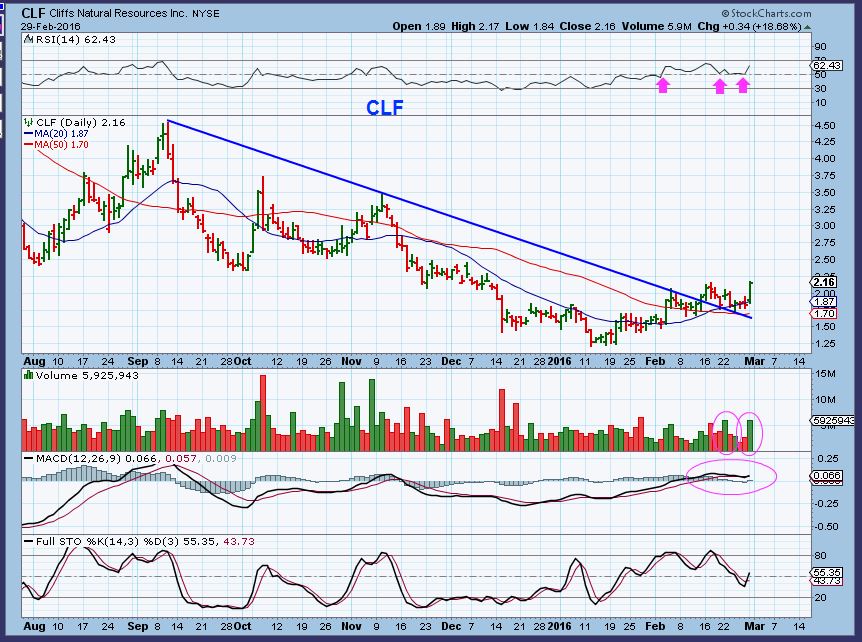
CLF – This was a buy on the 16th and then it tested the break out. It became another buy opportunity Monday when it showed follow through. I like this CLF set up. If commodities bottom, have you seen a 5 yr weekly of CLF? $90
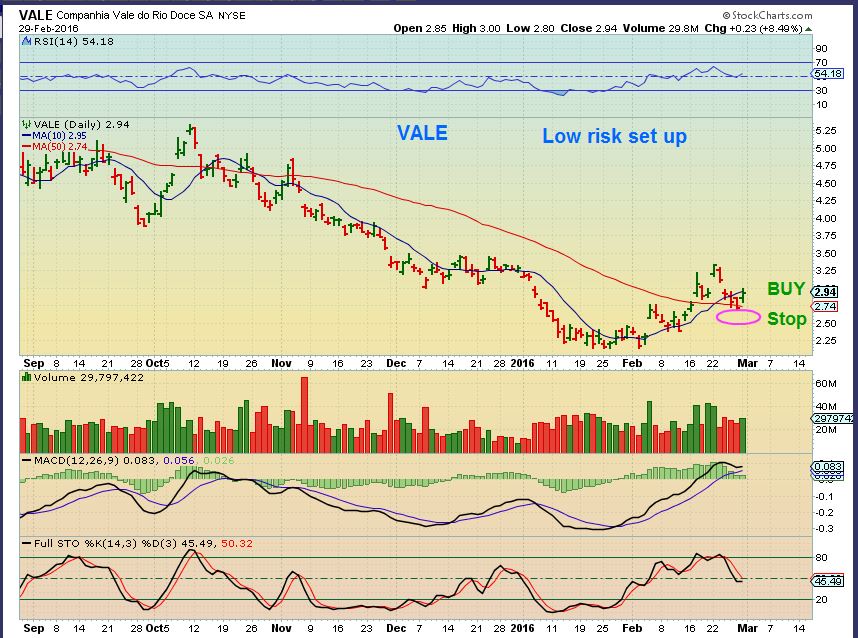
Vale popped and dropped and popped and dropped & consolidated. It may be ready to move higher if support at the 50sma holds.
So those are some trade ideas, my thoughts on the various sectors of the market have not changed from the weekend. IT has been a traders market, but in some areas the volatility leaves people guessing at which direction will take hold. Tuesday will add further clues.
Best wishes and thanks for being here.


Alex is there any correlation between gold and the stock market, why are both of them moving up shouldnt one be in a decline.
Hi Alex, Morning everyone. I have been looking at Agro stocks like MOS and POT. What do you think? Look to be breaking out. Also Uranium stocks could be next. URRE looks to be in a base getting ready to move higher.
Yes, I mentioned MON, MOS, AGU, POT last week, when MOS & POT broke above the 50sma. They have decent bases. That was a buy breaking above the 50sma, and a back test could be too. Some look better than others. AGU didn’t break above the 50 yet .
I think you mentioned Uraniums at that time, and they do haved ecent set ups to0.
Also some retail stocks continue to perform well.
Miners leading gold lower? MUX getting hit. GDX lower low, and below the 200sma. Stops…….
200 sma BILL?
Ha, My mistake, I was looking at the 20sma on the 2hr chart. I think, so long ago………
I thought of that after you posted….that maybe you were in a different time frame 🙂
Been there, done that
GDX about to get a 50sma / 200 sma cross now.
It’s bullish, but it usually has the opposite effect, with a price drop then a rally
From the report , WTI – nice follow through OAS and NOG holding on. BTE popping.
CLF & VALE look like nice set ups with follow through
NADL wants to pop ( at the 200sma) but I hate low volume
BBG nice set up
Hey Bill… Gush ( Sshhh, its 3x)
😉
This is the craziest rally I’ve seen in a long time, one piece of good data came out on consumer spending and market is rallying shooting thru all resistance. Was g20 meeting good? Stimulus for China? Super Tuesday? Look at the put options volume for spy expiring just a day after Fed meeting. Taking that in affect
If you think about it, I’ve been calling for a rally out of the recent lows to suck the bulls in for a couple of weeks now ( It was in the charts). I used a chart to show how it could mimic the rally last fall, and it needs to be believable to draw in more buyers.
Now refresh and look at this chart
.
This will probably continue higher to suck the Bulls in, but it is likely a counter trend bounce
.
If you think about it, I’ve been calling for a rally out of the recent lows to suck the bulls in for a couple of weeks now ( It was in the charts). I used a chart to show how it could mimic the rally last fall, and it needs to be believable to draw in more buyers.
Now refresh and look at this chart
.
This will probably continue higher to suck the Bulls in, but it is likely a counter trend bounce
Sorry , wrong chart the first time 🙂 Try this one
.
So it’s market manipulation.
: ) I dont know what it is – but the ebb & flow gets predictable at times
Alex, you thinking 2025 is likely a top, right? That’s trendline and 200-day. I am finally getting it right! Instead of waiting for a breakout above 2000 and buying a top, I bought the lows and am scaling out as we approach serious resistance.
Today was solid, not sure I’m ready to flip bearish after a power move like today. Financials finally moved up and transports are participating. But GLD and defensive sectors weren’t too bad and overall volume was low. But biggest VIX drop in a long, long while.
That is the area that I will be watching
May continue to scale out this week. Unlikely to nail the top like I want to, but I’m so far ahead in UPRO right now would be a shame for a give-back.
Just got out of some DUST.
Hope you were able to hold on through yesterday, Bill.
Not expecting a GDX low for another week (+/-).
Think SLV has further to go on the downside and seems to leading the PMs lower.
SLV $13.70 is a place I’ll be watching.
Good luck all.
Yes, still in DUST. Yesterday was tough, but I’m pretty confident
Oh man, I just missed it today. So mad. Read it pre-market and put in a limit buy. Went to 2 hours of meetings and when I came back DUST was gone. I had lowballed it and the move was already over. No chasing as strong as miners have been. I should have hoped the limit, was expecting opening volatility before the move. Nope, shot straight up.
cup& handle forming on 1 minute UNG following shakeout?
Yes, agree- could be lows. Volatile and tricky though.
c&h failed for time being.. maybe sideways in this zone for a while, till DT-line breached to the upside
Many of the energy stocks ( Some mentioned earlier) look really good as low risk set ups here.
ERF, BTE, PDS, RRC for example. ( And I still like VALE & CLF in this area)
I’ll likely discuss this in the report tonight , but looking now and decoding is helpful
BTE earnings on the 3rd. RRC absolutely got crushed on earnings, missed by a huge amount. Be careful there.
You sure you have the right one ? RRC didn’t get absolutely crushed on earnings. They released earnings Feb 26. Price is higher now and it just broke above the 50sma . I like the set up .
.
Refresh
.
Range Res Corp? I’m seeing a target earning of $0.02 estimate. They came in at -$1.95. Huge % miss. Unless its a typo and it came in at +$1.95?
TGD – I tweeted this chart this morning, but it needs a bot more volume for good follow through
.refresh
.
.
At current price of .24 stop .22 below LTL you would be risking 8.5% to make a “possible” 25% ?