
Open To Debate
The weekend report discussed Turning Points. Though I have laid out my big picture expectations, I also mentioned that at turning points it is important to continue to examine clues from an unbiased view point. Sometimes subtle changes at turning points can either alter the bigger picture or confirm it. I discussed a few changes developing in my weekend report, so lets continue to examine any clues that may appear.
.
SPX – Our run higher still resembles the run higher last fall in many ways. I am expecting a dip down into a DCL soon, but the move out of that daily cycle low is going to be important to watch. It is not time to short this market yet. As the market rises , I see a bearish wedge and lighter volume. We wait for the dip.
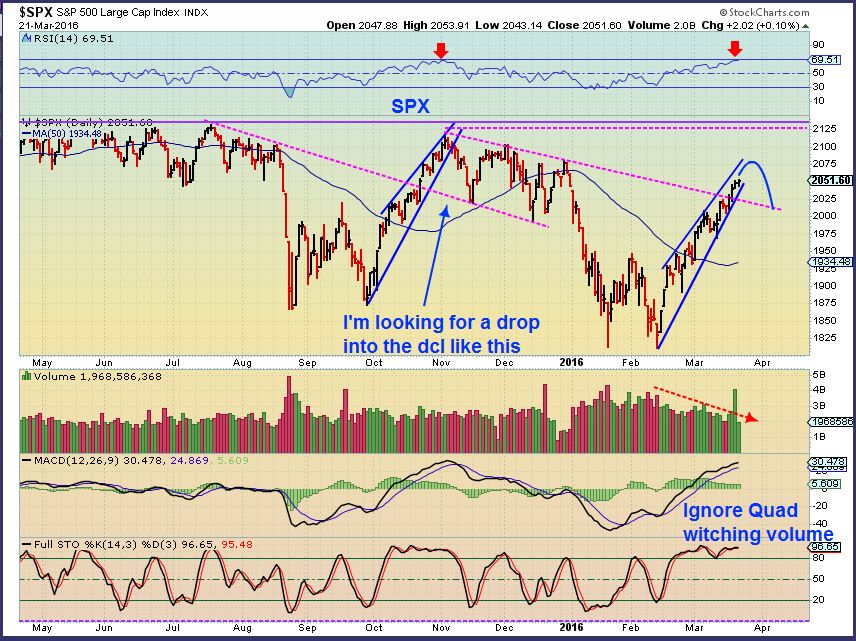
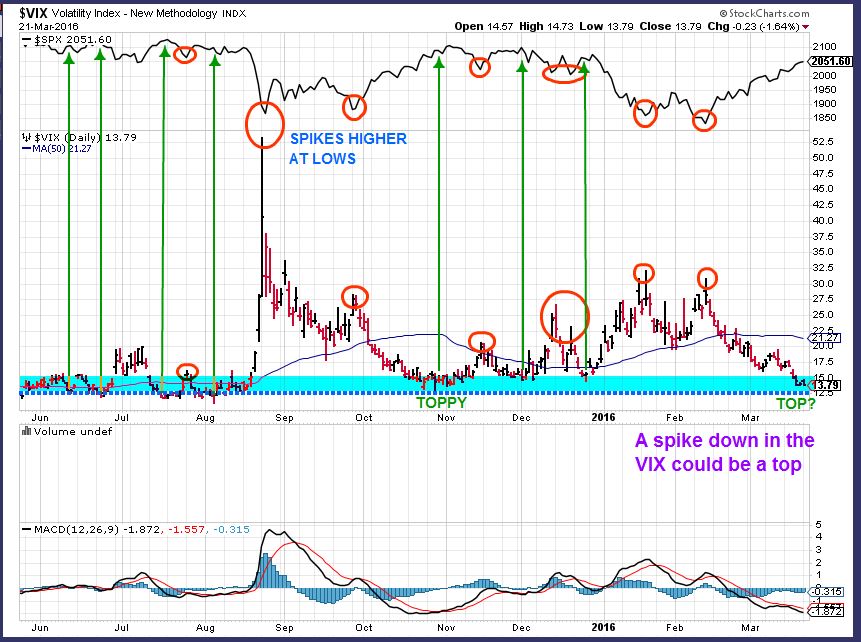
Usually at tops (even temporary tops) , the VIX gets down near $12 -$13. Spikes higher in the vix can lead to bottoms, and a spike lower can signal a top. The vix is low enough, but a spike lower would probably signal a temporary top.
Here is where it continues to get interesting. As I mentioned in the weekend report, the markets really aren’t in sync. Lets take a look.
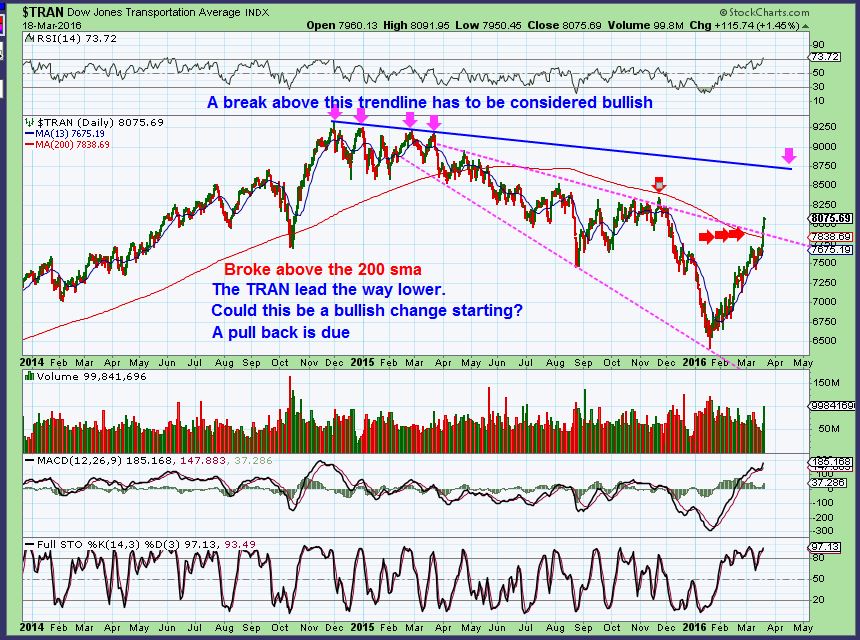
I pointed out this break higher by the TRANNIES over the 200sma. The SPX is at JAN 1st Highs. The TRANNIES are at new 2016 highs.
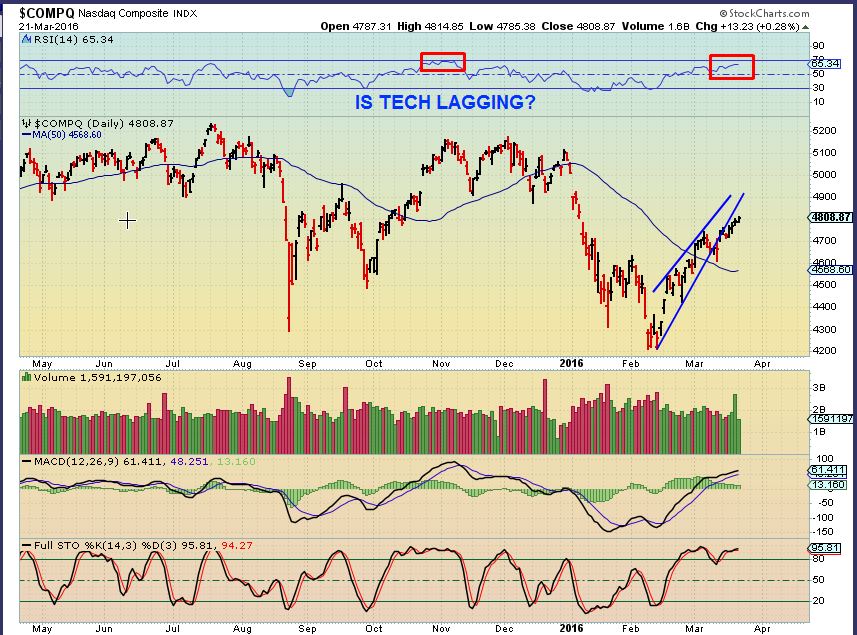
The NAZ ( usually a leader) is relatively weaker in this rally.
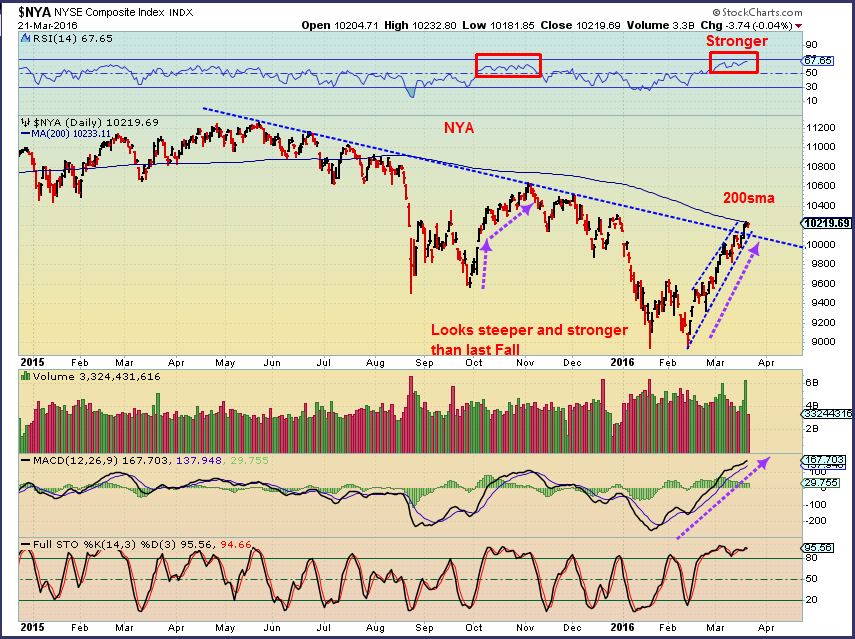
THE NYSE – This also looks like it ramped up a bit stronger than the Fall rally.
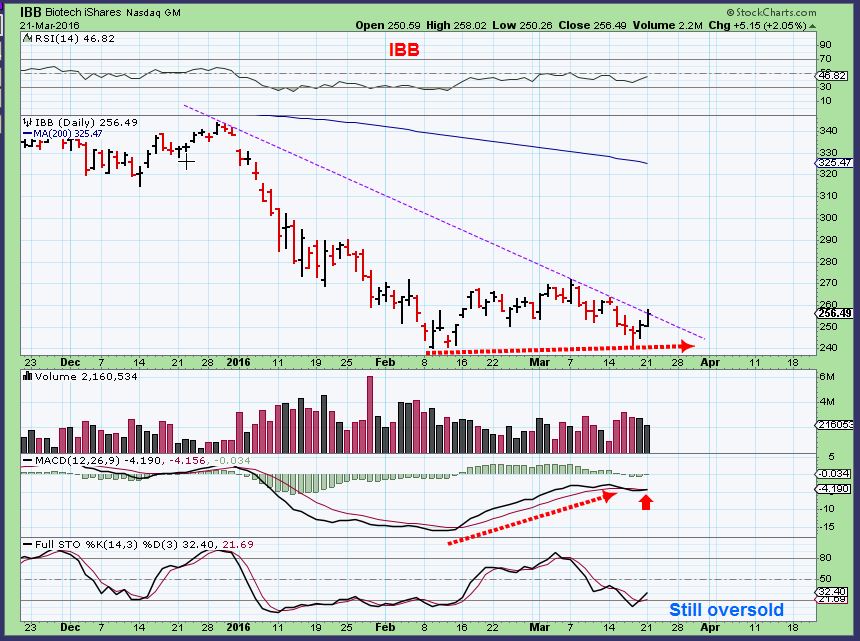
The IBB – This is making a double bottom, no real rally to speak of, but the set up is bullish looking at this time. This can be a BASE that formed in the first daily cycle and really rallies strongly from here.
I also pointed out the Big Picture Monthly and Quarterly charts this weekend as having a change in character. What does this lead me to believe? The charts at the end of the Month ( March Monthly ) will be important. If the IBB rallies strongly in the 2nd daily cycle, and then the SPX also rallies strongly, it could break out since it is already near the recent highs. The TRAN has already broken out above the 200sma, and down trend line ( see chart) , so if it rallies strongly in the 2nd daily cycle, it could make a run for the former highs. SO I will be watching many different things going forward, but I will NOT keep bringing it up in every daily report. We need more time to see how the markets pull back and then attempt to rally again. I am just letting you all know that an unbiased view will keep us safe as the evidence continues to develop. Right now we have a little bit of a mixed signal.
.
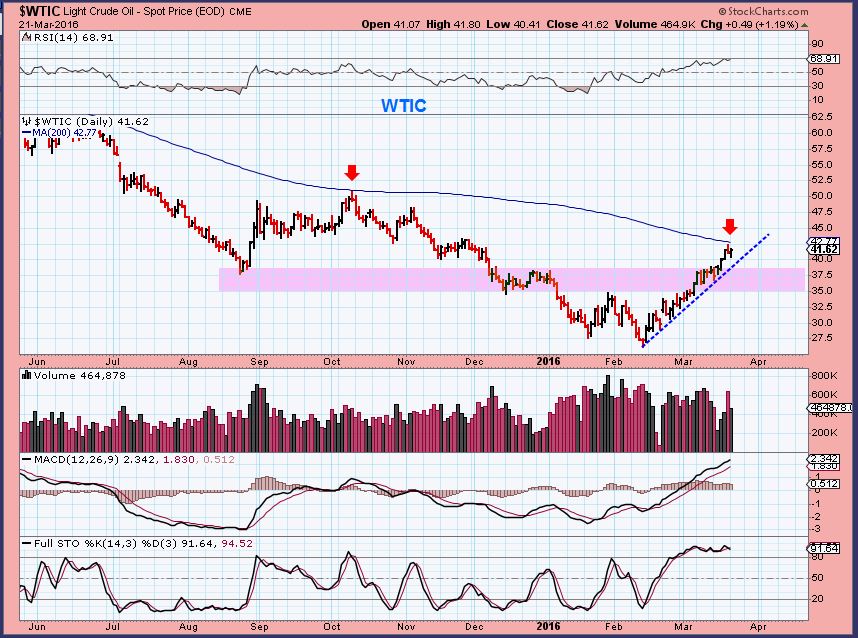
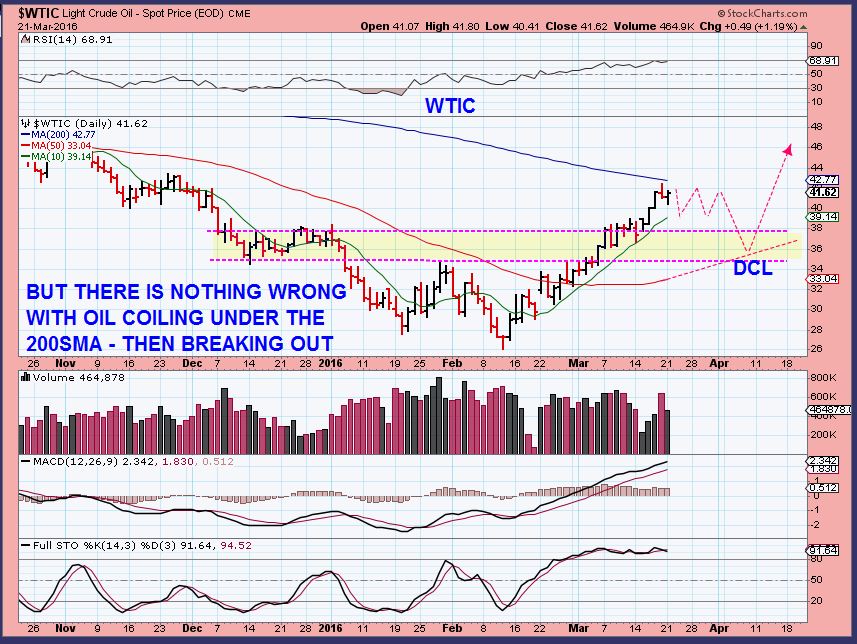
WTIC #1 – Oil has had a beautiful rally, and we caught the lows basically expecting them to possibly arrive at $26. It has been a strong run and we flipped to Energy stocks and caught some sharp rallies out of the lows. Now oils 1st daily cycle has hit the 200sma.
WTIC #2 – A daily cycle in Oil can find its dcl anywhere from day 30 to 40’s! It’s hard to know what will happen with such a loose range, so lets discuss what MIGHT / MAYBE / Possibly could happen. We are on day 26, we could start to dip down now and simply go sideways. We also have time to crawl below the 200sma and even POP higher before dipping into the next low (As shown).
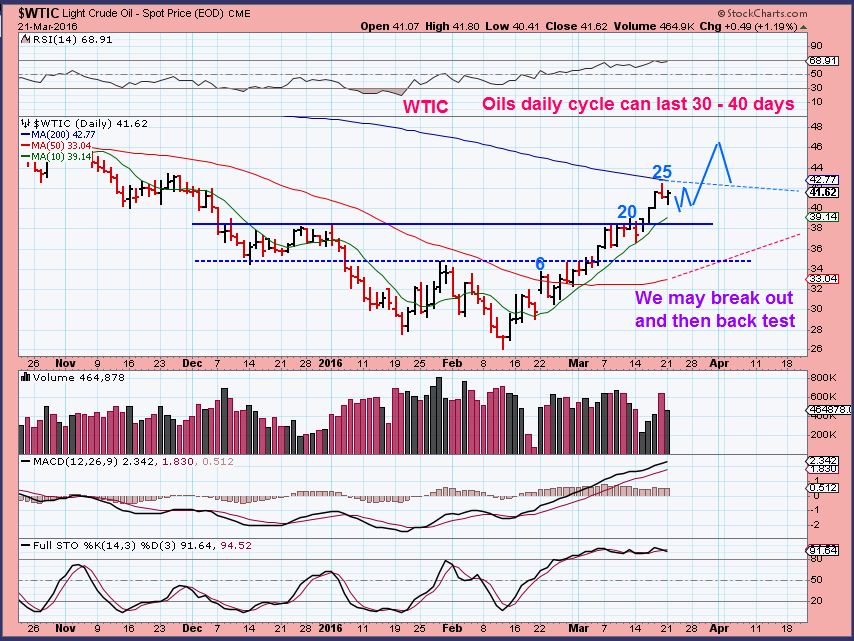
WTIC #3 – Maybe it crawls under the 200sma for 5 days , and dips to a dcl at the 50sma before surging higher. So far OIL has been riding the 10sma nicely.
.
You see what I am saying, right? I cannot know exactly what Oil will do tomorrow, and then Wednesday, and then Thursday. ” Will OIL be higher tomorrow?” It is not a day – by – day, play – by – play, though I try. OIL has been very bullish out of the lows, I expect it to remain bullish, even if it pulls back.
.
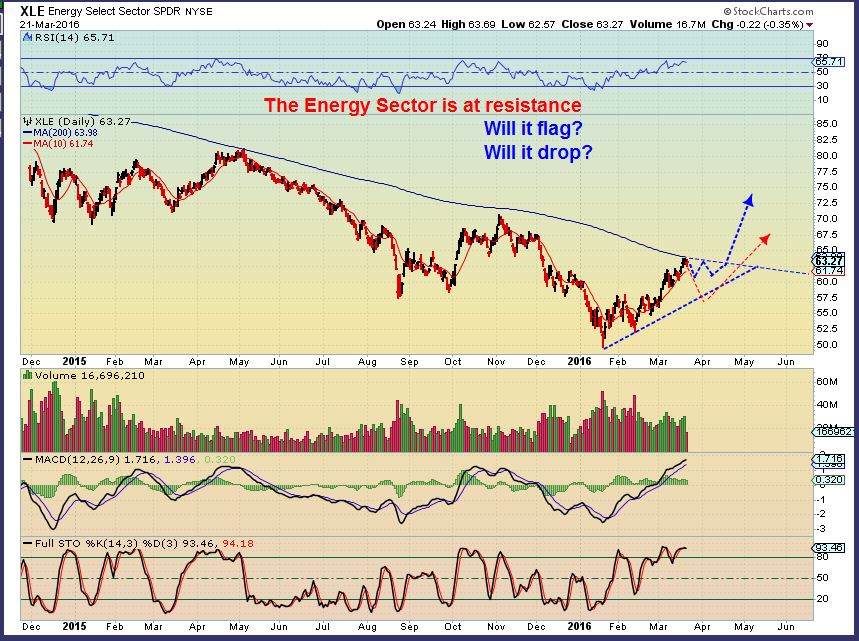
XLE – And so it goes with the Energy stocks (XLE). It can remain strong and hug the line, or pull back and attempt a break out after that. Should you sell your energy stocks? You should at least have a stop, and sell if you cant ride the wiggles. Individual stocks may do their own thing too ( Like Miners).
.
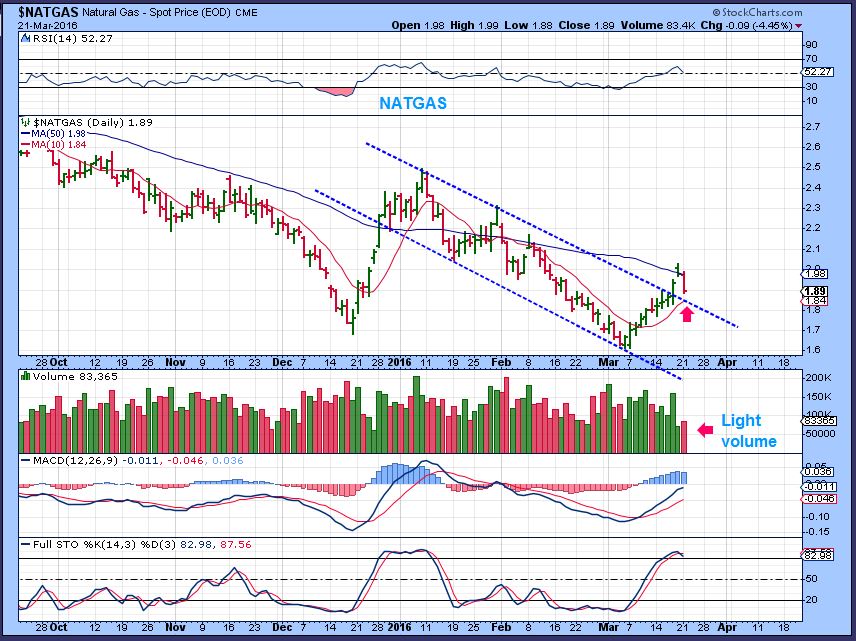
NATGAS – It has been strong, it dipped today. AFter that break out, we may be seeing a back test. I would want to see that trend line hold as support. ( 10 sma is there too).
.
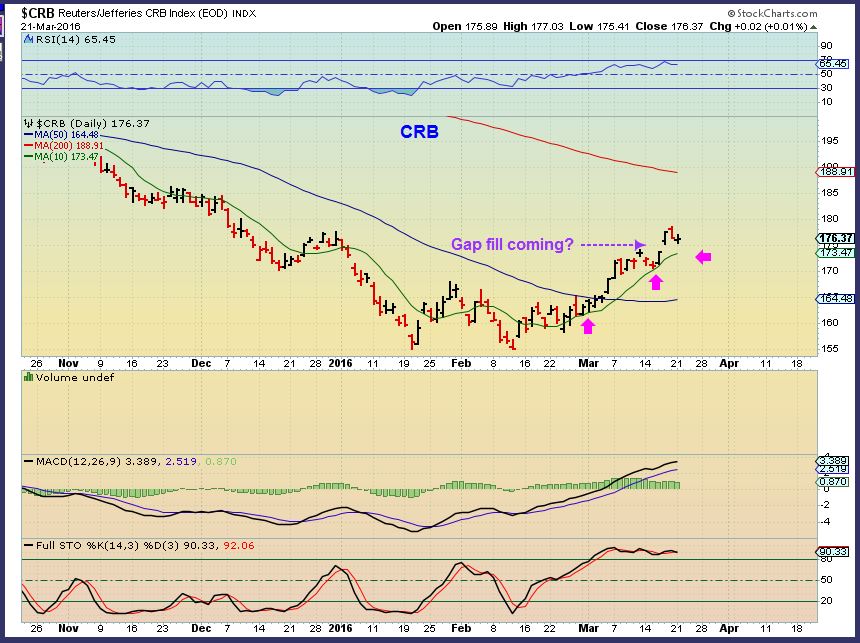
CRB – I can see the CRB pausing and maybe we get a gap fill . It has acted very well, and so have the commodity stocks. I still own VALE & CLF, but I really like the way Steel stocks and FCX are acting.
.
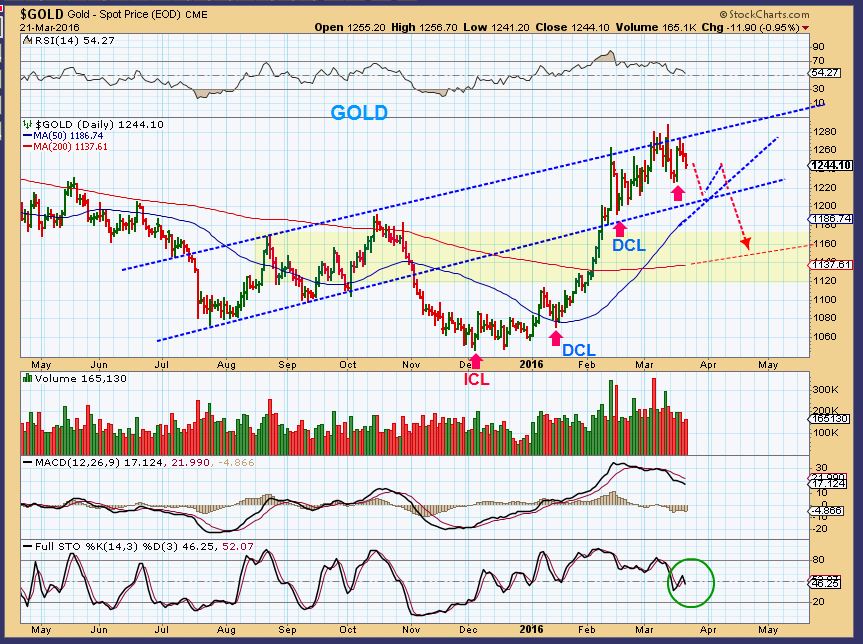
GOLD & MINERS are holding up very well. They remain surprisingly strong in this sideways consolidation. Some refuse to pull back so far. Lets review.
.
GOLD – I expect a pullback in GOLD that should embolden the bears and scare the bulls a bit, but can you imagine if it stays within this channel? What if it only dropped to the rising 50sma before surging higher to $1400. It would leave people behind again. ( For safety sake, I still need to expect a drop to the 200sma, as shown).
.
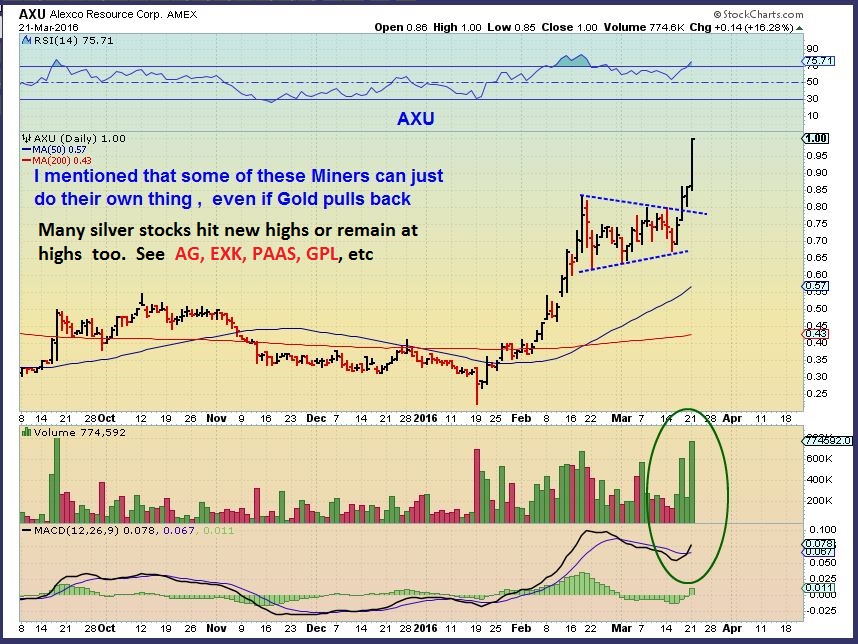
I mentioned that some MINERS could just march to the beat of their own drummer, so we could consider core positions in our non- trading account.
.
CASE & POINT – WOW, look at AXU. See also the stocks mentioned on the chart. SWC, TAHO, HL, etc etc. They are at highs and refuse to pull back so far 🙂
.
So miners remain very strong. A pullback would be a gift , these have put in a stellar performance.
.
I’d like to just point out some charts here. Some are going to be BIOTECH. RISKY? YES!.
The charts may be interesting to some of my more experienced traders, so I want to point out their bullish set ups, but you know your own trading style and risk management. For some here, the best thing you could do is patiently wait for a pull back in Miners or a commodity stock. It seems that some of these commodity stocks look similar to Miners , they may just keep going higher too. I will point that out here too.
.
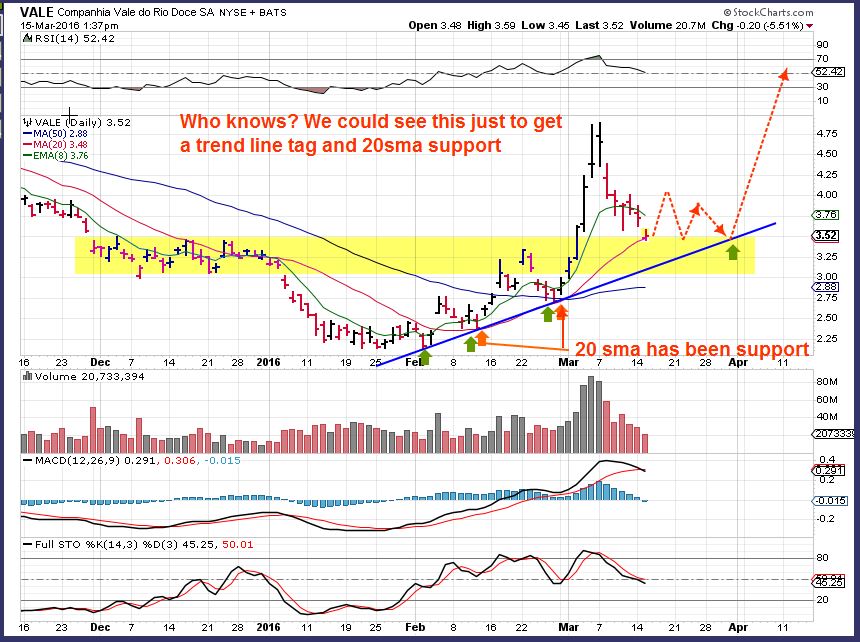
The question, Is VALE or CLF still ok? I posted this March 15. These could just go sideways.
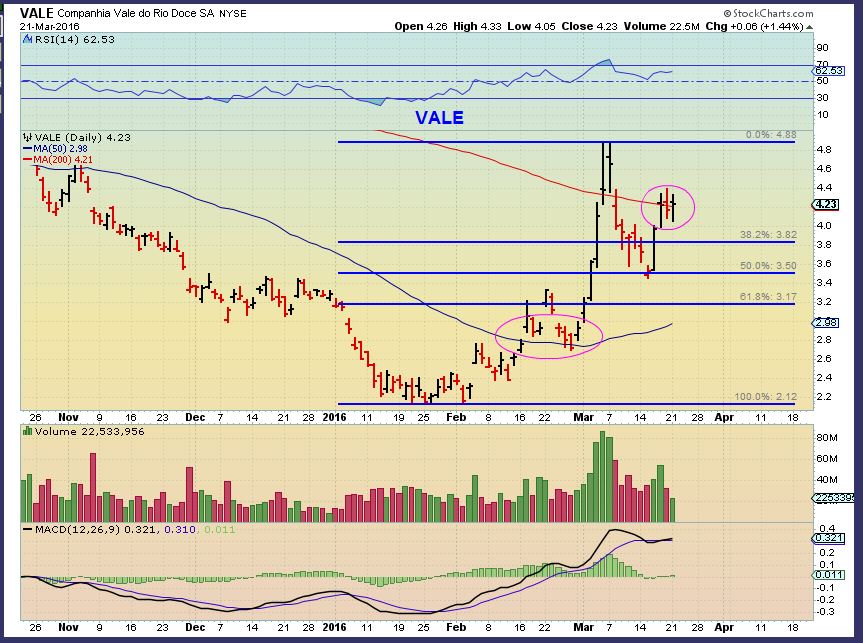
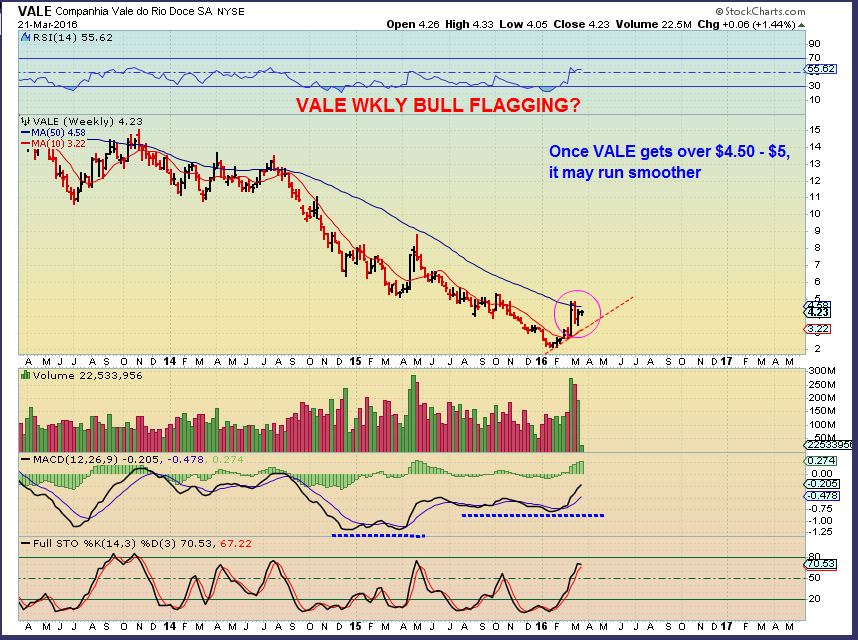
VALE MONDAY – It’s crawling along the 200sma.
VALE LONGER TERM. – No guarantees but If Commodities have bottomed, you’ll probably wish you owned it at $3 a yr from now.
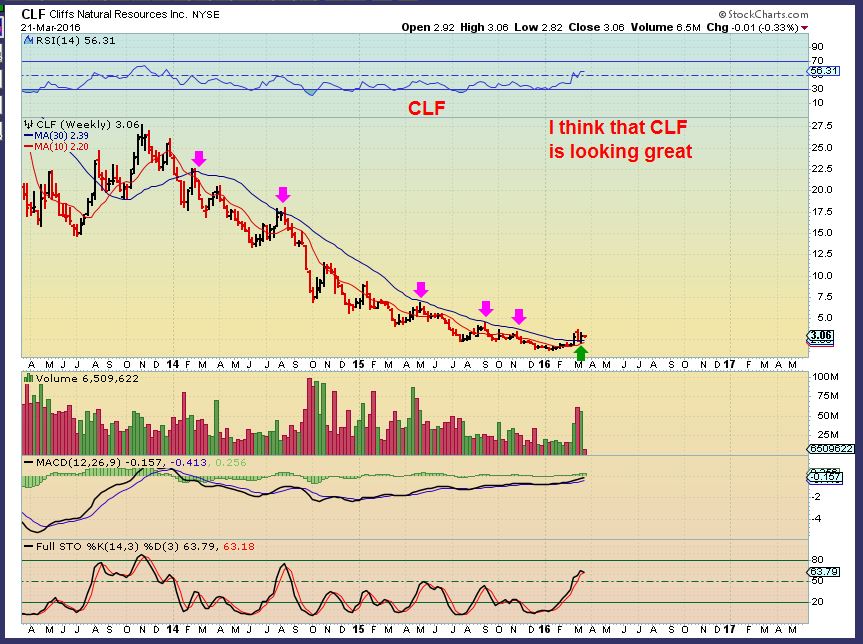
CLF – Held the 200sma.
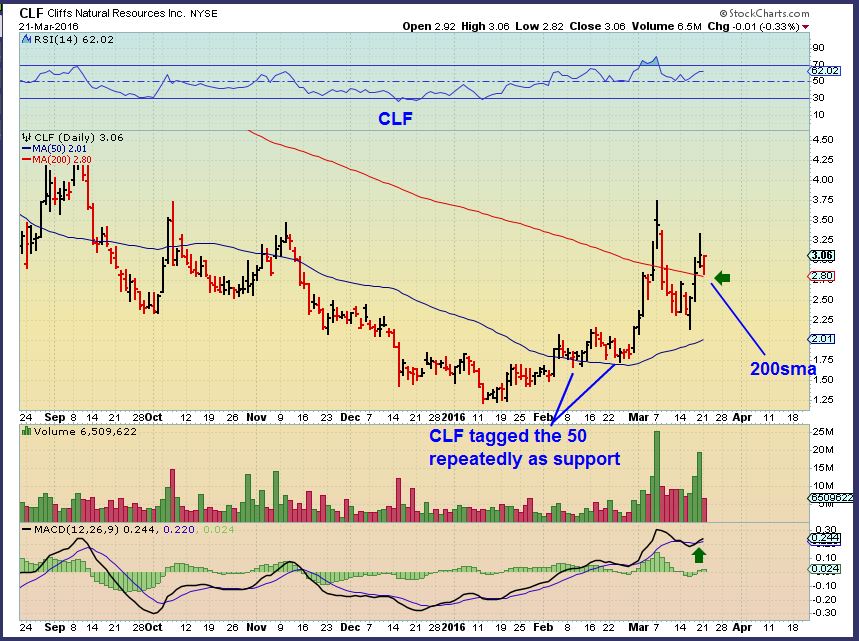
CLF – No guarantees, but If commodities bottomed, you’ll probably wish you owned it here a year from now.
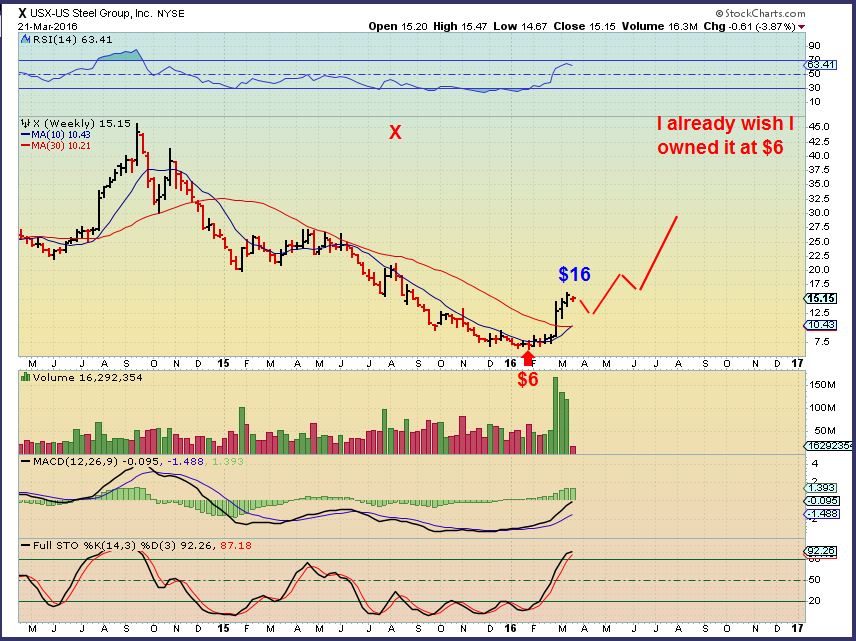
X – Yes, We’ll be wishing we owned this at $6.
We have looked at the general markets and seen improvement. Recently they were making lower highs and lower lows. IF stocks are now going to rally higher and break to new highs, instead of break down, should we fear missing the move? No- look at the potential if these one time high flying speculative stocks return to favor ( like DDD, XONE, SSYS, VJET, Etc).
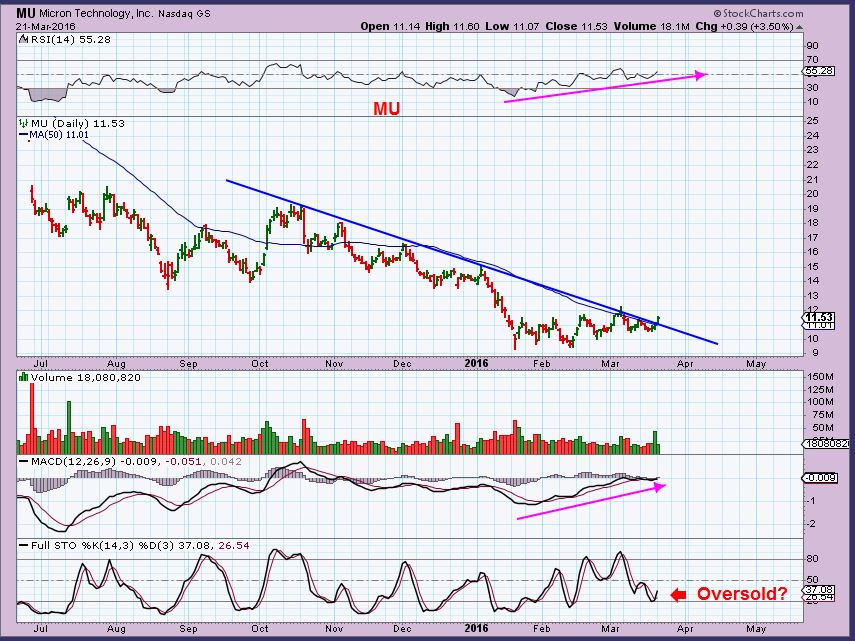
MU – Plenty of upside potential.
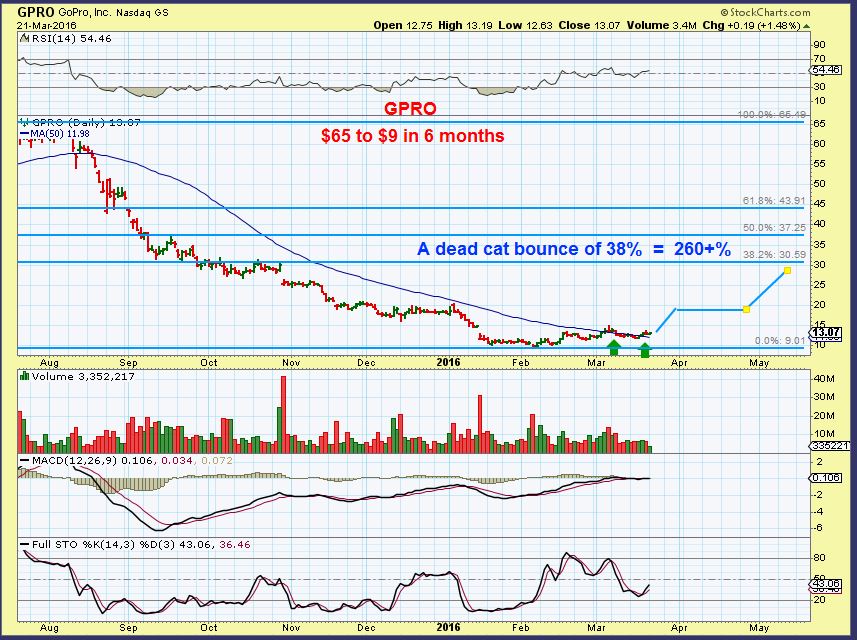
GPRO – Plenty of upside potential
 .
.
So again, lets look at some of those BIOTECH STOCKS with what appears to be bullish bases and set ups. Experienced traders may want to trade them , despite the risks. Or trade LABU if this sector plays out bullishly. Others should just take note that this sector is improving, so the IBB may be ready to rally in the second daily cycle ( You could buy an ETF if this plays out).
.
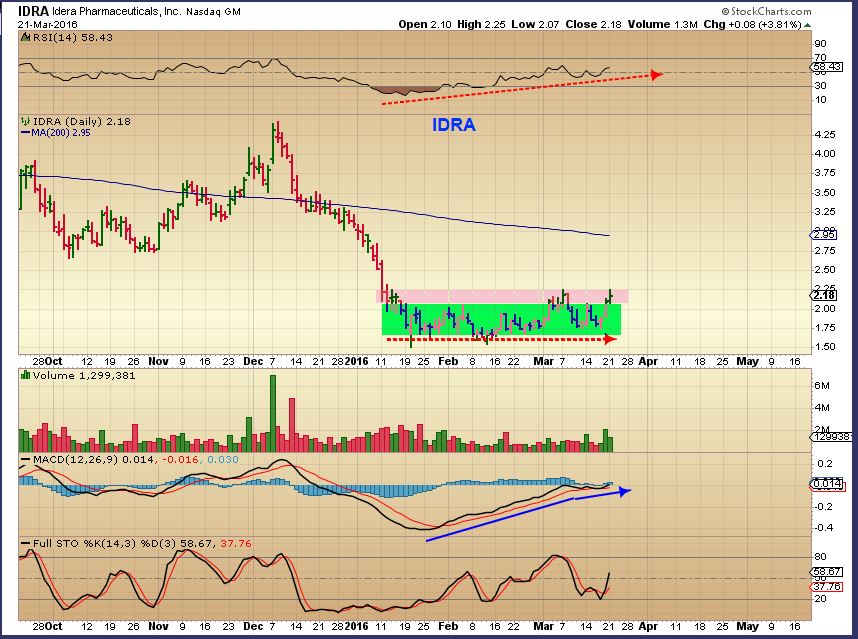
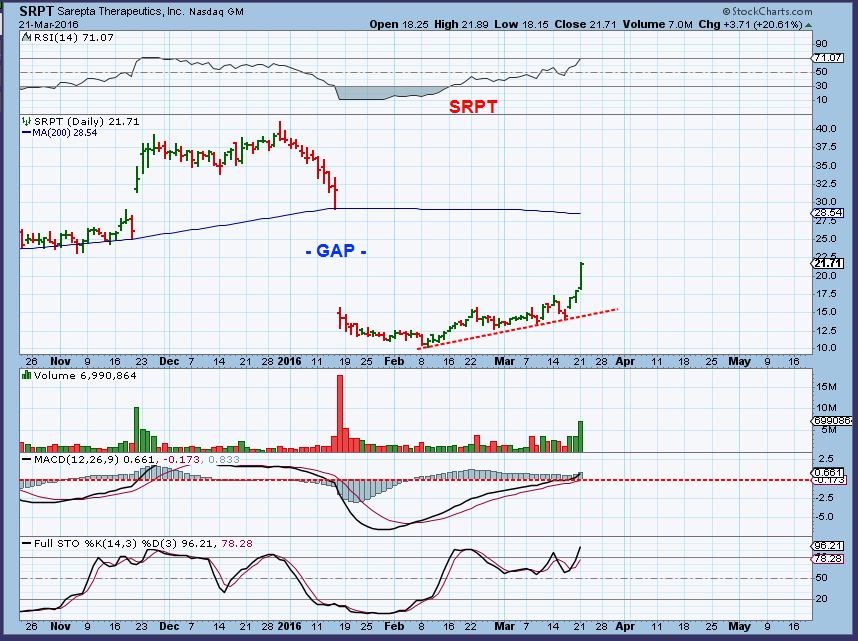
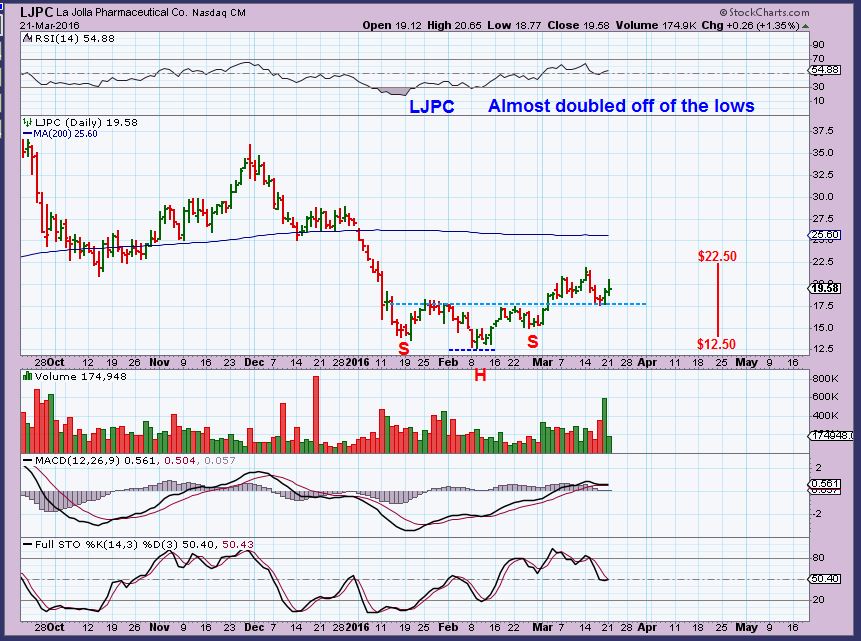
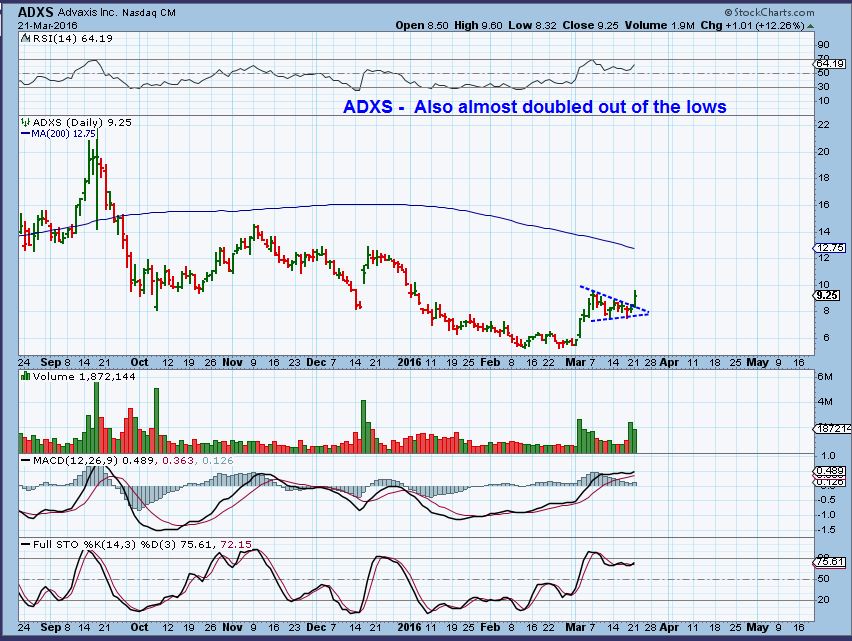
If you take anything at all from this list, just note the fact that so many stocks in one sector are bullishly aligned. Also notice just how much some of these have already moved %-Wise off of their lows. So this doesnt necessarily mean buy them, I am just pointing out that many Biotech stocks look bullishly set up.
.
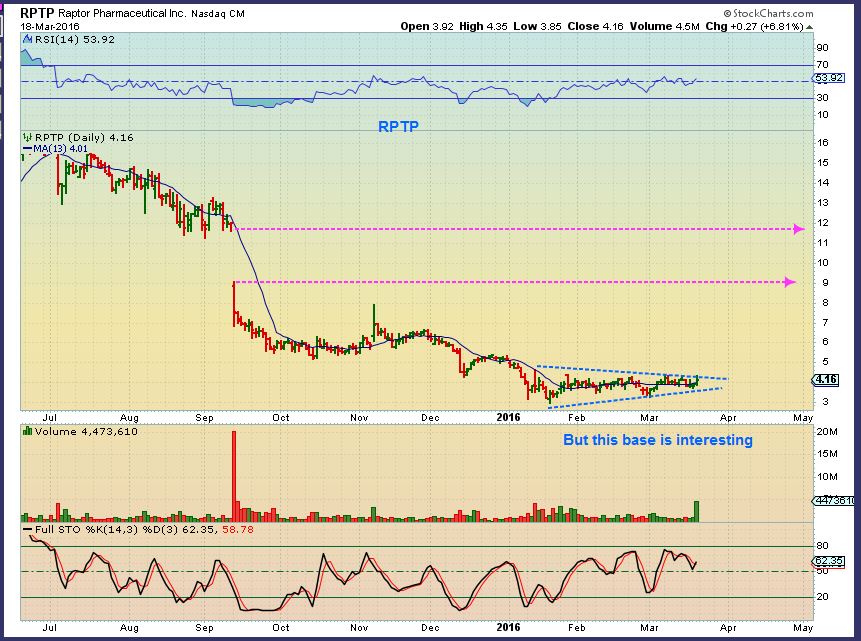
RPTP
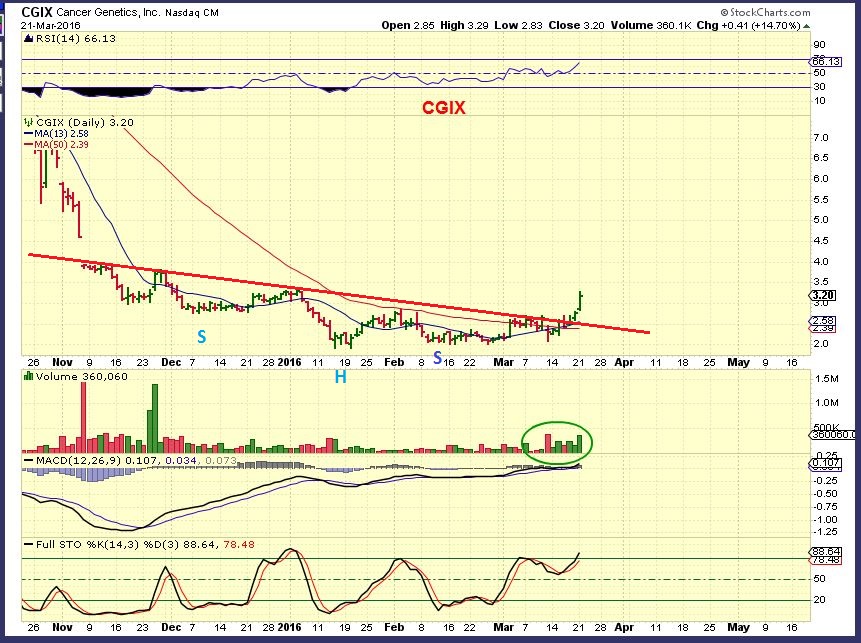
CGIX –
IDRA
SRPT
LJPC
ADXS
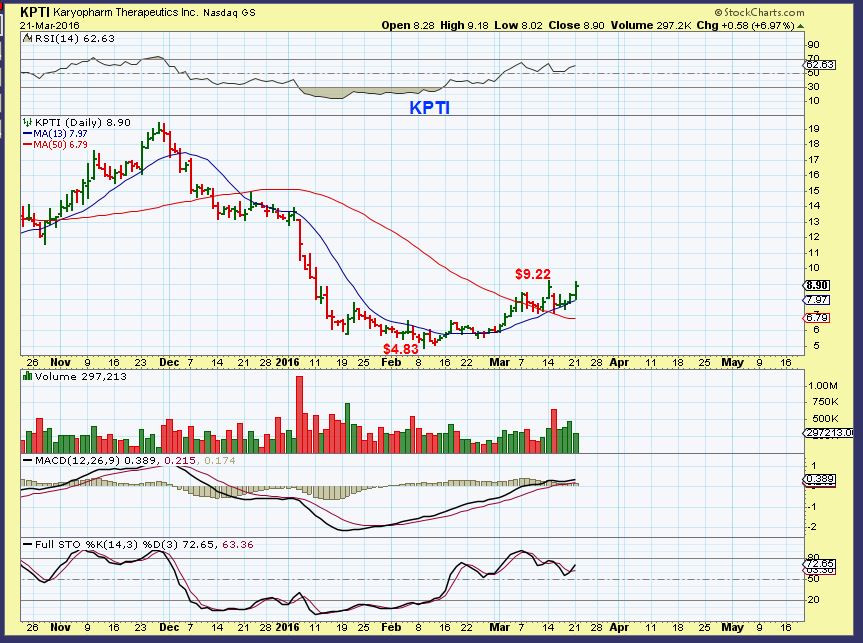
KPTI
So we have a lot that I am watching right now. Some of it affects future trading (buying pullbacks) and some of it affects the big picture possibilities. I still own my commodity stocks and LGCY, and I picked up 2 biotech trades to trade them out of their bases for a few days. Patience in the short term may also be the best action, waiting for the next trade.
.


I like it. I’m watching Tvix & Vic & uvxy. Great Chart on spx & vxx
Hi Al,
yes, the Vix is another useful tool in a few ways , but for me its not a great ‘timing’ tool – Its more of a “Heads up” tool 🙂
You know when you are entering an area that the markets often pull back or bottom, but it can take days of the VIX in the 12-13 area before you see a reaction.
Alex, I bought SRPT last week, I bought RPTP Yesterday. Keep them on your review list for me. 😉
SRPT and RPTP both out with positive news.
In case anyone is interested in the energy sector. Here are a few tickers that have positive financials. WG, PACD, RIG, XOM, SRE, XEL. Also, there is XLU (an ETF) that will help diversify your holdings. May help avoid possible SXE surprises.
HI Bill,
thanx this info is always interesting to hear/to get.
less obvious to obtain over here in Europe
Ray
take a look at an SXE surprise today…
WTF? 69% makes no sense
Sorry, JInx on me 🙂
SXE is this didvidend right? WOW, refresh
yeahhh.. jinx u 😉
so.. speaking of REXX (giggle) what’s the chances of it juicing up for another 300% run?
https://www.tradingview.com/x/19WIsYAe/
#MariasBox
..speaking of… nice theme pic .. smoooooooth… lol
I can see your box, and the possibility of a flag and a continuing AB=CD pattern. However, with OIL at the 200sma I think we are in for a correction.
u can?? u hava secret webcam in my office .. .?
LoLoL
I’m a visual learning….
i was kinda hoping you could overlay it with your harmonica ….
… for old time sake..
Maria, Going on harmonics, it looks like a Gartley pattern could play out which would say lower prices ($0.97) ahead. You could also say there is a bear flag that was formed in the middle. A possible AB=CD which would indicate lower prices ($0.61) ahead. You could also say that the stock price is finding support at the 20sma on weaker volume which may lead to higher prices from here. The last three days have not been able to push lower $1.16 may be the low. But like I said, WTIC at 200sma I would expect lower prices. Refresh
almighty… just curious about the patterns…
*thats short for LR no worries … LOL
Um, LR?
.. and thanks for your efforts, naturally …. 😉
Oh, and its the same for RIG here. On support 50sma probably moves higher! BUT, WTIC is at 200sma.
NQ …. hmmm
And ‘S’ ( mobile). I saw NQ, but I didnt like how it popped and dropped last week, but I havent checked the news
ooo.. i like S better
Using a 50sma, turning higher right on support
Did you see SXE today 🙂
It appears like it dropped to the 50sma and now POPPED
http://www.marketwatch.com/story/southcross-energy-partners-lp-announces-preliminary-results-for-fourth-quarter-2015-provides-update-on-southcross-holdings-lp-2016-03-22
Southcross expects to report fourth quarter 2015 Adjusted EBITDA at the upper end of the previously provided guidance range of $23 million to $25 million.
Still discusses restructuring under chapter 11. Maybe it is just short covering
Silver stocks are beautiful chart-wise.
AXU again, EXK, AG, PAAS, GPL
got a list?.. so i dont need to trawl back thru previous reports to find em.. thx
refresh, its there
ta 🙂
EXK actually looks like a bullish consolidation . The pattern is a bullish one, so maybe silver makes a run and Gold pulls back, since Gold made a run and Silver held back. This area is not acting clearly, but Gold is due for a pull back.
Pennant or Topping 50-50
EXK has been a real stud. I sold on a bit of a spike but bought right back in 30 cents lower. Silver has been a hot mess doing nothing and these stocks just don’t care. Wow. CDE has been going hard last few days, too.
SXE 90%.
Only?
Be patient : ) It’ll be 150% soon enough
I killed it with that comment : ) , but wow, that just ran from $0.62 cents to $1.47 today alone.
I mentioned in my report that I really liked the charts of the steel stocks and FCX.
This is a view of FCX (refresh) , and it has been a really nice, orderly, move. Once it gained that 13sma, it acted as support and still hasnt been broken. Now it gained the 200sma and is holding on up there. That is what I would eventually like to see happen to CLF or VALE – a steadier climb up one of the moving averages.
.
VALE is very close when you use a 13sma, 34 sma , and 200sma.
CLF is using the 20sma more.
Slower pace.
AA looks the same way
I own both so bring it on!!
Bill –
Remember when I told you about that ROYL oil stock, went from 5 cents to 15 cents, and you said that was a new one to you?
Have you seen it lately? 5 cents to 65 cents. Crazy.
OMG, I always miss those.
I actually missed it as a trade too, watched it all the higher .
PZG ON A wkly chart. Sneaking away , light volume tho
Alex can you give me ur opinion on $pn big insider buyings
Thats a new one to me, so I dont ANYTHING about the company. Obviously a great run up out of the lows,
probably a combo of short cover & buying.
Being in the middle of the move, I never make a recommendation unless it is right around support. It could actually just keep running (short cover and buying) straight to the 200sma, because look at the lack of resistance to the left (Fire pole) – OR – it is near the base, it could also bounce around a bit & then continue higher.
It looks like it is getting lighter and lighter volume. It may be running out of steam short term, so you can watch to see if it does drop back to support, I guess it could be bought there if it remains healthy.
refresh
.
GEVO – No recommendation. Biofuel
poor fundamentals , but it just shot out of it’s long base 30%. I dont see any news.
Oh those 3-D staocks.
First DDD & SSYS, and now XONE cup & handle break out with very good volume!
VJET ANYONE? : )
I watch them every day since you brought them up. DDD just keeps going.
Resistance at the 200sma, or break thru like DDD?
Good evening everyone! Real quick FYI. If you put on a trade on MU, be aware that earnings come out next week. I’ll post again in tomorrow’s report just to make sure.
Thanks Peter, always good to know when earnings is being released.
Gold finally appears to be breaking down out of consolidation zone early this morning.