1-29 Wkend Report: It’s Adding Up
We are getting the follow through that we expected in many different areas of the Market. The small pieces of the big picture continue to add up. Will it continue? Lets check the charts! 🙂
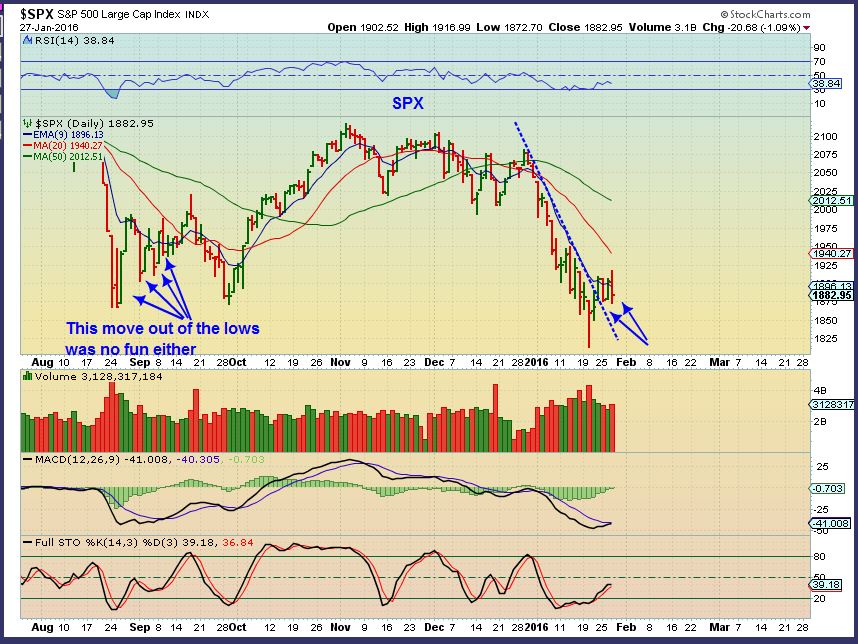
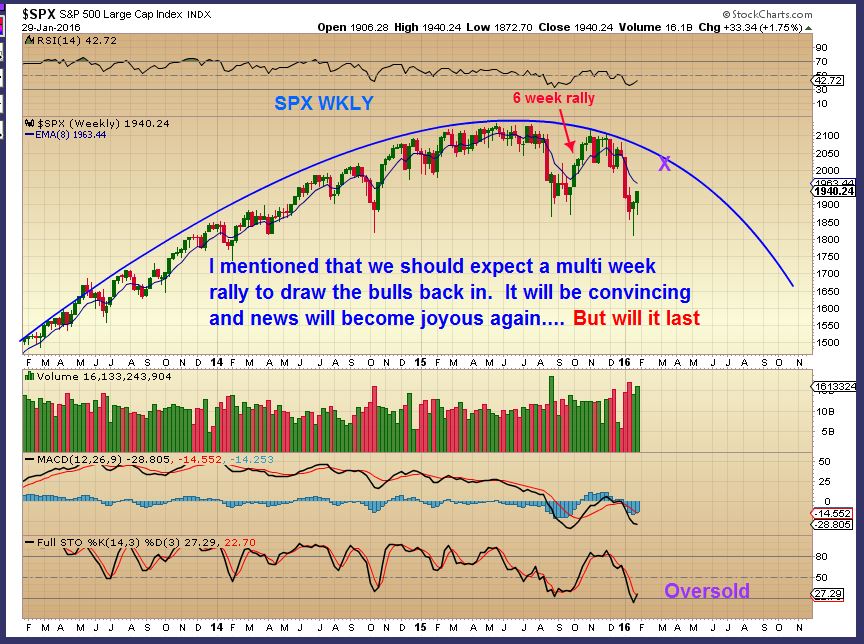
SPX Jan 27 – I pointed out that the drop mid week was normal, the same thing happened coming out of the August lows. I still expected a run higher.
SPX Jan 29 – Friday we got our follow through.
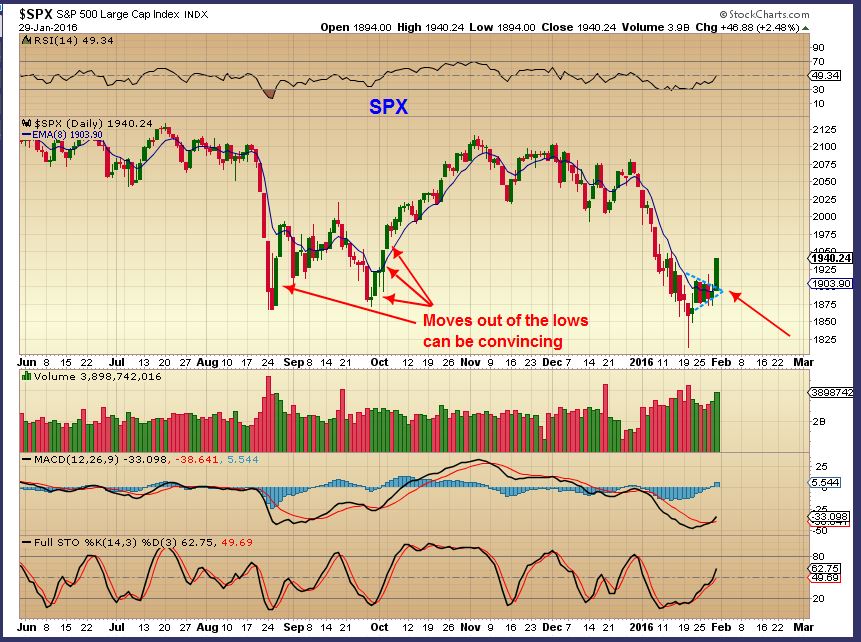
Moves higher out of the lows can be convincing, but will it lead to a break to new highs in a bull market, or a bounce?
IWM DECEMBER 24 – It never recovered out of the AUG lows and I noted the resistance here at the moving averages, so…
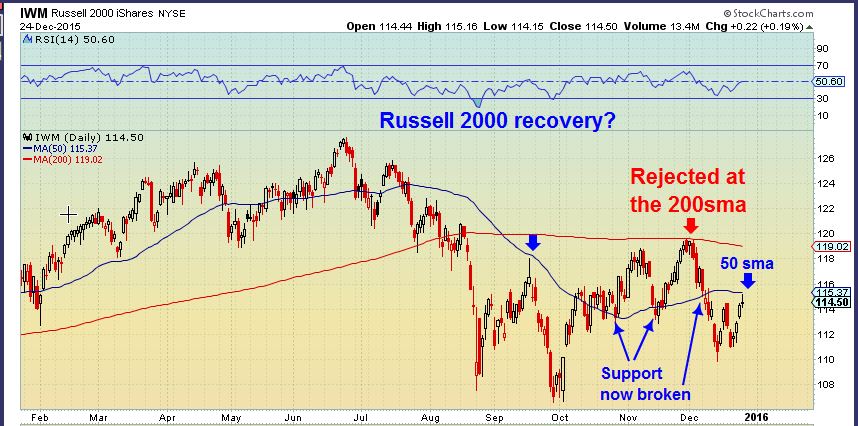
IWM – I’ll be keeping an eye on the resistance areas going forward too.
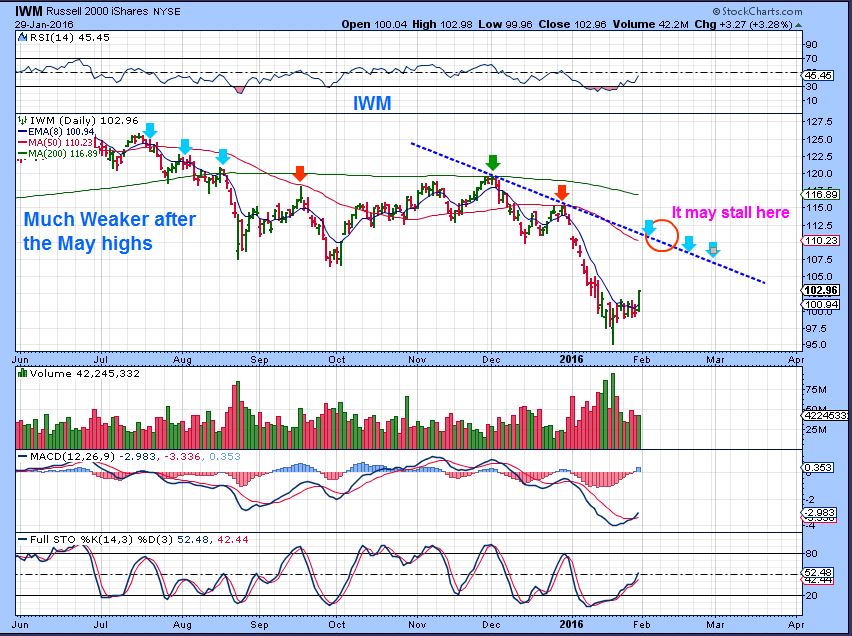
Because I expect a believable bounce to get everyone “long” and then another drop. The last 6 week rally did that.
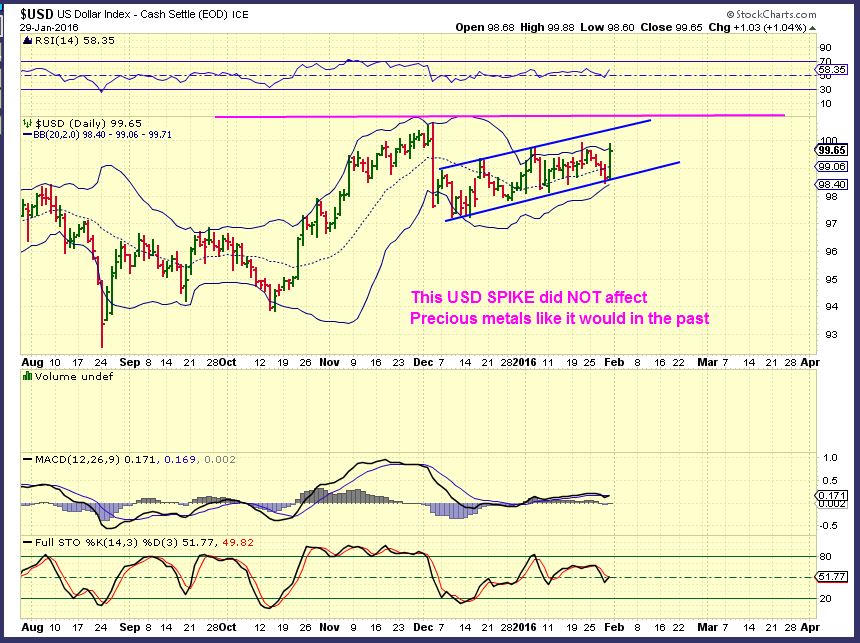
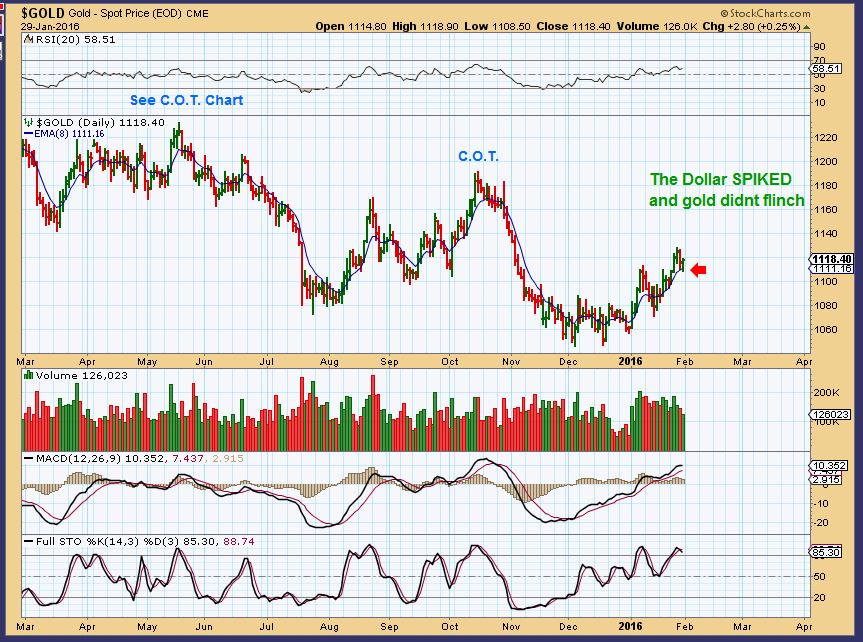
USD – Well Well Well. I called for a drop immediately in the $USD, and then the Bank of Japan threw us a curve ball. Did you notice that this POP did NOT hurt the precious metals? Interesting.
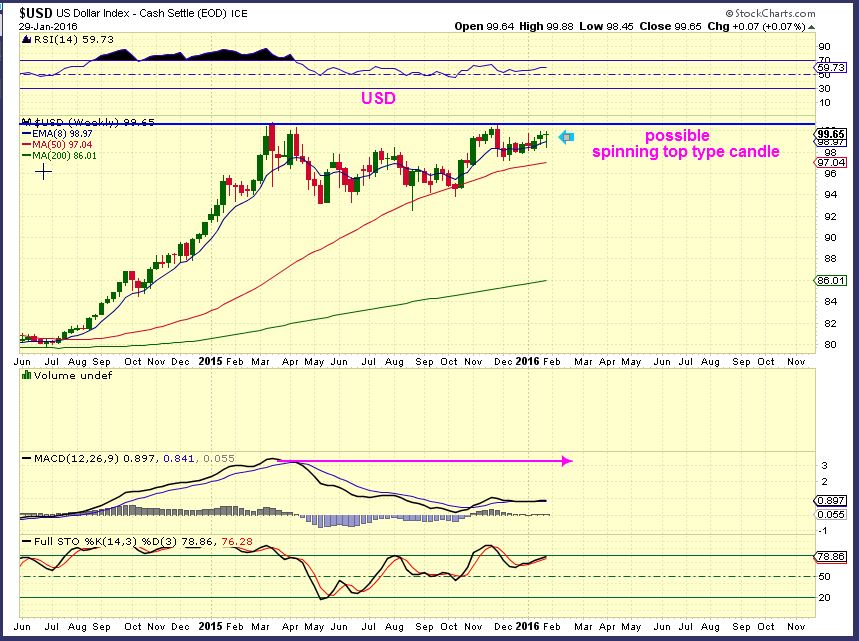
USD WKLY – We still could get the double top that I have been calling for, but I need more time to see how this plays out.
 .
.
REMINDER: And also for those that were not here during my December reports.
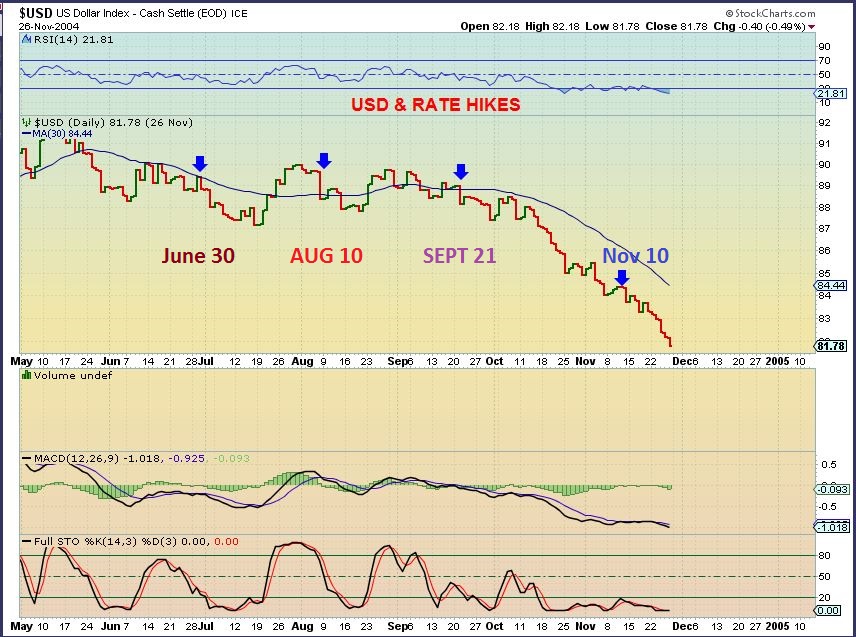
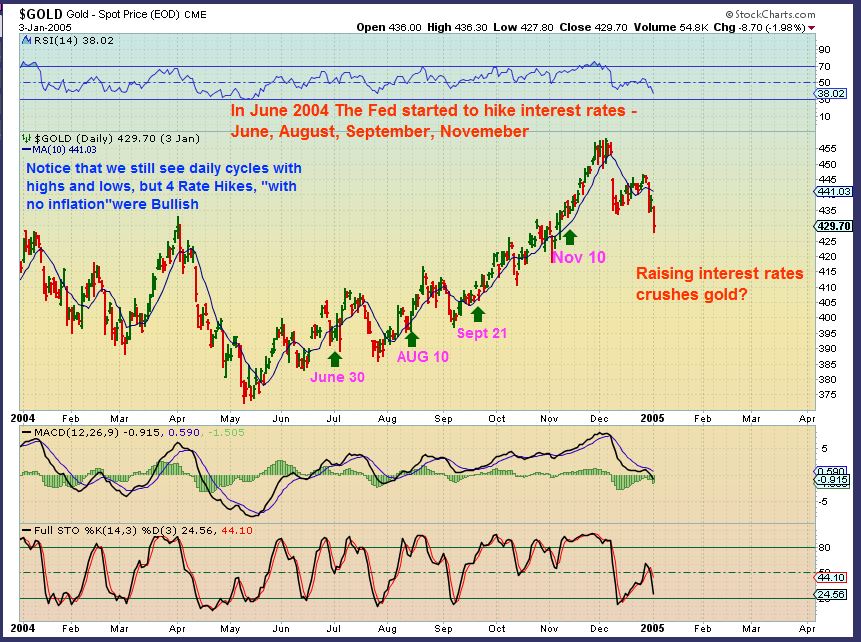
In one of my Dec weekend reports, you may recall that I did a study on interest rates and their affect in the past on both Gold and the Dollar. People worried that Gold would crash in an interest rate hike environment. Actually in 2004 – Gold continually rose in that environment, the dollar dropped.
In 2004, the $USD dropped and rallied on the first rate hike, then rolled over as the year went on. ( Note: Ever since the Dec 2015 rate hike , everyone expected the Dollar to break out and run to 120. So far it has been lack luster.)
This was GOLD in 2004, with the first 4 interest rate hikes in years. It was NOT bad for gold to be in an interest rate hike environment.
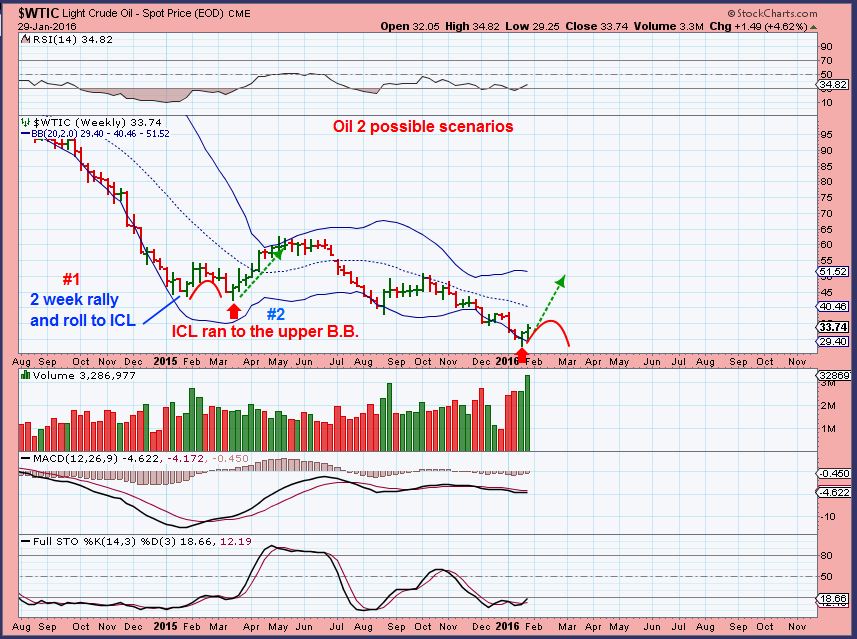
WTIC – Strong out of the lows and huge volume , but it could still just be a final daily cycle that would roll over like last spring. ( Next chart)
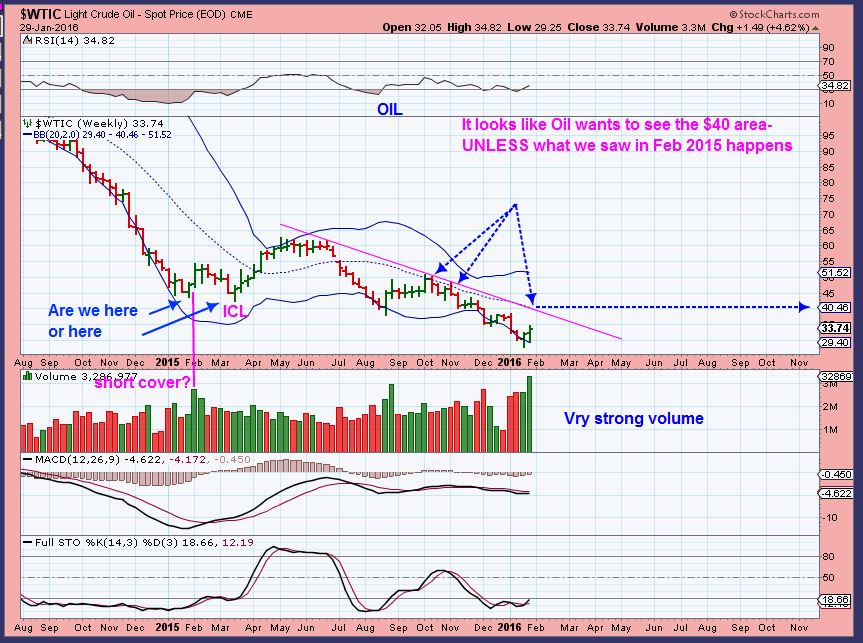
This move could look like this red arc and roll over to $26 if this is not an ICL in Oil. The Green arrow is if Oil put in an ICL. Yet to be determined, but energy stocks are very trade-able right now for short term traders. More on that later.
.
NATGAS Jan 20 chart – This was a rocket on the first leg higher, then pulled back in a normal manner.
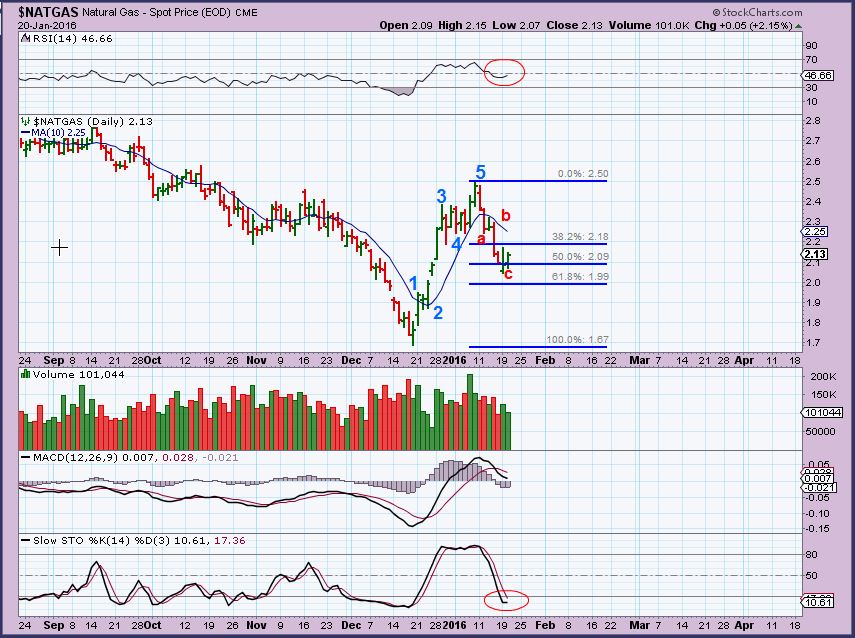
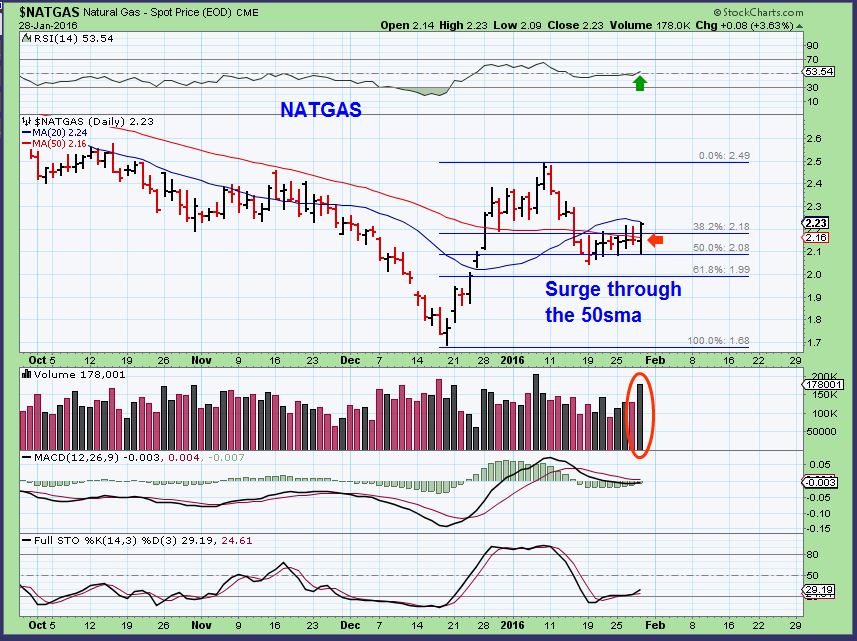
It lingered at these lows for days and I was worried about a possible bear flag, but it broke out above the 50sma on Thursday as shown . Now I expect a 2nd leg higher.
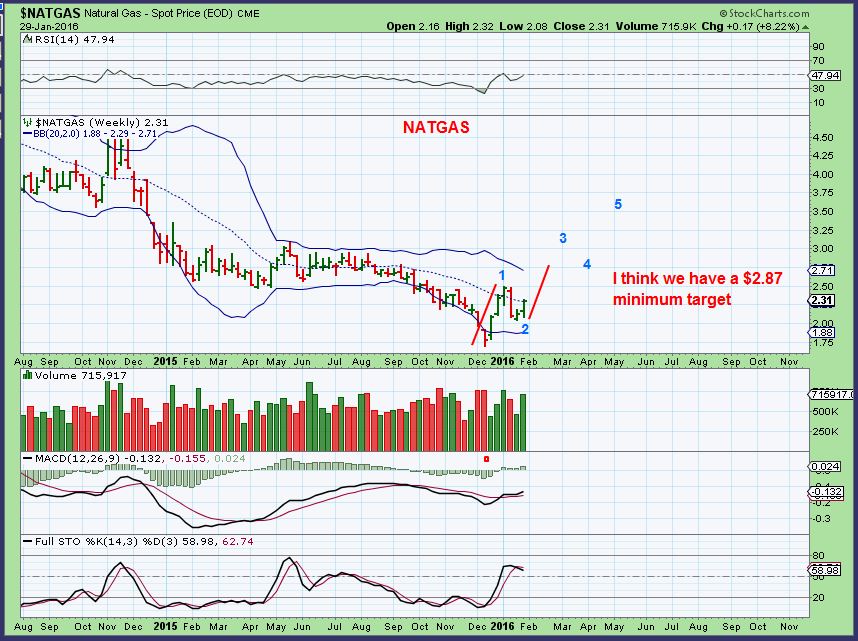
NATGAS WKLY
.
GOLD , SILVER, and MINERS
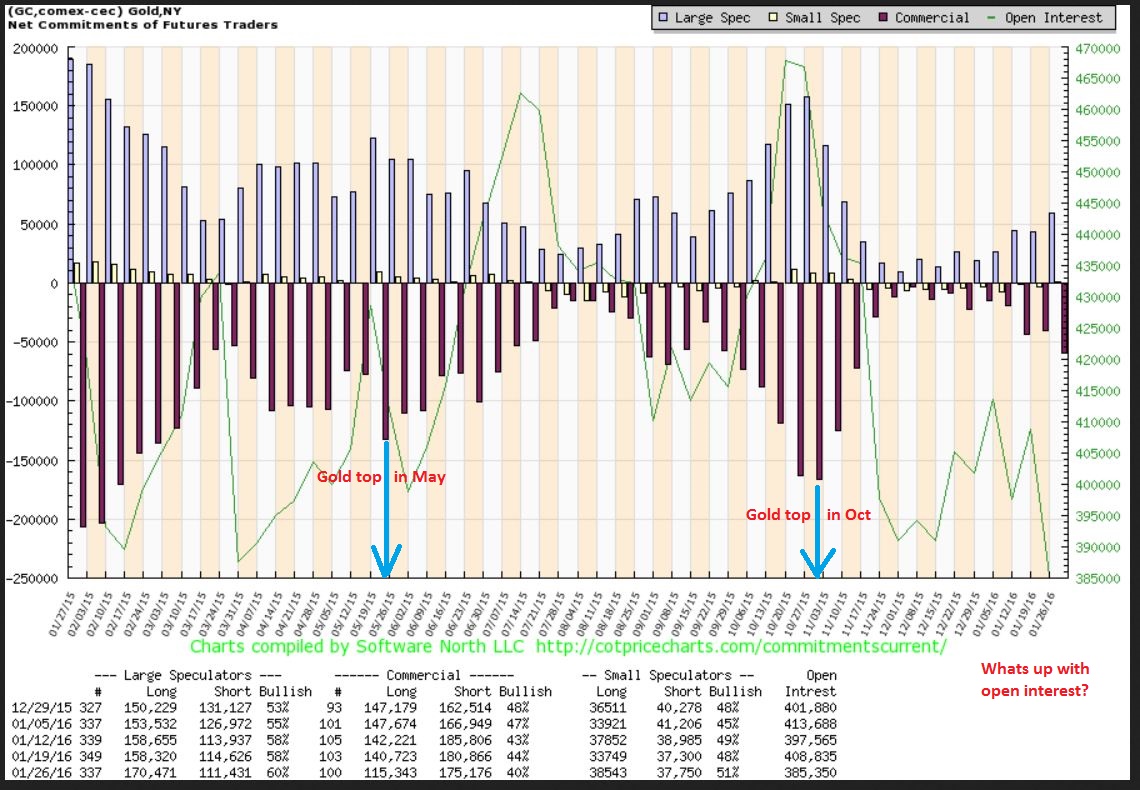
The C.O.T. has increased, but I point out other Gold highs here and you can see that we are well below those level.
Gold Jan 29 – Gold closed higher when the USD spiked over 1.14. Gold bounced off of the 8 ema too.
.
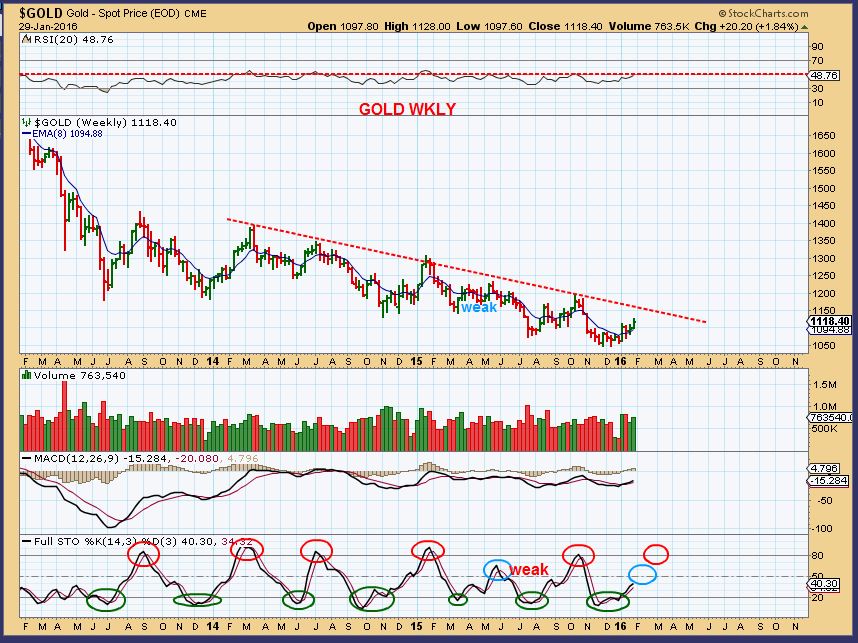
GOLD WKLY – Follow the stochastics.
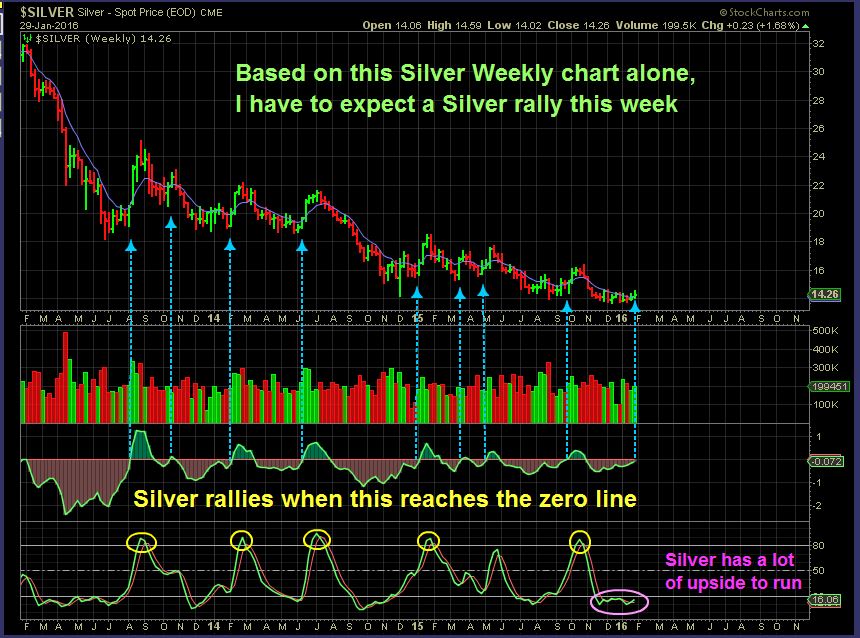
SILVER WKLY – This could be ready to POP this week. Stochastics is STILL oversold.
.
I checked social media this weekend and while some are bullish, I also see quite a few people saying ” The strong dollar is back, I am shorting miners.” or “I’m Buying Dust.” That is good. We want people to think that this move is not real and we want shorts to pile in ( And cover as it continues higher).
.
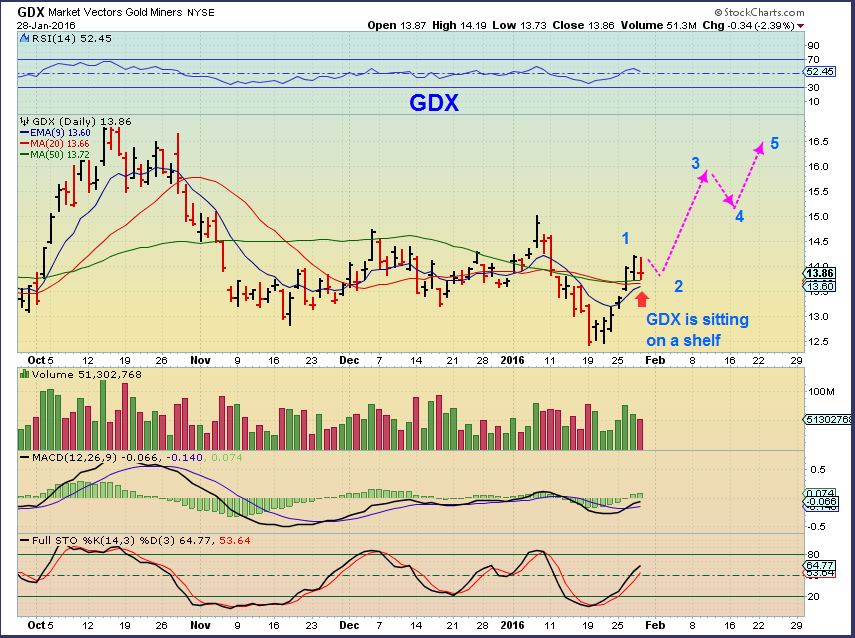
GDX can pull back and still be fine, but also I thought that it was interesting ( and bullish) that …
GDX – Made higher highs Friday with the $USD rocketing higher.
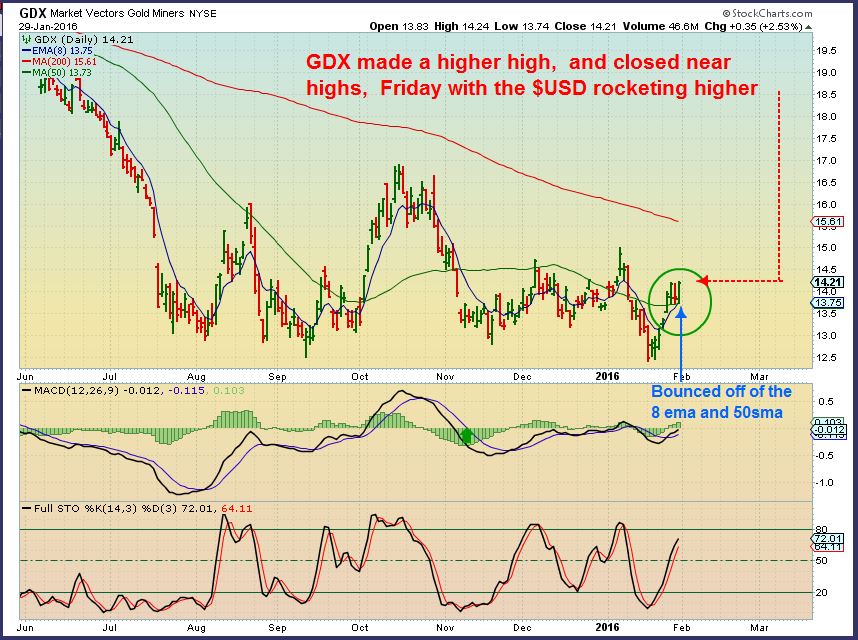
My chart from GDX Jan 28. Please note the gap open at $13 & $13.50 . We could drop there, but it just seems that we would have dropped there Friday with the dollar up over 1.00 .
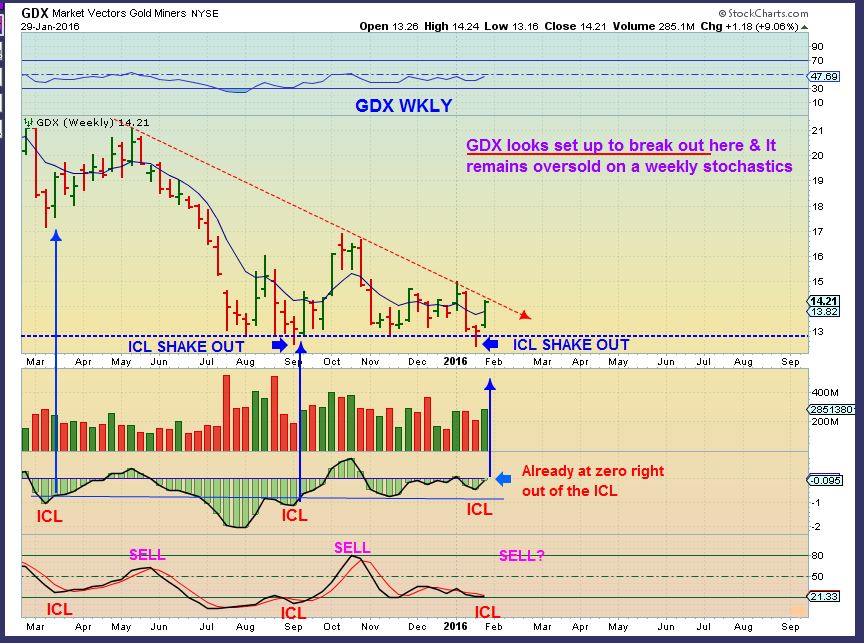
GDX WKLY – Shake out and we are pressing against a down trend line. so early in the ICL my middle indicator is already at the zero line. Bullish in my opinion. Also oversold on the weekly stochastics. I would NOT Be shorting this, unless it was just a quick trade.
 .
.
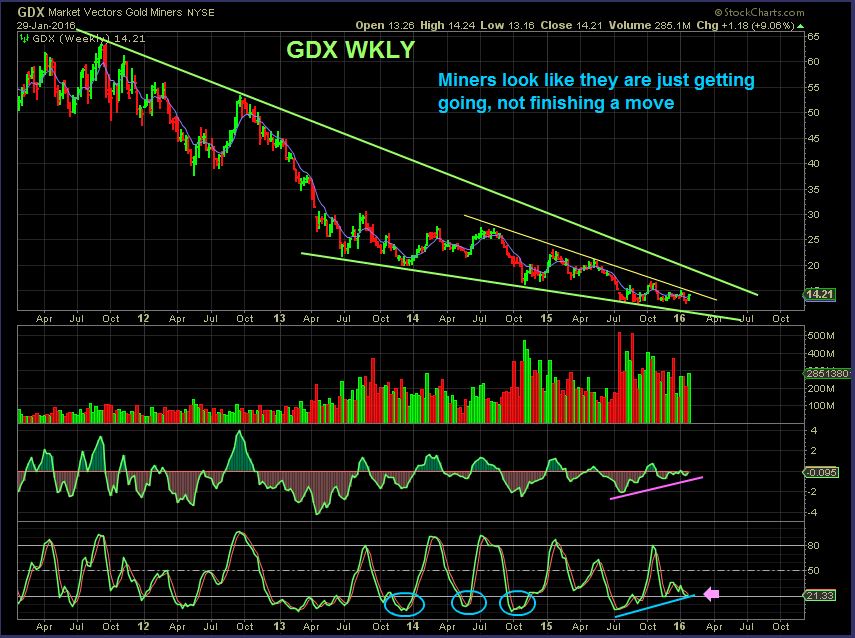
GDX WKLY #2 – So early in the ICL for miners, we look set to break out here. We could get a break out by the end of next week. The weekly stochastics remains oversold, with good divergence at these lows.
.
So – I want to release this report Saturday night. Even though I think that this report has enough in it to express my views on the various sectors, I do have more charts to share. I will try to release another report before the open on Monday morning. I will include more views on the big picture in miners and I also will try to post some trade set ups, because there are many short term trade set ups that look pretty good. The hard part is OIL / Energy sector. Many set ups look very bullish, but if Oil does roll over, they will drop too. They need to be monitored closely.
SO enjoy your weekend and I hope that this gives you a good idea of how I see things lining up. My next report will add reasons that I feel Miners are bottoming and running higher, rather than setting up to drop. Like I said, I saw many people on Twitter, etc. wanting to short the recent rally. Yes, we could pull back a bit here, but I think that we are heading higher sooner than later. I’ll have more on Monday morning. Thanks for being here! 
.


😀
Still awake?
http://www.bing.com/images/search?q=night+owl+gif&view=detailv2&&id=FE00037BEC337ABE7A147F41C68CF9E14C3079FF&selectedIndex=23&ccid=fLgw8oJg&simid=607990687920948297&thid=OIP.M7cb830f28260d9e419c964b6290dff1fo0&ajaxhist=0
… exactly..
Stellar charts & analysis ‘Chohtfreak’
*especially oil charts . Phew…
Always enjoy your “now let’s look at charts”.. Gas is poised could get goosed with a cold front 🙂 ?
Wondering what you think about these rounded bottoms for gold and silver? Short time frames ..but?
I love the rounded bottoms. They can be a normal base action with good gradual upside.
V-Bottoms are great too, but at times they are just short covering and drop quickly later.
mmm hmmmm …..
So in an uptrend, the dont look like bottoms, but a good example In Gold and Miners is when we get a CUP & HANDLE formation on the way higher.
The cup is like a rounding bottom , the move higher doesnt have to test the bottom of the cup 🙂
So I do like the rounding bottom in Gold right now and in some Miners. It is a steady consolidation / accumulation RATHER THAN a v-bottom solely from Short covering.
Ahh..yes.. big fan of rounded bottoms myself.
… and that gdx weekly chart with your indicator pressing against the zero line… smokin hott….
Thank you Alex,
I haven’t found a ’round’ analogy with pog IT charts over the last 15 yrs., unlike the numerous historical examples you’ve retrieved from your diligent long term analyses. Thank you most for those.
me too
… reminds me of when I finally get to chart … I hop in my catsuit and say to myself … “to the batcave” …
You have a wonderful fun flirtateous nature here with Alex, ken, (as well as god no less 🙂 ) Refreshing… I know I have stilted language at times but I can only hope my boys hook up with similar attitude. Us beeks can just be all too serious.
🙂
Well in That case.. Nice little continuing tease of 5 bucks, feeling it’s way upwards, above that rounded bottom this evening.. huh?
Classic bear trap in miners. No guarantee, but many cyclical & secular trend changes occur like this.
LoL- You must have missed my last weekend report and a few during the week when I posted 7 or so charts showing the shake out / stop run in GDX and GDXJ?
It triggers 5 or 6 months of stops and gets scooped up by the big boyz. Refresh for last weekends charts / “Bullish Shake outs”
.
The inverse happened in stocks back in July when the Nasdaq brole out briefly to new highs.
It would be nice to finally be done with this bear market 🙂
Yes, And Gold in 2012 when it was supposed to break out and run to $2100, it just popped and dropped. I think we are seeing topping in the markets and this very well could be the bottom in Miners. .
I agree, a bull in Miners ( and other commodities) would be hugely profitable in time.
6 months of stops! whoa. Haven’t thought in those time frame before.
Yes, and that is often a nice way for a solid reversal to start, because the large group of players that got ‘shaken out’ from their positions of the last 6 months do not want to try again until they see a pullback to a higher low.
.
If there is only a shallow move or sideways move, they have to chase & add later, driving price even higher.
.
Is that the case here? Cant be sure, but it is a nice start. 🙂
Nice report Alex!
SPX count update…..if interested.
Thx,
This count makes sense to me Ken
Thx
Going to be an interesting next few months……..
It does fit your SPX Weekly rounded top chart At the 62% Fib. level…….if it gets there.
GOLD count……if interested.
Not the prettiest duckling in the pond but ……….
It would be an excellent sign if Gold could break that upper TL for the 1st. Wave then Test that same TL from above for the 2nd. Wave bottom then UP for the 3rd wave breaking the 100 sma………
hmmm…
. .. I’ll take some whipped cream with that wedge of apple pie…;)
do u have a crude update mrMountain?
I do but……I am concerned that the SPX and Oil are correlated at this time so If If If my SPX count is correct than Oil may follow unless something geopolital occurs.
I am long and unhedged though. 🙂
Not the prettiest? Anything bullish with lows in place is gorgeous after the past 5 yrs : )
This thing is literally “Off the charts”. ( Sorry, lame pun intended. )
Lol…….
I thought you liked those Wedges ! 🙂
Well now……..are you saying the Lows are in place? 🙂
Not really (Maybe) , but the count on your chart was : )
This is my first comment on CF and I gotta say, you have the highest quality analysis Alex! Glad to be part of this group.
I’m also seeing quite a few people not believing this move in gold. I have never received so many messages as I did in the last couple days from diff people telling me I am wrong (Some of you that are on stocktwits might know me as @alphahunt). Little things like the COT data becoming slightly less bullish are causing people to panic and DUST is a consistently trending ticker. This disbelief combined with the false breakdown in GDX are the 2 very things you want to see at a bottom.
Just some of the other positives for Miners:
– While GDX weekly is at resistance like Alex shows above, the HUI has broken out from a 3-year falling wedge this week.
– Quality individual miners broke out weeks/months ago, as Alex has been pointing out
– Several other asset classes that are positively tied to gold also look very bullish here (eg. real bonds broke out this week; Swiss Franc closed on 15yr support).
– The smart money positioning on should continue to boost. See chart below
Ha, too funny. You’re one of my favorite follows on ST. We’re lucky to have many great traders in the group.
We see bullish setups in many miners and gold indices. Do you like to diversify among them or only trade leaders?
I believe a basket of quality juniors/explorers will really outperform GDX (there’s a lot of junk that is weighing GDX down here and going forward). An example of good upside potential is with flagship NovaGold:
I agree . And a basket keeps the risk down. Even a great Miner can have a geopolitical risk ( even Flooding, Earthquake, Anything similar). If one puts all their money on a great company, the risk is still there.
As for NG. Bottomed in 2013 and put in that huge consolidation with higher lows IN A BEAR MKT. Can we expect anything less than brilliant when the BULL MARKET returns?
Oh hello & welcome alpha. .. the name’s vaguely familiar… smirk.
And the face : )
Hey Brian! An Old frind from S.T. – Thanks for posting.
Yeah, I saw the same thing with people jumping to dust right now saying that the lows were broken and this bounce was just a bounce.
Everything that we’ve been seeing ( & you stated above0 Seems to be unseen by others. Some Miners bottomed this summer and never got near lows. COT & Smart money. Etc Etc. Etc.
Its like at tops when people cannot see the bearish developments, at lows they cannot believe that a change may be taking place. Good stuff.
DUST continues to trend on social media! Seems people got permanently bearish when GDX made the false breakdown.
I liked Friday’s action in S&P and friends for a few reasons – 1) ended on the highs with buying pressure consistently rising through the day, 2) VIX got crushed – it had only been pulling back a little on market positive days – but the further out VIX futures were down pretty decent also, meaning more people were really starting to believe and dropping some of the puts. If IWM runs up to Alex’s line in the above chart (from this report), that is about a 20% move in TNA. For the last few weeks if SPY gapped open, it would sell off. Finally changed last week. Prior time that markets gapped open and closed on highs? Santa Rally just before Christmas. The black circles on chart are the intra-day dumps that were a January hallmark.
A 14.5 point pullback would be a 31.8 retrace of Friday’s move, 23 a 50%. Markets closed at extremely overbought on short-term indicators (short term only!!). Would have expected pullback here. 1904-1904 is EMA 8/9 area, 1900 also support. Just sayin