
Hang On Kids- Its Fed Wednesday!
What can I say here when we all know that charts could be quite different after the Fed Mtg on Wednesday? Lets just review some expectations.
.
The SPX, Dow Jones and NASDAQ have recovered nicely from the summer sell off, but a few areas have yet to catch up (If they are going to). I showed this rather bullish looking set up yesterday, but…
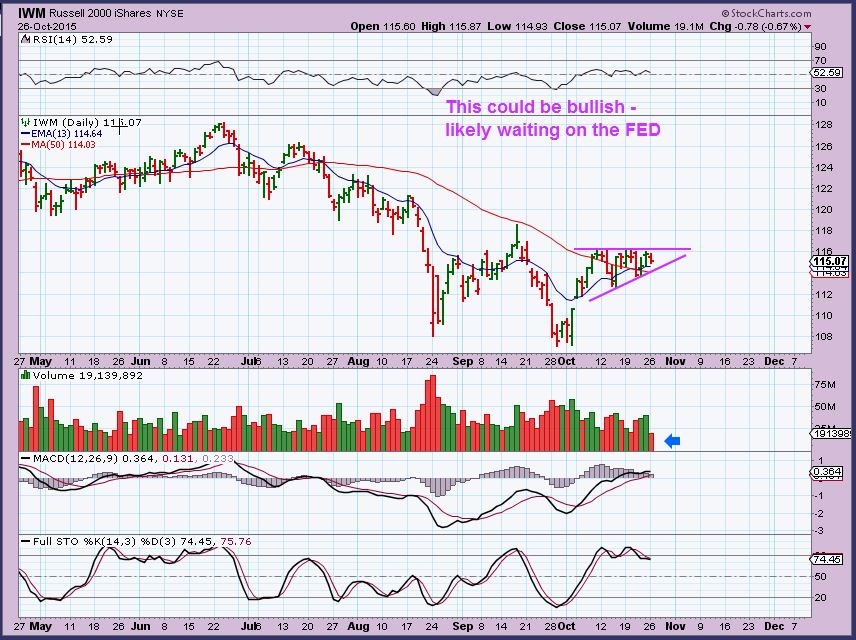
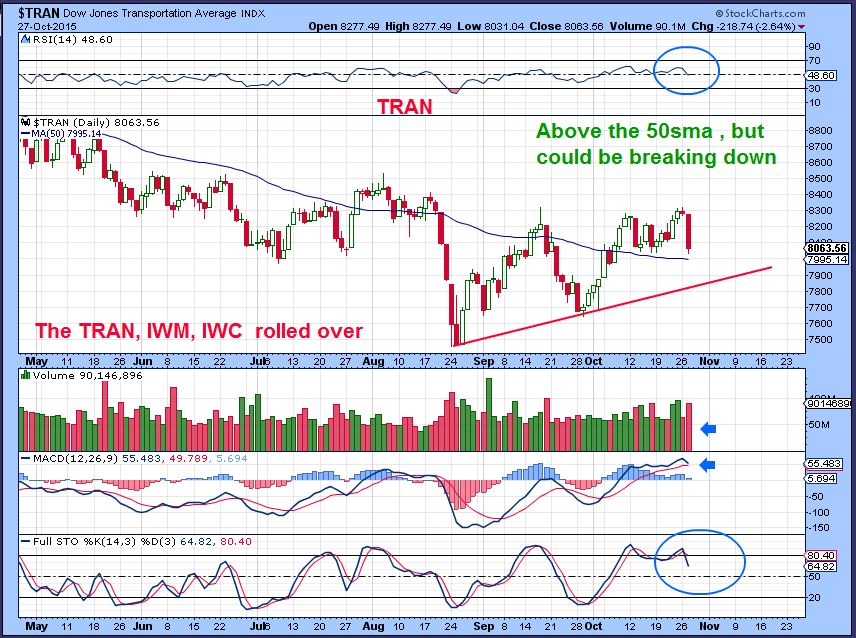
Today the TRAN , IWM, and IWC sold off nearing the close. Is it a fake sell off or is smart money heading for the exits Pre-Fed? Lets take a look…
This is the TRAN Tuesday. Its not broken and remains above the 50sma, but the selling did pick up.
AAPL had earnings released in after hrs and basically did nothing , when most expected an explosion higher like GOOG & MSFT . Stay tuned for market reaction.
.
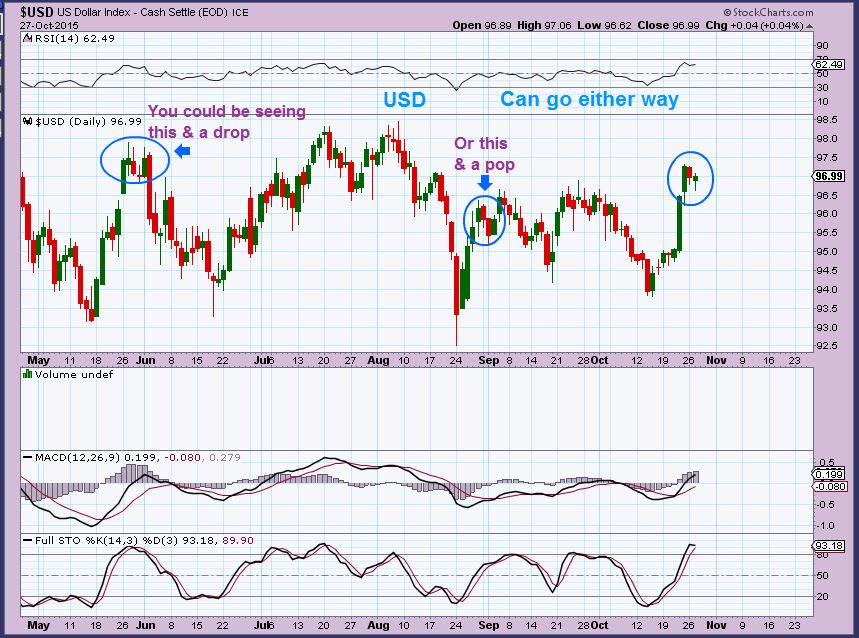
THE $USD – The pattern isnt Bullish or Bearish. After a strong run higher, it could go either way.
Cycle wise, we would expect it to roll over, but the FED will make that call.
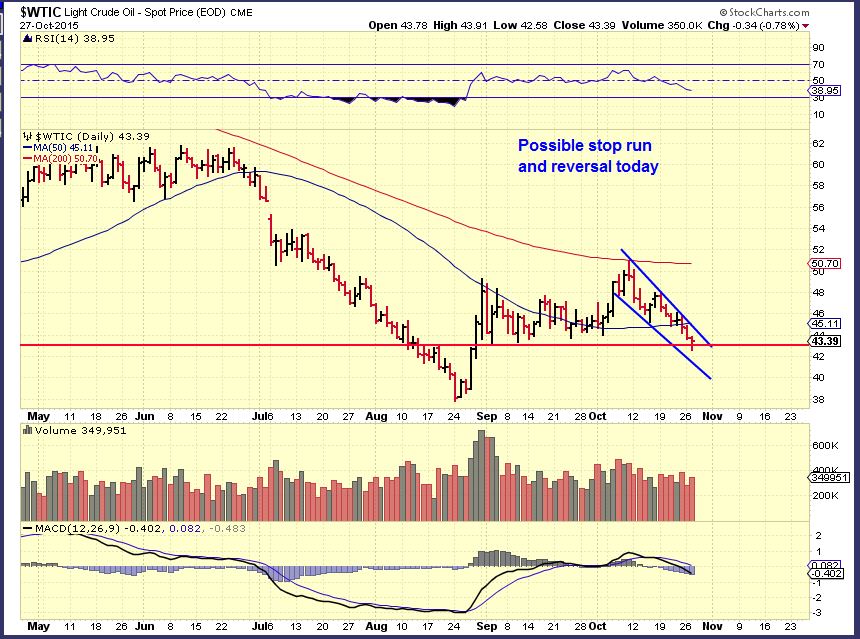
WTIC – We were looking for a possible “Stop run” below $43.21 and a reversal.
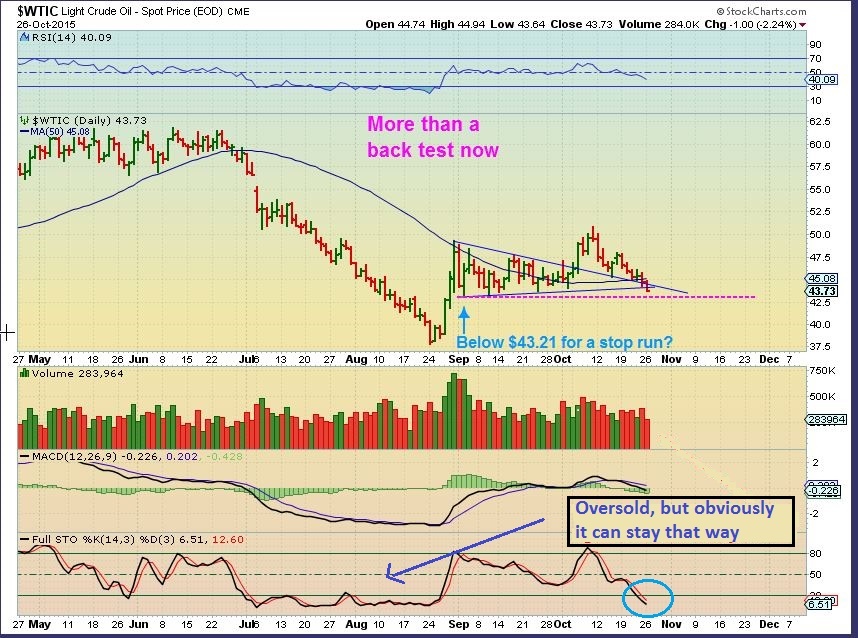
WTIC – We did see a reversal today and a possible ‘stop run’. Day 45- We are expecting a low and this would be a good place for one.A move above Tuesdays highs ( $43.91) is likely a low in oil.
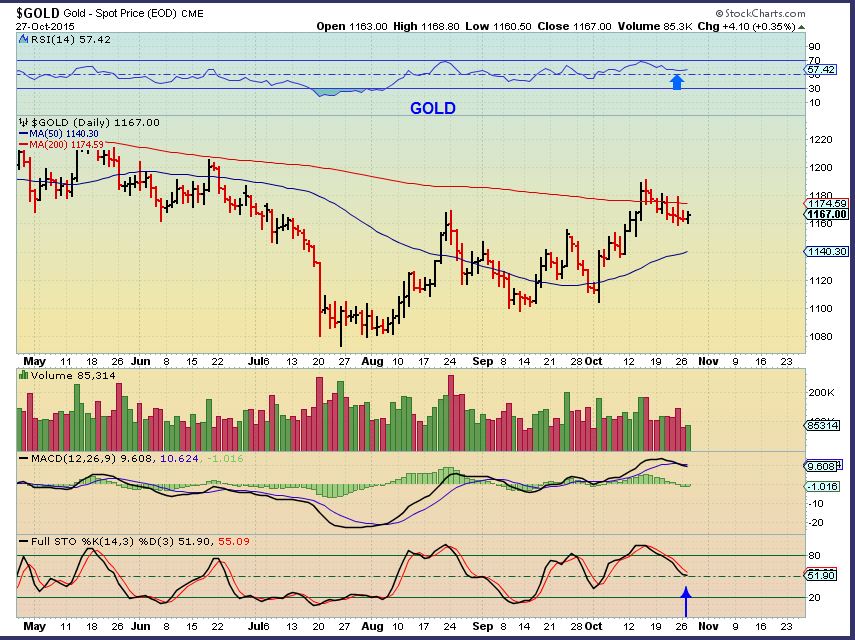
GOLD – Gold has been holding up bullishly and it could be in the timing for a Daily Cycle Low (DCL) . The FED MTG almost always affects GOLDS next direction, so Wednesday & Thursday should find the answer. I like $1230+ if it breaks out higher .
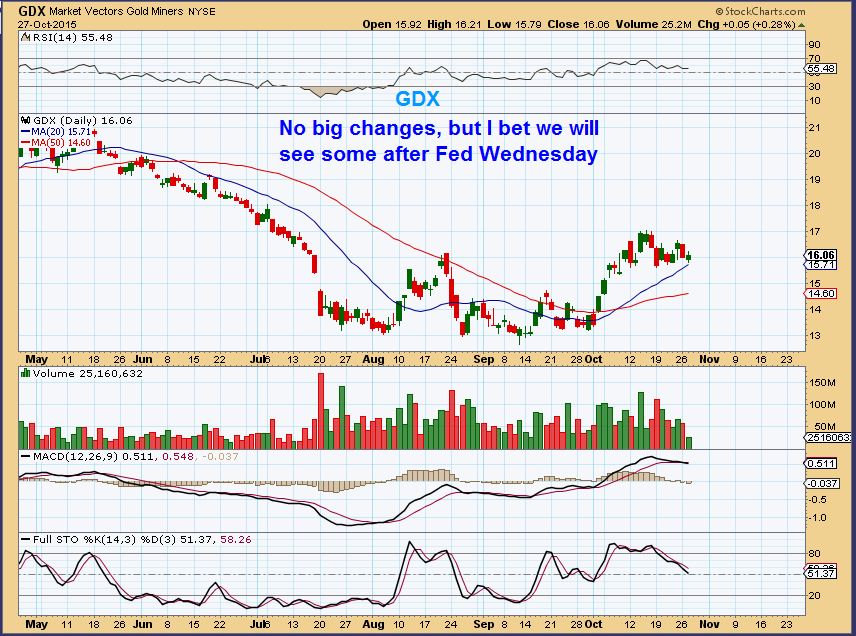
GDX – Miners have also been holding up well. The 1-2-3-4-5 is still possible. If The Fed reaction is strong in a positive way for Gold, this consolidation gives GDX the opportunity to break above the 200sma with gusto. GDX $19 would be possible.
SO all of these charts look like they could go either way after the big event. Often the initial Knee Jerk reaction at 2 p.m. changes by 3 p.m. Eastern time, so be aware of that too. Charts can go from Bullish looking to Bearish and visa versa in a flash of news too. Look at the Dollar for example. It was weak and looked like a bear flag was forming until last Thursday and Friday. Boom! Events with the ECB and China changed everything. The Feds decision or word of inflation increasing, etc. can do the same.
Traders will trade the set ups as they always do, but for most it is best to just fasten your seat belt and be patient. There will always be another trade! I held on to my AUY trade mentioned in the chat/comments section today. Happy Fed Day. 


Thanks Alex for your update, while you have a lot of other thinks on your mind.
Have a save and wonderful day.
Geurt
I actually couldnt chart NATGAS today, because the stockcharts chart was incorrect, but it seems to have bottomed . I know you said you own UGAZ at $4, so just keep a stop.
It may be an intermediate low – A longer lasting one, but with UGAZ, just trade it.
P.S. Fed days are crazy
Yeah, took me awhile to figure it out, Alex. Natgas is NOW $2.30. That is correct. The Nov contract expired today at 2.03 BUT the Dec contract is 2.30. How do we chart that one?? I don’t know. So what happens to UNG? Even though Natgas spot/1 month future is higher, UNG got crushed when they rolled their contracts out. Can you say ‘contango’? So the issue is how to chart a 3.5% whooping on a flat day! I’ll leave that to the expert…
Guert,
Another site I watch posted this publicly on Nat Gas. Might interest you. refresh if it doesn’t show up
This chart is true in my opinion Bill, this is how I see it too. ( That is UNG, but NATGAS is similar) We can bounce and curl back down- or just move higher.
I tried looking back at other lows and NATGAS is tricky. Sometimes it bounces and sometimes takes off (ICL). This may be an ICL .
See on that chart that at each dcl pointed out, it used to run to the top of the bands, and was kind of sideways bouncing ( weak) now it only bounces to mid point of the bands ( or maybe 20sma). Those were weaker bounces. If this is an ICL, it should go higher than the mid point ,
Guert,
Did you see this on Nat Gas
http://www.chartfreak.com/2015/10/natgas-public-report/
Thanks BILL…. NO I didn’t saw it. Thank-you for sharing it with me!!
Keep an eye on Nat.Gas my dear friend!!
Guert, hope you saw my chart last night (Tues). Also see just below reply to Alex on UNG contract roll. CME Group has the futures prices: http://www.cmegroup.com/trading/energy/natural-gas/natural-gas.html
My tale of woe…Yesterday AM I bought 5k of RAD @6.06 and because I could not watch charts (I’m painting interior of house) I put sell order @ 6.15. A hour later I took break and saw RAD over 8.50 and trading halted. My shares got sold 6.15. Woulda shoulda coulda. Can’t complain, made money. Just wanted to share this story with people who understand.
that’s tough brother, we understand
Wishful …. I HATE THAT! That happened to me with a Miner once. I had a boat load of shares that I held onto for a year or so in the old days ( Maybe 2003?). I cant remember exactly, but it was something like bought it at $2 area and it had gone to $4+ and I sold all but 1000. It got bought out later on and jumped much higher. Ugh.
That RAD deal was just a piece of timing that you could do nothing about. Try not to think about it, though you’ll NEVER EVER FORGET IT 🙂
It’s all part of the business I guess, but your right….I won’t forget but I’ll tell it to the grandkids when they get older 🙂
Walter – Nice to have you posting here.
Good to be here. bought UGAZ @3.61
Sucks, but no way you could know they were getting a buyout offer like that. We all have similar stories (but mine isn’t nearly this good!!). Maybe a trailing stop next time? Though I often use limit sell myself so I don’t have to give back 2-4% if think we are at near term top.
Anything explain the PM pop at this moment in time?
Fed not for a few hours yet
Front loading on expectations? Maybe
I think so. Looks like the consensus is the Fed doing nothing until next year now. Hopefully they won’t say something stupid and kill this rally.
Looks like they said something stupid
Rate hikes on the agenda in December. Other than that nothing new.
Hi SoG. Do you know what time is FED announcement?
is it not 2pm EST?
im not sure, im in UK … we are 5 hours in front of US over summer (BST), so Fed has been at 7pm recently.
But… clocks here went back to GMT over weekend, so it should be 6pm for me.
i dunno first i probably know about it is when something shoots up and i miss getting onboard.
Thanks SoG.
Alex mentioned ‘reaction about 2 pm’ so I’ll watch what happens then.
Fed is always at 2PM Eastern. Never varies. When full notes come out in 2 weeks? 2 PM.
Bought UWTI here. Crude found bottom..
woo hooo … dang looking good.. day we’ve been waiting patiently for… now let’s see if it holds…GL all :o)
CF .. I can’t believe you’re missing this… giggle….
double digit moves.. on relatively low volume in all my energy stocks… hmm
Congrats! Always like it when someone does well! This chart is a few years old but do you think this oil run might be short lived or can this run overcome the seasonality? (My first time trying to insert something. Hope it turns out.)
congrats on your first post! it worked .. :o)
Sorry but I cannot answer your question.. that’s one for CF (Chartfreak) …. or one of the other oil guys out there in CFLand…
Hi Tiger5
Chart worked fine. Below is a link to my TA. I went long this morning on crude using UWTI. I think we have a long steady ride higher. You can see my targets. The expected path is in gold candles. Good luck.
https://www.tradingview.com/chart/USOIL/P9wK8W4x/
Thanks Bill! Always appreciate your work. I was thinking of jumping in EXXI yesterday, dang it. Now I am wondering if I should wait for a little pullback or just get in now. Your chart is helping with that decision. Thanks again!
Last run up in Gold I was waiting for a pullback in NUGT to get in, never came. The candles look like there won’t be too much consolidation.
Bill… where are the candles? Did you put in a chart?
Thanks.
Geurt
Click the link in my replay to Tiger5, you can see the expected candles in Gold color.
Hi Bill,
saw your chart and it looks pretty good. I have an elliot Wave Intl chart from some one and they have indeed a Wave 4 going up close to your projection – well done and keep it coming !! t’s Always nice to have your charts
ray
Hmmm…but a Wave 4 is always followed by a Wave 5! Trouble ahead?
Bill, can we get past $50 for higher high?
Easily, I see 54-56 range for now.
Yes, negative seasonality due to refining cycle and distillate usage. But after such a protracted downtrend will it bounce against seasonal factors? Fundamental question, can it meet or beat expectations that are lowered based on normal seasonal fluctuations – that will be the key vs this chart.
Thanks Cason. That is what I was thinking as well. Couple that with Bill’s chart, we should see at least a bounce if not a decent new cycle.
Bullish scenario is we put in a daily cycle low in an extended first cycle from Aug lows. This would be right translated, meaning next cycle should pass recent highs.
Expect potentially big initial move up near $50, consolidation, then potential for 2nd move. I’d watch the 200 day sloping down as well as Fib from recent slide. I’d bet you a Farrell of WTI Crude Alex has that in his rpt tomorrow. 🙂
Oil looks great. I’m att the airport , boarding in 5 minutes. NOT missinng a thing. WOOHOO
CJES still low risk entry, EXXI big % gains, All looks good- Miners look good ( I believe the smart money is front running the FED here, but we still have to see if they are right or are they day trading 🙂
Best wishes all.
EXXI crazy.. it led my list …
SO MANY low risk set ups if we have fed follow thru too.
Many went back to lows ( Double bottom) like NOG, KEG, lgcy, BAS, etc
There will be time to make gains even after the fed.
Boarding now…cya
BAS lagged today, but at least GDP got in a day that could be referred to as ‘didn’t suck’
wow T.. G .. S . … lol
I really needed this!! Hope we can get some follow through!
Bill Maria • 19 hours ago
I don’t see anything about either one that tells me a turn up is happening. Fib levels? Maybe
…now do you see it Billy? ;o) TeeHee….
OAS… nice ….
OH………In my face! 🙁
Fair Enough….
hey.. nice charts on tradingview
i had know idea you posted there… kudos…
Thanks my fair lady! I believe the bottom is in in OIL, not so sure on GOLD? We’ll see by 3:00!
yip yippeee..
Check your charts lately Missy?
he who gloats last gloats longest.. 🙂
SOG, yes, I’ll take the high road here and drop it all.
alright you two…
u guys must miss me …………
Maria, you keep it light and loose around here.
teehee… u just wanted to say Maria and loose in the same sentence.. (smirk)
lol.. high road myA$$….
SD? lol … gigggle… ha ha h
Is this a 3rd Daily Cycle for Gold ?
Tough to tell, all muddied up. Either day 32 of 2nd cycle or day 2 of new 3 rd cycle.
Will the real GOLD please stand up! WOW.
indeed wow.. looking like oil may be the place to be for weeks ahead
Are we on day 32 of the 2nd DC for Gold? Anyone know? The first DC lasted 38 days.
Alex’s weekend chart would have us on Day 18 of daily cycle 3.
If we are on day 18, then we had a real short, 13 day 2nd cycle. I bet we are on day 32. The First DC lasted 38 days, so day 32 declining makes sense to me. Thats the way I see it anyway.
$25 move down post-FED. Incredible. I don’t know why I should expect anything different.
Carl, notice that although well off morning highs, silver is still higher than yesterday’s close. Compared to that drop in gold a 3.5% drop in NUGT is a huge victory.
True. I think they are setting up for a bad GDP number tomorrow but either way I think the miners are setting up decently here. We’ll see..
Agree. Not a low risk entry right now, but may have one soon.