Lately things are playing out as expected, but it’s always good to check this puppy out and see what is happening along the way.
I didn’t have a Friday report post Fed, because I had 2 reports on Thursday. Lets review charts and see how things played out.
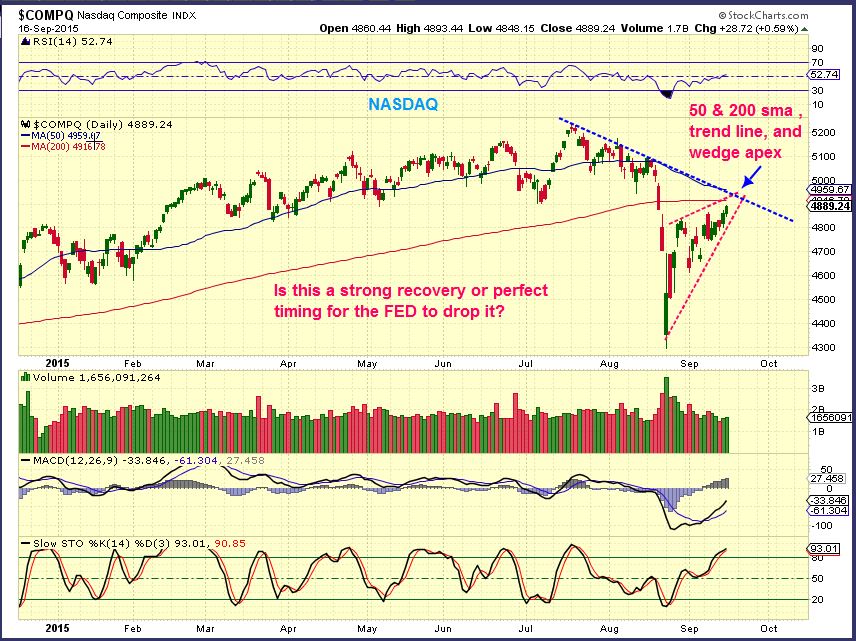
My NASDAQ chart from Sept 16 – Many were thinking that the markets were ready to rally to new highs after the Fed decision. I saw a rising wedge and a lot of resistance.
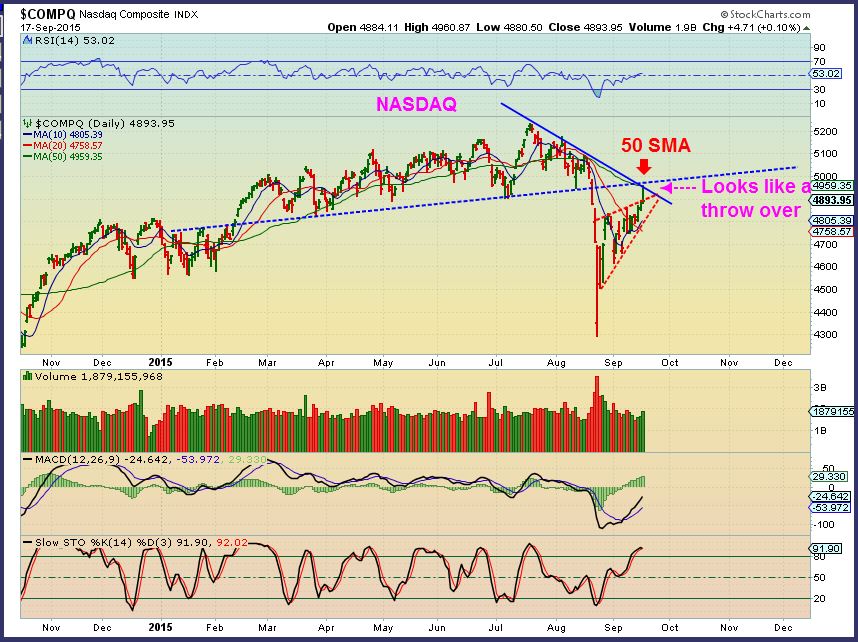
NASDAQ Sept 17 ( Fed day) Rejection at resistance. This was saying to short the markets.
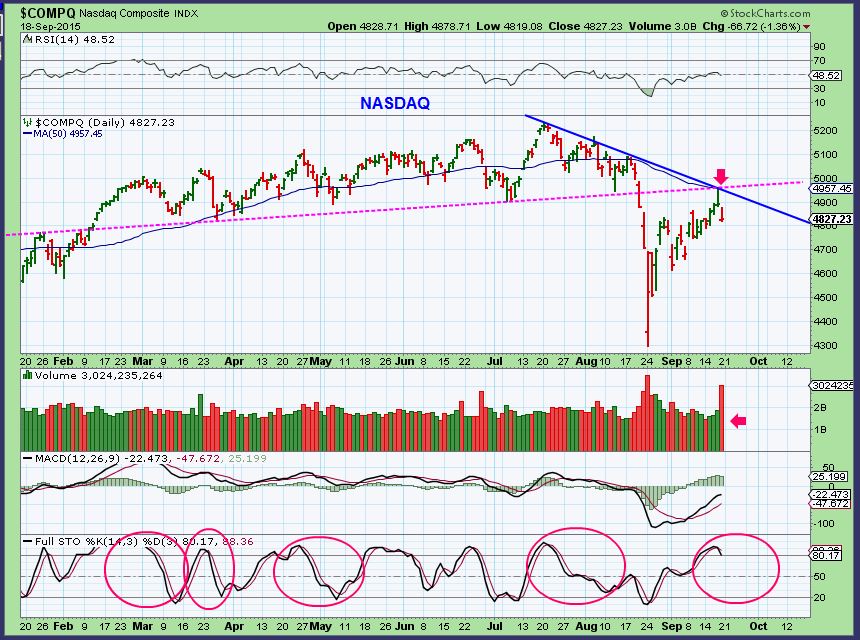
NASDAQ – Friday Sept 18 , The day after the Fed Decision. This is still within that wedge, but that was a high volume drop and there is a lot more room to drop stochastic-wise.
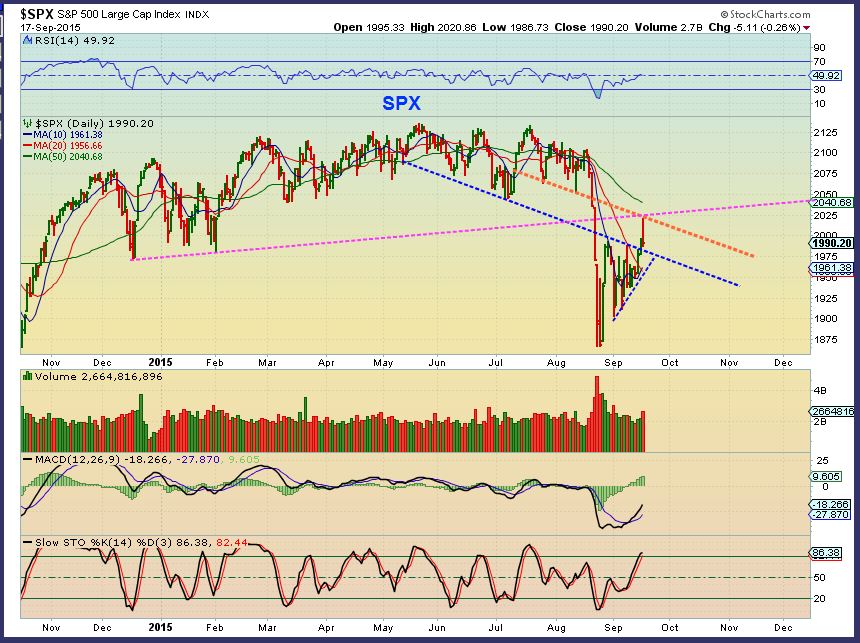
This was the SPX on Thursday Sept 17. Price was rejected
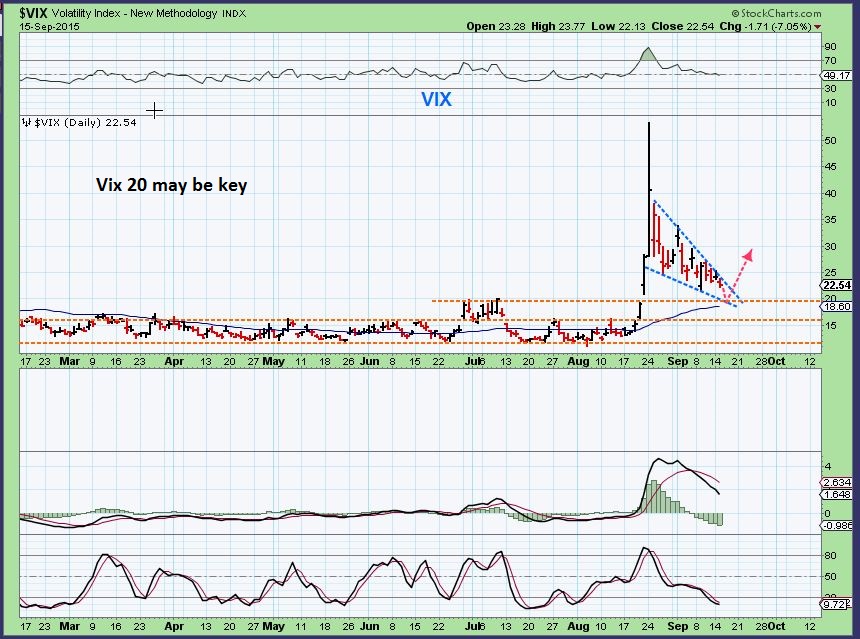
Shorter term, I was watching for the VIX to drop to support. This was the VIX on Sept 15 , the Tuesday before the FED RELEASE. It had time to drop as the markets rose going into the Fed Mtg.
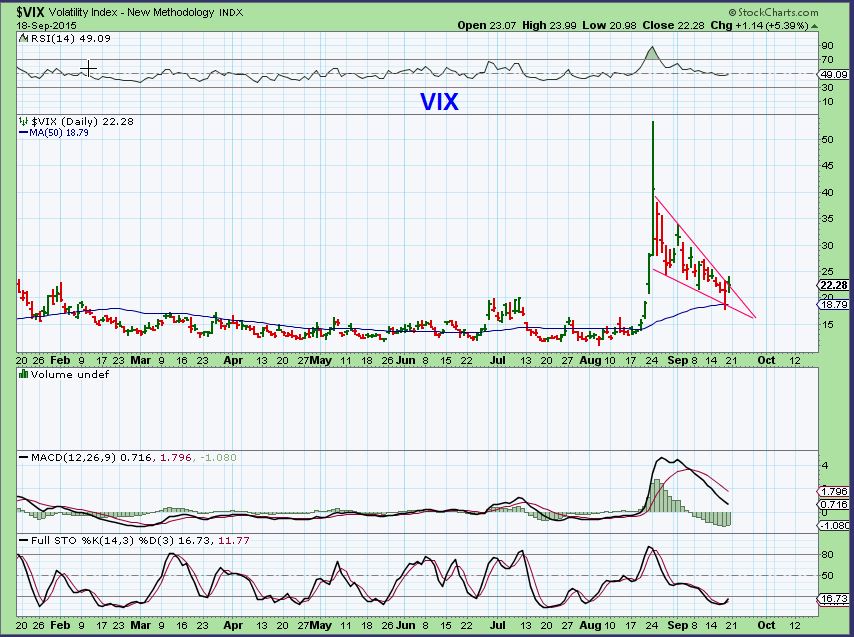
VIX – This is the Vix currently. It dropped and reversed as the markets turned down Friday. If the vix rises , the markets drop, so this can be viewed as a ‘short’ signal on a break out .
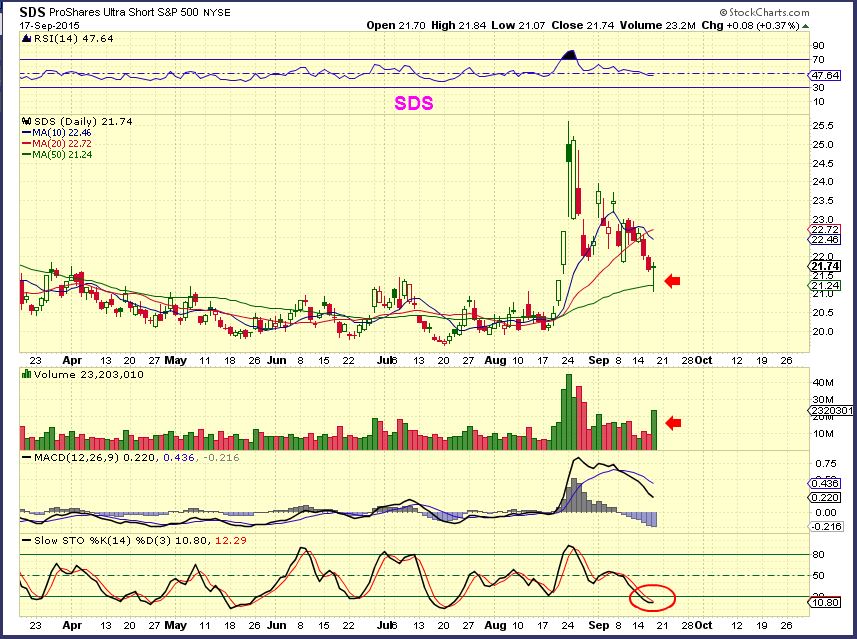
SDS ( See also TZA, QID, SOXS, ETC for possible ‘short’ trade ideas) This was after Thursday. If the Markets are testing the lows, these will test near the highs.
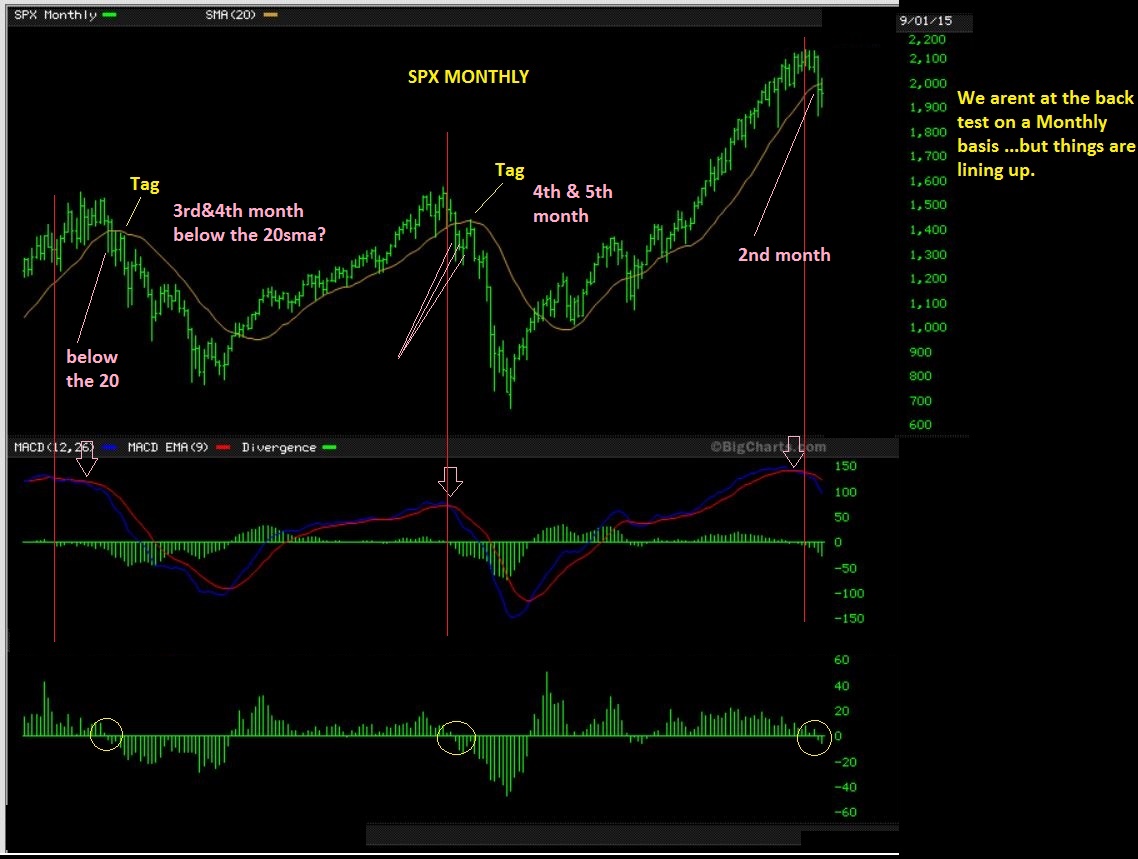
I also wanted to go back to the Monthly chart of the SPX, because I mentioned that we may have a shorting opportunity on a back test in the future. I dont think that we are at THAT point yet. We are at a shorter term short, maybe testing recent lows.
SPX – At the 2 prior tops, we dropped below the 20 MA and then ‘tested’ it weeks later. We will watch to see in the future whether or not the SPX can actually recover above this area, or is a back test of that 20 MA on a monthly a good shorting opportunity?
Lets look at the Dollar
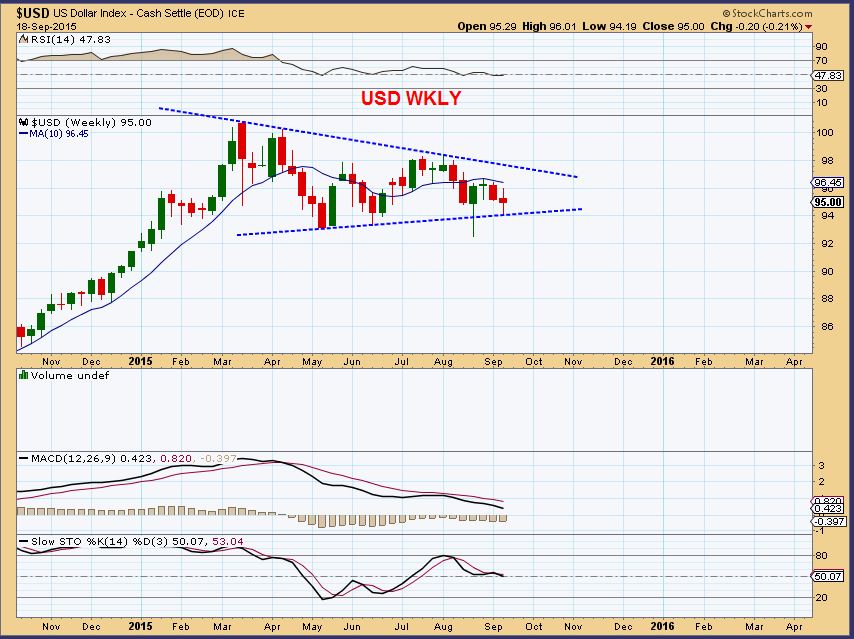
USD WKLY
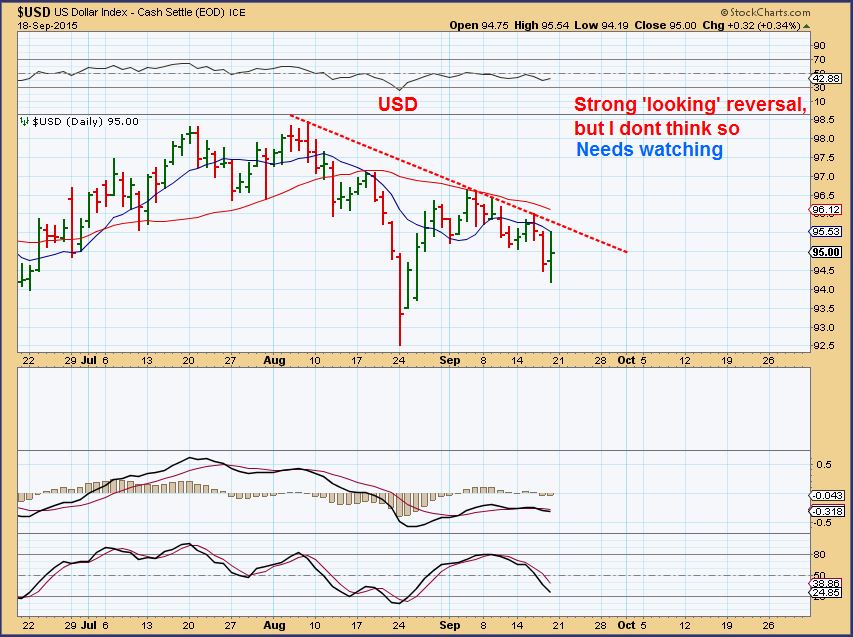
USD DAILY – That was a strong reversal Friday, but it needs follow through and has plenty of overhead resistance. Gold didn’t flinch with the move higher in the dollar, possibly indicating the move is fake.
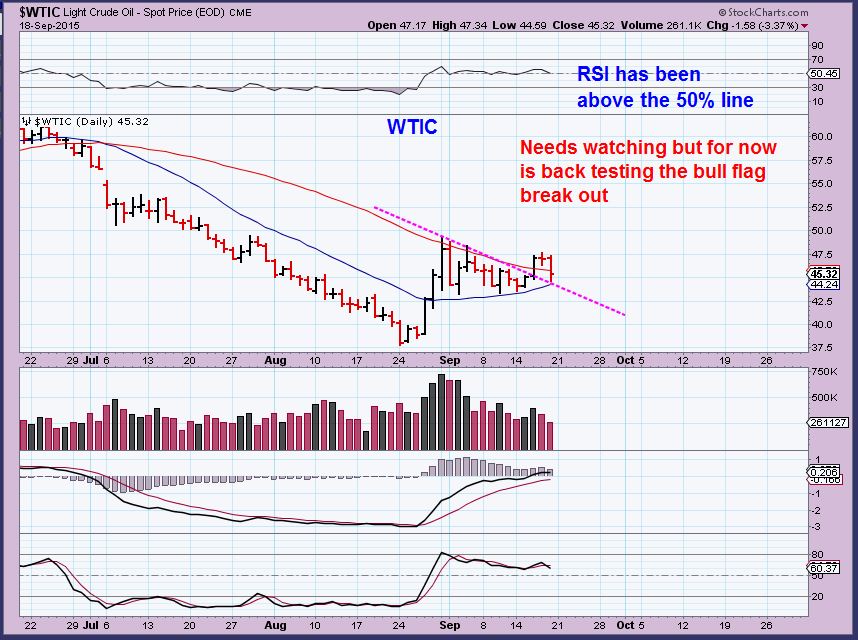
Some got concerned with OILS drop Friday. So far it is just a back test of the recent break out of the bull flag that I was pointing out. We do want to see a move higher A.S.A.P.
WTIC
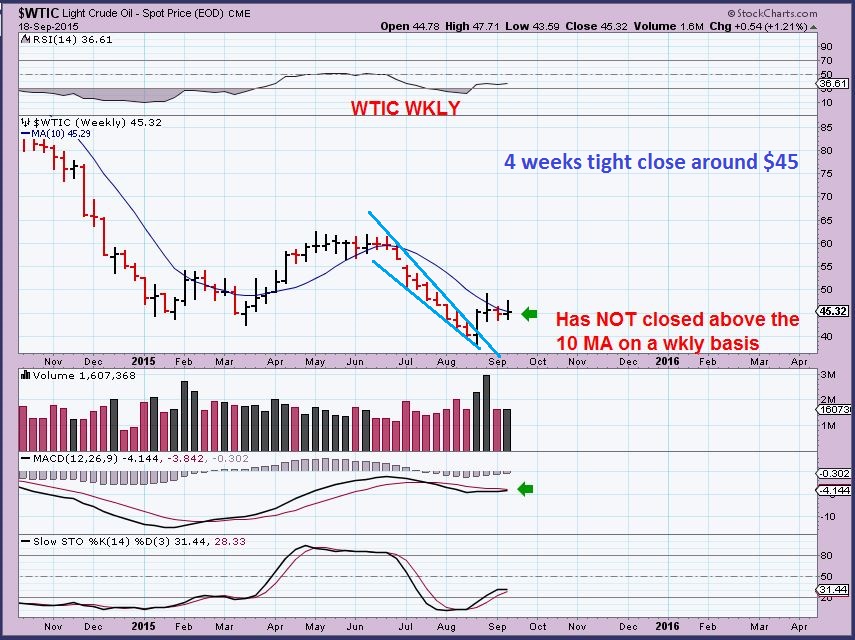
WTIC – Oils weekly chart has not closed above the 10 MA , but price may be coiling or consolidating do do so.
Lets take note of this:
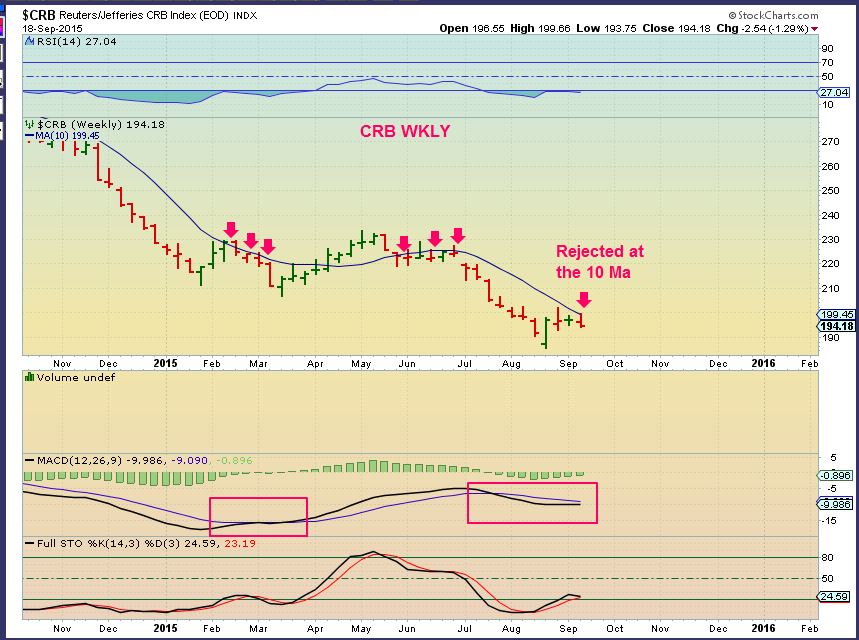
The CRB is a bit more concerning to me. This is (so far) a rejection of the 10 MA on a wkly.
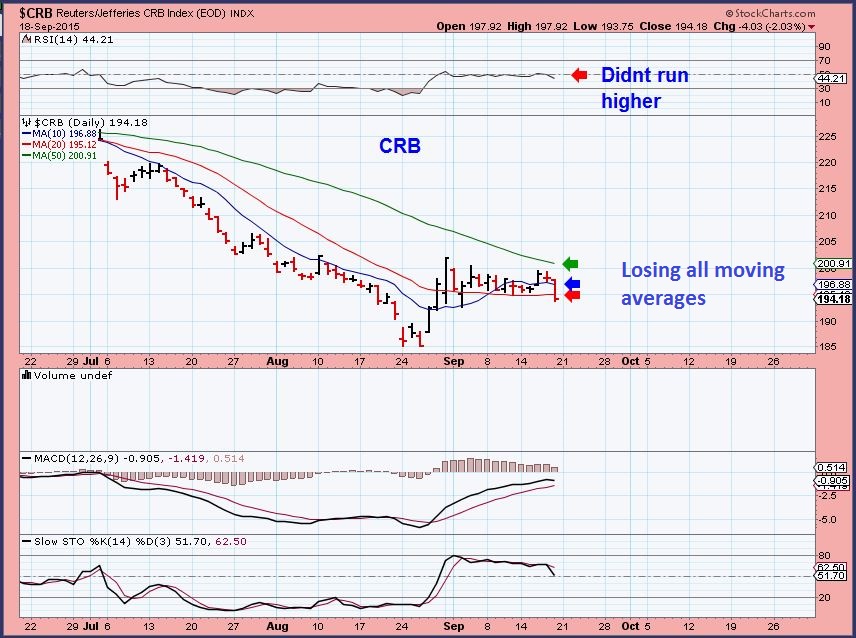
CRB DAILY – This also shows signs of weakness. ( I looked at X & AKS and they were a bit unhealthy. I looked at AA, CENX, NOR, and they were ok). I am wondering if the markets will take down some commodities? Precious metals were not taken down.
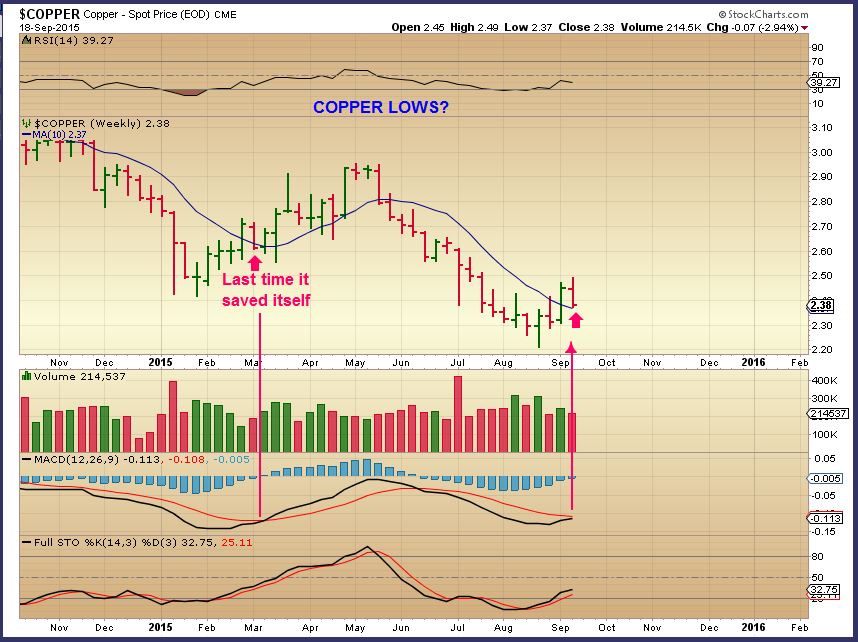
So lets see Copper WEEKLY. It turned down this week, but it did this in the past and recovered too. I’ll lets pay attention this week to commodities vs Precious Metals vs Oil, etc. FCX took a hit Friday.
Precious Metals
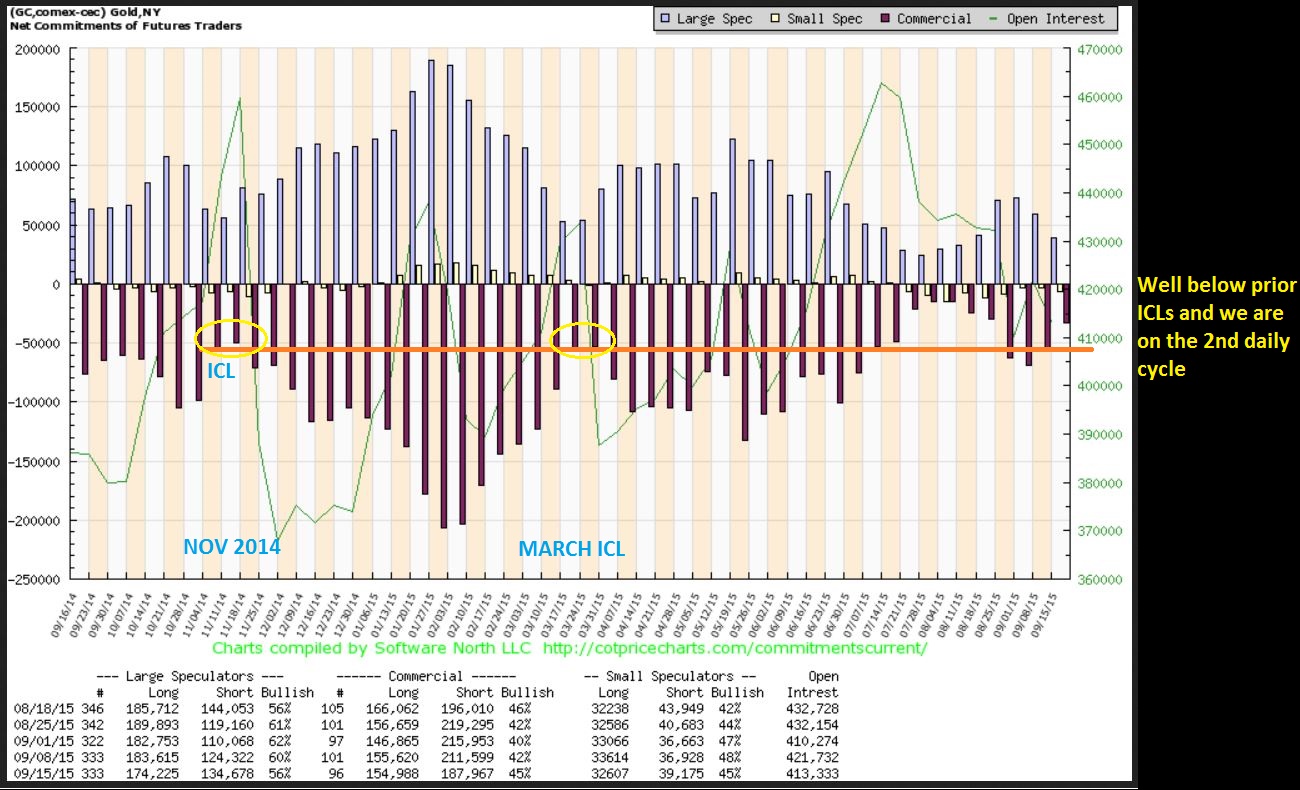
Starting with the C.O.T. , we had a drop in Smart Money Shorts and that is bullish as we approached a DCL . We are currently still at a point that is lower than past ICL’s. That is Bullish.
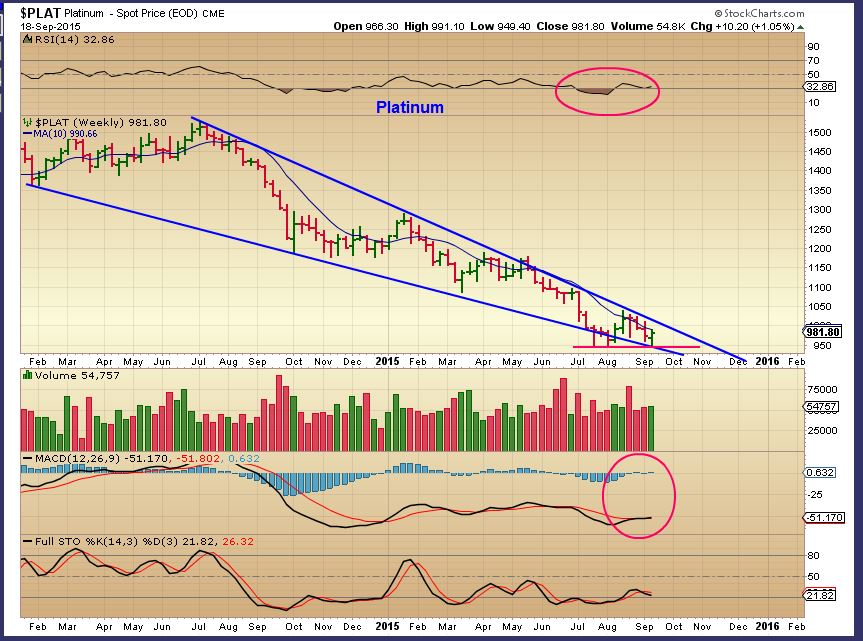
Since there were concerns about the overall end of the week last week in the CRB, I decided to also look at Platinum along with GOLD,SILVER, and MINERS.
Platinum Wkly – I actually like the way this looks.
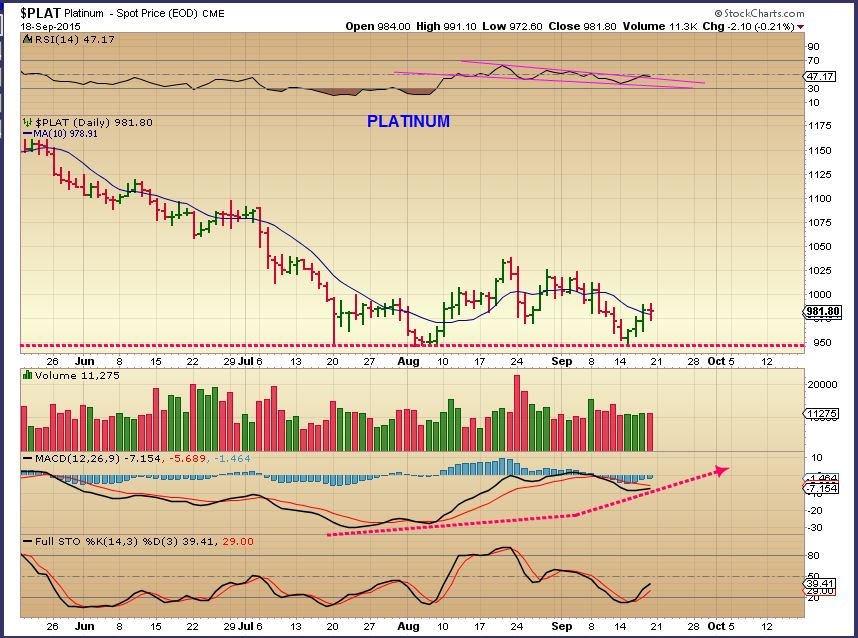
Platinum Daily – This chart also looks like a bottoming chart with good divergence so far.
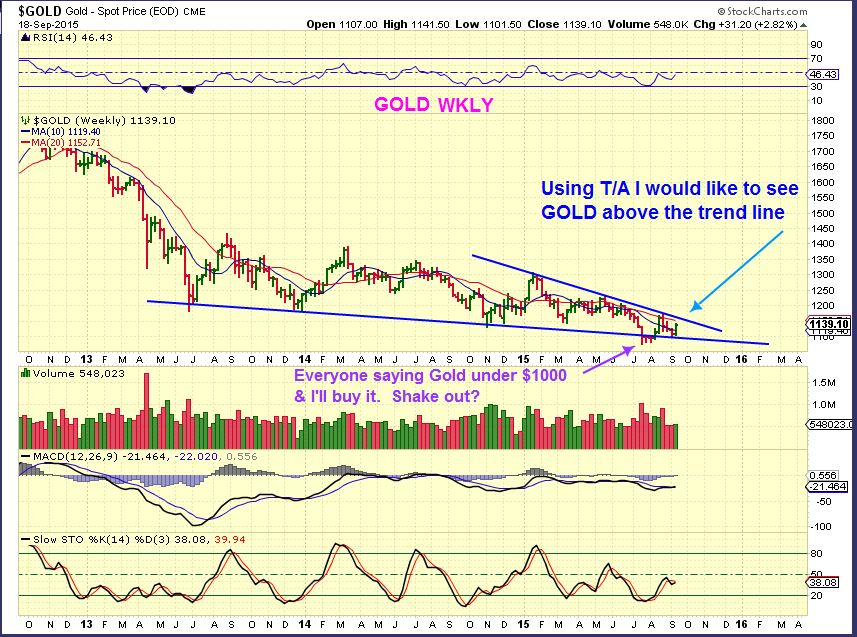
GOLD WKLY – long term & Close up
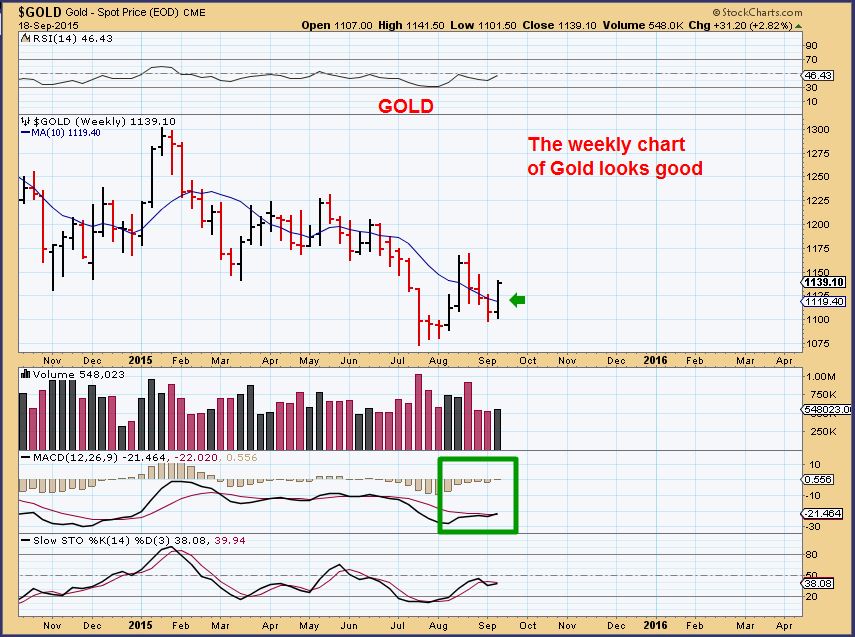
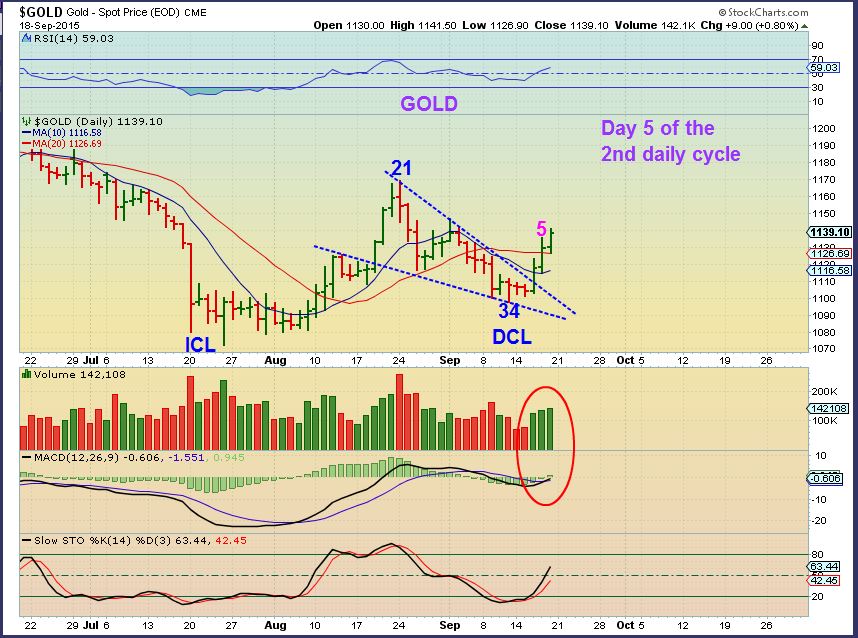
GOLD Sept 18 – We should be on day 5 of the 2nd daily cycle. The first was right Translated, which means that this one should break above the first daily cycles highs neat $1170.
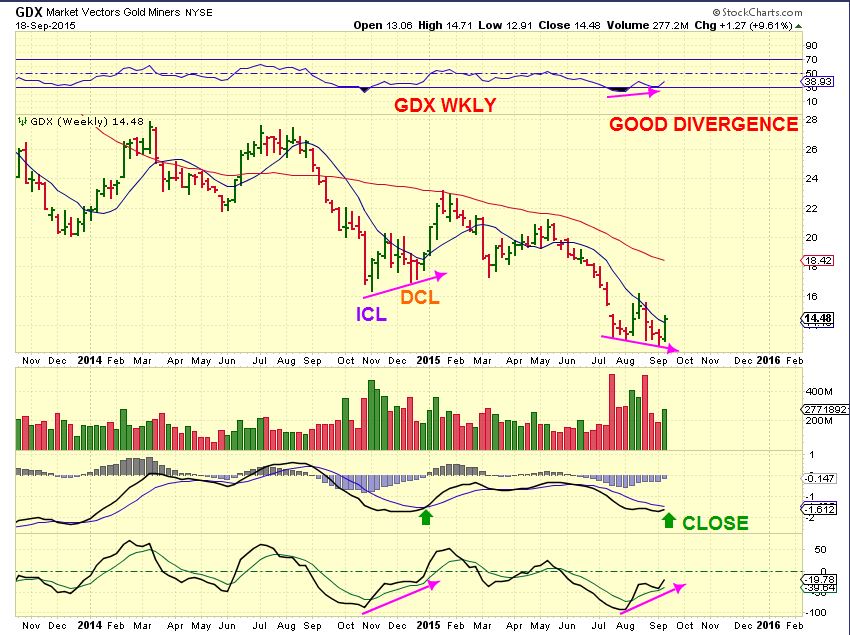
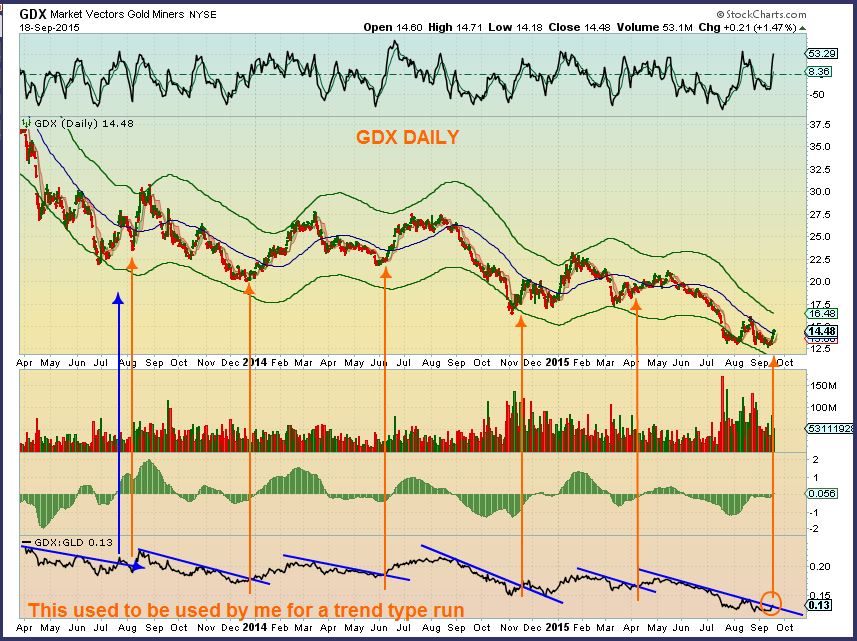
GDX WKLY
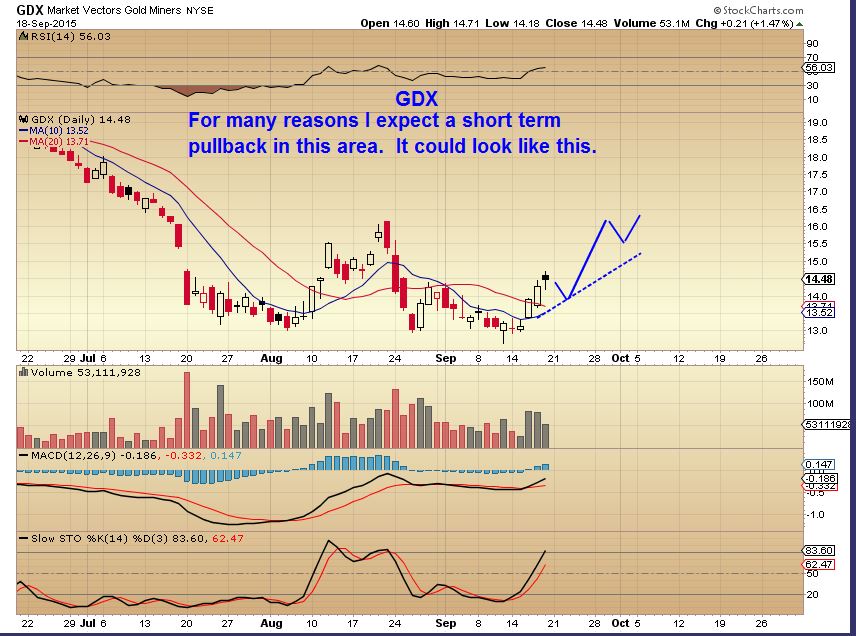
GDX Daily – We already knew to buy a swing, especially above the daily 10 sma. I expect higher prices, but we can always get a 1-2-3-4-5 type move or a pullback to the 10 sma, etc.
GDX – If we get a pullback to the 10sma, I would actually like to see if be a mild one riding above the 50sma. This would show strength I.M.H.O.
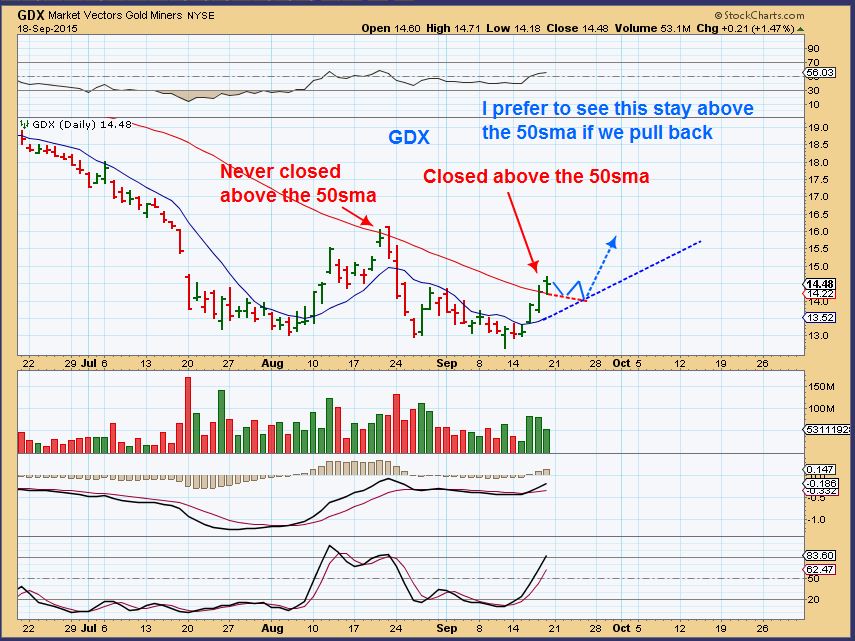
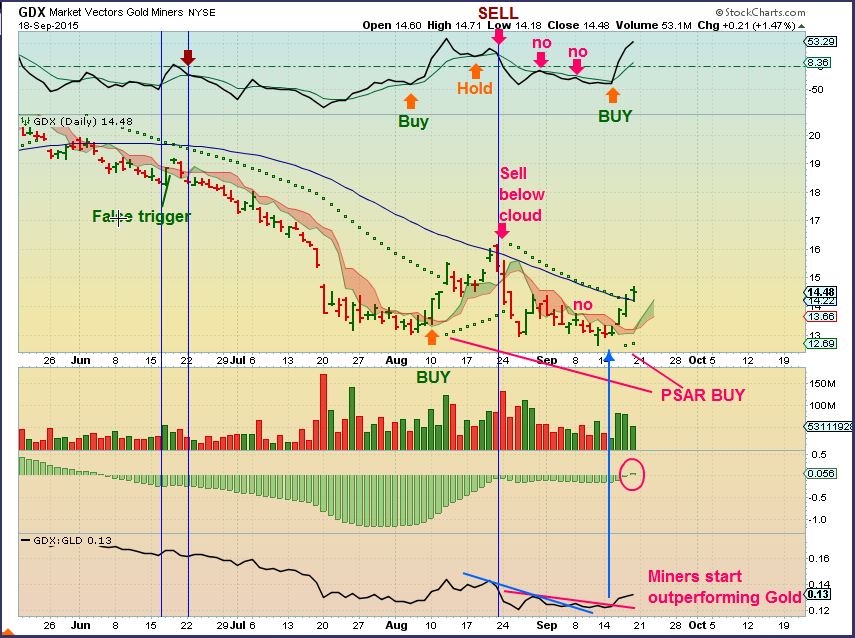
GDX – I just wanted to note that GDX is on a buy signal in several ways on this chart.
And this one with special PSAR settings, HIST settings, ICHI cloud, and above the 50sma .
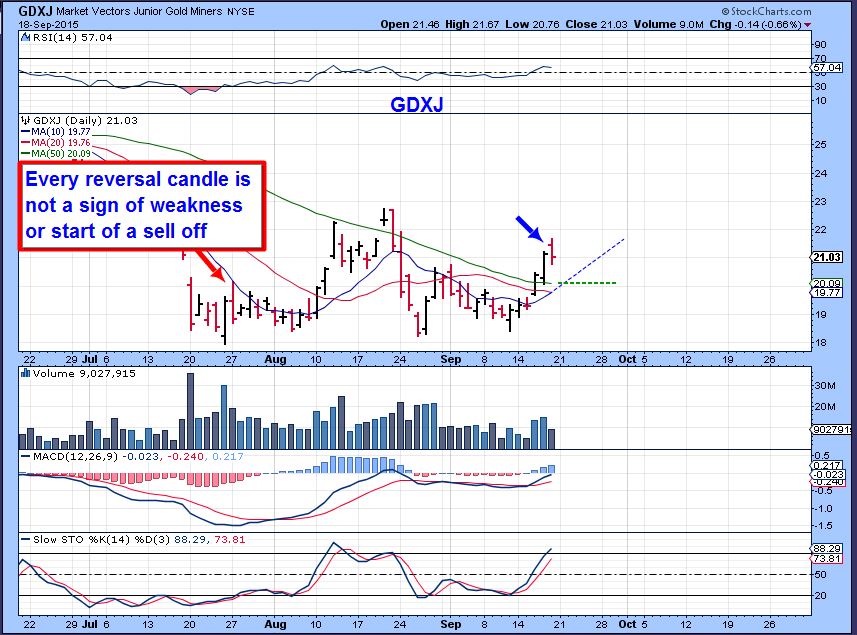
GDXJ – Juniors had a reversal Friday. That happens, I’m not concerned at this point.
SO we see the equity markets reacting at resistance and turning down. I have said that I expected a test of both the break down & a test of the lows, so we may be seeing that now. The Vix looks like it wants to break higher and that would drop the markets, I expect more downside in the equity markets.
OIL could be back testing its recent break from a flag pattern, it needs to hold that area on a closing basis. The CRB was a bit uglier, that needs watching , so I would be cautious with that area. Precious Metals are acting correctly and the Miners have had about 5 days higher, starting before the FED MTG. After 5 days up, they could pause and pullback to the 10sma. They often do after the first push higher. We’ll have to watch it step by step and accept the up & down days as long as they stay within acceptable boundaries. I do expect higher prices with this set up. I hope that everyone had a nice restful weekend. Welcome back 🙂
~ALEX
Public Post: FED (FOMC) Random Thoughts #FOMC $SPY 
 Pulling Back
Scroll to top

thanks Alex! Can you give me your input on CDE crazy volume on Friday?
I got emails on CDE & AG volume. I also see it is SSRI, PAAS, and a few other silver stocks and basically I just said this ) I will copy/paste my email reply
I always see that type of volume surge in GDX / GDXJ at days end, but not often in
the individual stocks. I cant say for a certainty what it is ( Big
funds at the end of the day? End of the day pre-set orders to buy or
sell? Is the company buying back stock on a BUY-BACK basis , triggered
right at the end of the day?) . It would just be a guess on my part.
IF I look at the 5 minute or 15 minute charts of both, AG & SSRI looked like
heavy volume on the way up, but CDE looked like a huge dumping at the
end of the day, so one looked fine, but CDE & EXK looked like someone big
bailed out at the end of the day. It could just be a 1 time sell, for reasons unknown to me.
If anyone else wants to add their opinion or knowledge in this area it may be helpful
There were quite a few miners with larger than average volume on Fri. AGI, BTG, BVN, AUY, EGO, FNV (royalty co, not miner), GOLD, HL, GFI, just to name some. All of those I named were up on the day. So it’s hard to say. That can also often indicated a buying climax too so it’s hard to know until we see what the follow thru is.
It was quadruple witching day.
The newsreaders on CNBC said it was one of the top 2-3 volume surges they’ve seen.
How did I miss that? thx
Disclaimer: I’m not a trader (or at least not a good one)…but my take looking at the chart was that 4x the vol. didn’t move the spread out of the norm. Thinking that’s got to mean some one is on the other side propping it up (so I’m in). So not really interested in the reason why. Of course all this ‘high level’ thinking may explain why I’m not a good trader ;-). Oh well…back to the game.
I look at things similarly Deshy. If I see a high volume candle and minimum spread in price, I just mentally chalk it up to a non -event and look for the follow thru the next day for an indication of buying or selling continuation.
CDE bounced back nicely this morning.
i see it in ‘2’ of a 5 wave impulse.. woop… 😉
https://www.tradingview.com/x/LuXx5E10/
**obviously 2 can retrace 99% of 1 .. sooo – i cannot place the next leg until ‘2’ completes.. ;o)
Then how far will leg 3 go?
generally 1.618 of wave 1…
And wave 4?
see above chart… actually i SHOULD tell u to ‘google it’ like u did me….LOL
corrective waves:
2 – “generally .618 of wave 1 – (tho can retrace 99% and ive seen that often actually)…
4- ‘generally .382 of wave 3 – pretty solid here – usually complex triangle of sorts…
So for GLD, it should look like below?
woooo look at bill
dear billy
.. i will have to ‘check your homework after class
signed,
Teacher MissyElliott (wannabe)
ps. i do not see fibs across time here… so u start with A-
lol
I can see why you need 2 completed.
LOL- Watch her Bill…If you google the word Feisty when the moon is full, her avatar comes up.
lol…
exceptttt I was born in the sign of water ….
https://youtu.be/eFKPkKo6238
LOL! Ya, she already jabbed me for making her google something?
Great chart Bill but could you also please provide a detailed forecast of all the subwaves of wave 3 just so that I know exactly where to trade in and out of my positions!! Lol 🙂
LOL CHRIS!!!! ha ha ha
right..
please include entries, exits, and stops in your homework assignment
Can’t, until sub wave 2 completes! You should know this? Geeezzzz.
just for that.. … NEW ASSIGNMENT:
OIL – also a great example of a ‘complex’ correction – fyi
although..
WAVE 2 – is ‘generally steep and a simple deep correction’
IF MY COUNT IS CORRECT: oil appears to have switched things up and is painting a ‘complex’ correction so far..
Ive done MOST the work here… so the rest should be easy for you to finish….
oops…
next assignment:
Law of Alternation
oops forgot to post my oil chart – for you to finish…
https://www.tradingview.com/x/XxYMSzRb/
Doesn’t make any sense where you have “2”. Looks like 2 is a 50% retrace of one and now starting wave 3 to a much higher level. If my teachings are correct.
exactlly… now … google law of alternation
Damn you! OOps.
ps. you’re lucky I even allow google in my classroom… i require most students to drop their Mobile device in my box..on my desk
Hmmmm?
Bad spell checker!
here – scroll down to wave personalities… that’s pretty good explanation
https://en.wikipedia.org/wiki/Elliott_wave_principle
** oh annnd wave personalities…
Really?
Check attached.
Now that really is impressive!! 🙂 Almost as much so as your ‘harmonica’!! Lol
nothing beats that…
Praise doesn’t come much higher than that Bill!!! 🙂
;o) lol
Complex triangle=flagging 12345 mini?
Can you have a really extended wave 5 and a wave 3 that is equal to 1? See attached
Rule #1: 3 cannot be the shortest..
You see a different way?
In the chart example you have above of SPDR GOLD, looking at the bigger picture that move was a corrective moves within a larger downtrend, which means it wouldn’t be a 5 wave impulsive move it would be something like and ABC or one of 12 other possible correction patterns!! But it would not be a 1-2-3-4-5. But once again that’s based on what little I know!!
That’s my understanding also Bill but as long as wave 3 is longer than wave 1 you can have an extended wave 5 and I believe that with commodities wave 5 tends to be the longest and strongest rather then the more usual wave 3. That’s if I remember things correctly!! Definiyley no guarantee of that!! Lol
annd .. when u overlap that with Fibs across time.. = pretty darn close projection..
Oct. is a big month for gold in India,, They give it to there honey,, And we know women.!!!!
Yes, India has a traditional wedding season with Gold being the main gift, but it is tough to rely on that idea as a buy signal for Gold without much disappointment. 2013 and 2014 Oct moves were rather muted ( About what we see in Sept so far), plus you would imagine that the buying is currently happening or possibly has occurred already.
Maybe they want to buy extra while its on sale down here 🙂
ohhhhh do we now frankie……… ;o)
How do I know you would answer ..!!!!
giggle…
*i was gonna ask u if u cared to expand upon that… ha ha ha
Alex, thanks for your frequent postings of CRB chart, and comments thereon. Commodities outside of PM’s in possible trend shift but with the usual trials, volatility of a bottoming process-as your day’s post suggests, which requires close monitor for potential long term trades.
Hi Rube,
I’ve been watching VALE, MTDR, FCX, MDR, X, AKS , NOR, CENX, AA, etc and started to see a bit of weakness, so I felt that the CRB needed attention. Glad it helped (And X turned into a loser pretty quickly after I mentioned it a while back).
Alex.. technical question for you.
When assessing validity of a swing low, does it matter which order the higher highs & higher lows come?
eg, as in diagram below…
am thinking that in the latter case, any pullback looks like it would make the swing ‘safer’
… so that essentially it is the same as the first case
I apologize in advance, I am not sure that I am understanding the question, but I’ll reply with a basic summary of a swing.
The lowest candle is your low, and to get a swing, you need another candle to go higher than that candle that made the low. If its a HUGE drop, it can take days to get back above it, so its tricky if that happens. What I do is I use various points to look for confirmation of that low and move higher to be a real swing.
If it goes above the 10sma, that’s further confirmation. Then when an overhead down trend line is broken, that is pretty much confirmation. As most here know, I try to just look at the timing ( day 30?? Day 31 for Gold or Miners?) and I may buy the swing before the confirmation, because it can start to stall at day 4 or 5 and if you’re buying up there, your stop is riskier.
Did that make sense? Refresh
yes thx A.. that makes sense as far as the swing low is concerned.
its just when ppl go on about a trend requiring a HL and a HH, that it gets a bit confusing
Lately when I hear people talking about the need for Higher Lows and Higher highs to confirm a bottom, they are discussing THE BOTTOM OF THE GOLD MARKET. like, “Is the Bottom in?”
When I look at recent cycles, you can get higher lows in the first daily cycle and then the 2nd too, but eventually they all roll over and we go back to the bottom in the 3rd & 4th daily cycle. No higher high breaking out above the last entire cycle. So for a trend, you may be hearing people talk about a confirmed Bottom in the gold market itself being higher lows and higher highs continuing in a 3rd daily cycle & maybe even a 4th – like for a few months rather than a few weeks.
Yes, the above makes sense – thanks for sharing the expanded lesson with all of us.
Ok, I re-read this. No, a swing low can come on the next day after the low or 5 days later, it depends on when the candle of THE LOW is overtaken. And after that it can fail or confirm, and confirmation is follow through, above the 10sma, trend line break, as mentioned in my first answer below. I was hurrying & didnt understand the question at first 🙂
thx A..
i’m likely combining 2 separate issues here.
A) the low L & the overtaking swing low H
and..
B) the subsequent trend arising thereafter, ie the HL and the HH
Sometimes after the low candle is overtaken, there is no pullback to a HL… it just keeps on trending up.
I was wondering what do you count as a valid HL for establishing a trend in these cases?
…does an inside candle count (as in my second diagram)?
The higher low in those cases ( to me) is that there will be a dip eventually. May – July 2014 was a pretty good move almost straight up, but eventually a sideways move or dip will come.
yes.. thats what i was getting at in my 4th diagram 🙂 …kindof
so really its a matter of timescales…
as you say in the other reply, the 3rd/4th daily cycles may drop right back down, but still give the HL on the greater weekly/monthly scale, to establish the bottom/ longer term (bull) trend .
Yes, and wouldn’t that be nice for a change! 🙂
That would be awesome!
greetings from the catcave:
any of you cool cats have a little somethin somethin like this for muxie girl … long term swing opportunity.. ??
wooo weee
https://www.tradingview.com/x/mdG9QGIA/
I hope you’re right. I have these as a long term investment holding! 🙂
AAAAHHHHHHHHHHHHHHHHHHH…No, nothing like that , thanks for asking though 🙂
lol…what does principal chartfreak have…
I was kidding, I have,,,,,,nuthin’
what you guys think of this one?
copper mine, was £30.00 in 2011, now at £0.20
a friend bought into this at £2.50 back in 2013… so far he’s down 92% (down by tens of £1000s).
but its looking like a bottom now
That chart of EGI looks so good on a weekly basis ( Say 4 yr wkly)
Bought a small position at .32 in EGI last week for my “one day I will travel to Europe account”. Will hold it for a few years if it behaves. Thanks for featuring it in your report.
I really like the long term prospects on it.
I pointed out the WEDGE PATTERNS that break higher quickly recently too. Maybe I will re address that in tonight’s report, but it included TC and TGD weekly wedge patterns.
I was watching TGD last week and thinking ( HUGE VOLUME) that it was a shake out . Today it seems to be acting very well.
CHECK OUT IBB and BIS . Big reversal.
I was actually looking at some bio tech stocks that looked excellent this weekend and was going to do a write up ( I did mention ZIOP and IDRA a few days ago). Also liked LAKE, ADXS, MDGN, TROV, INFI, LAKE QGEN, Supposedly Hilary Clinton Tweeted some negative news about regulations needed for price gouging and things turned down fast.
See Also BIIB , SBIO, LABU ( LAKE, INFI, and a few still look good).
Sorry Alex…. ‘big reversal’ now after it’s down, or do you mean it will go further down?
Thanks-you.
Neither.
IBB was up this morning.
Big reversal is what you are seeing now, it was up ( green) , reversed to down pretty big
Wow, helping drag the entire NAZ down well below it’s peer indexes.
SAND is **still gettn it done….
-BOX
Kidding.
GPL ( use a 50sma) did quite a trick today. I liked that .
hmm.. i like tricks
IEGO
-storm
.. wich .. as in ‘make me one im hungry’
lol.. i just saw this
whats the story with NG alex- Any chance of survival? I have some Natural Gas related stocks which i am thinking of giving up,TIA.
Survival….maybe. It looks like it’s forming a ginat base on a 2 yr chart. At this point it was rejected at the 50sma on a daily chart and may be dropping down for a double bottom.
XCO is a NATGAS stock that I used to trade, and for some reason it looks to have bottomed already.
what (price)could be a possible double bottom on NG? My position is fairly small but very frustrating action lately on NG 🙁
It had double bottom lows at $2.48
Disappointing isn’t it? It popped up over 2.7 on a bullish storage report a couple reports ago and has not been just dying ever since.
Right Cason..very tricky trade NG is..
Fundamentals should be interesting this time of year also. What NG needs, basically, is a short fall – want temps to go from pretty high to pretty cold fairly quickly resulting in a short fall injection season. While injections were below consensus (so higher usage) last couple of weeks, we are well above the 5 yr average. Hopefully, in a few more weeks we’ll be close to the initial winter surge at a time while overall rigs are continuing to drop. Usage has been high, but so has production – much the same issue that crude has been fighting.
Man, sure am glad that I decided to get out of JNUG on Friday. Anyone else think this might be a good area to start another position?
The EFTs were smacked around pretty good but most of the ind. juniors I had on my watchlist were only down pretty mildly. I’m also showing pretty low volume on GDX/J today. Still both above the 10/20 daily SMA but might be good chance to scale in with 1/3 to 1/2 position – am positioned if 2nd DCL is ready to blast off or can add rest of position if we come settle down on the 10/20 area (they are pretty close to one another currently.
For what it’s worth Cason, I’ve just had a quick look at JNUG, GDX/J on my 1 hour charts and in each of them it does look like we had a nive impulsive 5 wave move up into the highs on 18 Sep. That would strongly suggest that once this minor correction is over there should be at least one more impulsive leg to the upside. It does look like the correction has a little further to go…not a lot but just looks like there is a little more work to do on the downside in the very short term. I’m thinking around 8.40 JNUG, 13.8 GDX and 20.1 GDXJ would look ideal from a technical perspective but I personally would want to see some evidence of support developing there before commiting capital. But just my personal view.
Chris, so you’re looking at a 50% retrace on JNUG for wave 2?
Funnily enough Bill I’d been looking at some short term ema’s I use on my 1 hour chart and also the area of the minor 4th wave low of the first impulse wave up. That is a classic target area for corrections of an impulse wave. But as you have spotted it is also the 50% retracement level of the first leg up, which makes it an even more attractive target area now!
Chris, thanks for sharing. I definitely knew there was a decent chance for more downside, which is why I only selected a 1/3 position with the opportunity to add more this week if we drop, but wouldn’t miss entirely if it starts to turn around tomorrow. If we get those targets, I’ll add; break below and will likely stop out of the whole thing.
Based on what Alex has above, we should be ready for a solid move up in the 2nd daily cycle, also liked where GLD dropped back to support and held, esp. on a strong dollar day. Also starting to scale in GLD here in case we can get back up to 1170.
Yes, definitely looking for another leg up even if it is only part of yet one more ‘bear rally’ in a still larger downtrend as all the recent ICL’s have been. For various reasons I believe we are coming into a potentially ‘sticky period’ for gold/silver in the very short term but I’m hoping it will just be a bit more consolidation/very minor pullbacks before heading higher again into later October.
Solid day for oil today, thank goodness. Would really like to see two in a row for once. I didn’t like the slow afternoon sell down in the small cap energy names, but could have just been noise.
Another interesting thing, spot VIX (and related volatility products really took a tumble considering SPY and (especially) NAZ had a fairly mild day. Def keeping an eye out on that for if we roll over now and really try to check back all the way to 200 day.
Alex (or anyone), Any thoughts on the “normal” volume in GDX/J at the end of day? It seems lately almost 40-50% of days volume is being inserted in last 10-15min with no significant price move. Just wondering if this is usual for these assets–other ETFs don’t seem to follow a similar pattern.Thx!!