FED- EX (pectations)
I’m sorry if you came here hoping to hear an opinion on the FED EX company. I am actually here to point out that I am expecting some strong movements later this week as a result of the FED EXPECTATIONS. Some are expecting an interest rate hike and others are expecting no change. So far we are seeing a sideways move in most markets leading up to that big day this Thursday. I wanted to share some charts that were in my recent weekend report. They may help us to anticipate the reaction after Thursday. Lets look at charts.
.
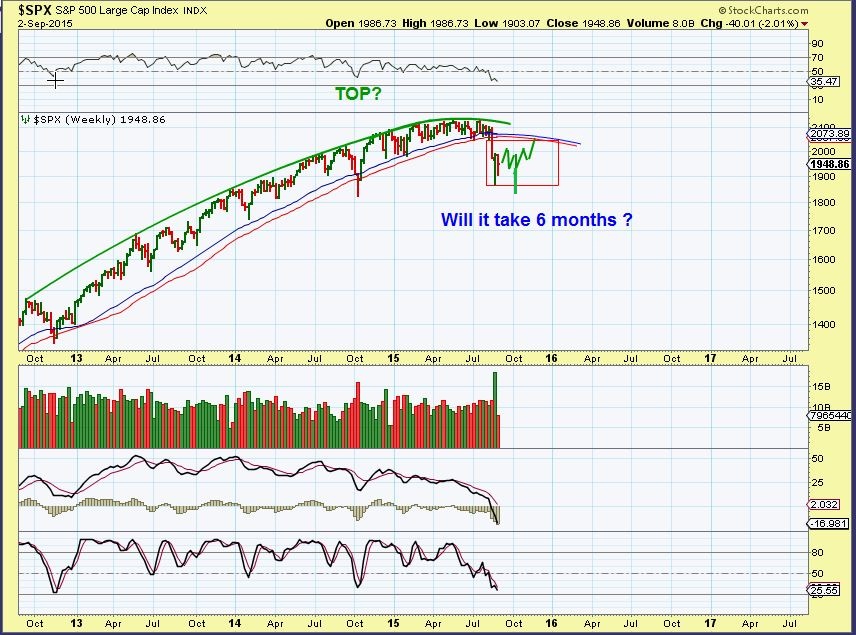
SEPT 2 – I pointed out the topping action in the markets last Spring & early Summer. After the initial drop, it should likely lead us to expect volatility, possibly even sideways for a long period of time. We have that now.
I want to point out what I am looking for next…
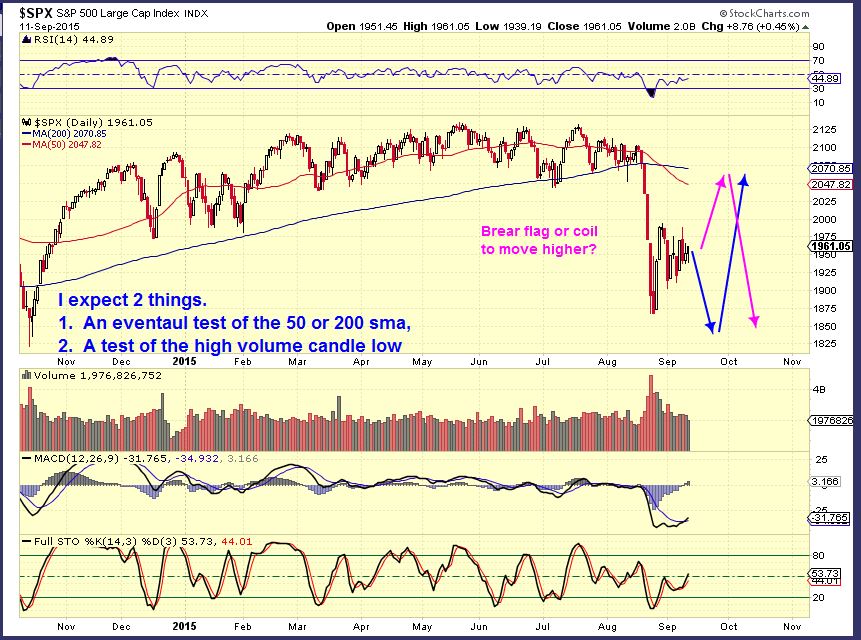
I have been saying that I expect a back test of the break down above ( 50 or 200 sma). I also expect a test of the high volume candle low from the recent drop. The question is, which one will come first? A test higher and then a drop? Or a drop to lows, and then a test of highs? We may only know after The FED EX delivers its package. I tend to think we drop ( Blue line) since the triangle acts like a bear flag, unless the FED juices this market.
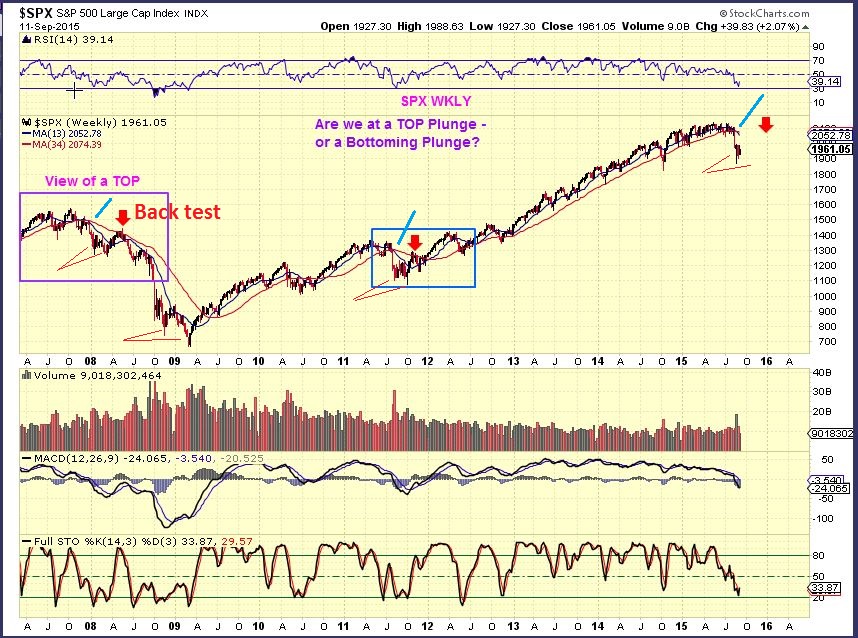
SPX – Sept 11
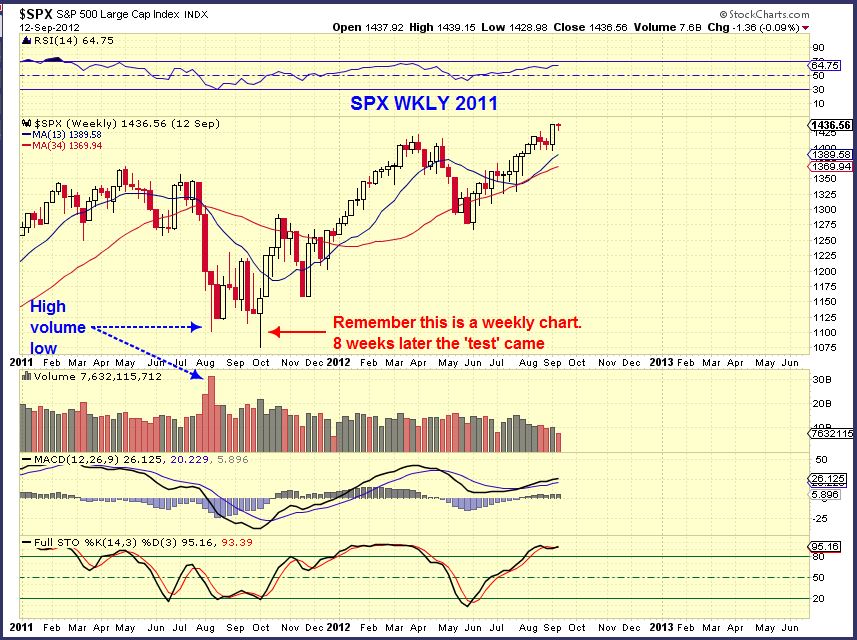
Look at this volatility in 2011. Below is the WEEKLY chart from 2011. You see –
1. A sideways move for weeks after the initial drop
2. Then a test of the High Volume Lows 8 weeks later ( Stop run style & reversal)
3. A run higher through October
This type of volatility can be quite difficult to trade and raises questions. Are we forming a Top or a Bottom here?
As mentioned in more detail in last weekends report, I am thinking we are seeing something similar to the 2008 top view shown on the left. It did a double bottom, ran up to test the 34 sma , and down it went.
For now I expect volatility, recommend a little caution, and things will become clearer post Fed.
————–
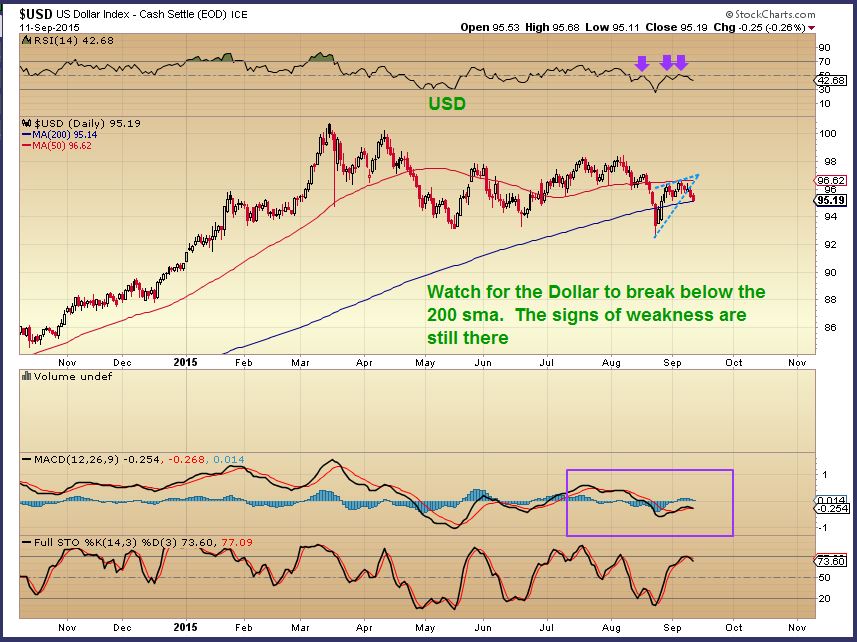
USD – I have been saying for weeks (& months) that the dollar has inner signs of weakness and I still see that. The dollar can still run to 96.62 area, but I am thinking that the Dollar is going to roll over and Commodities will rise soon.
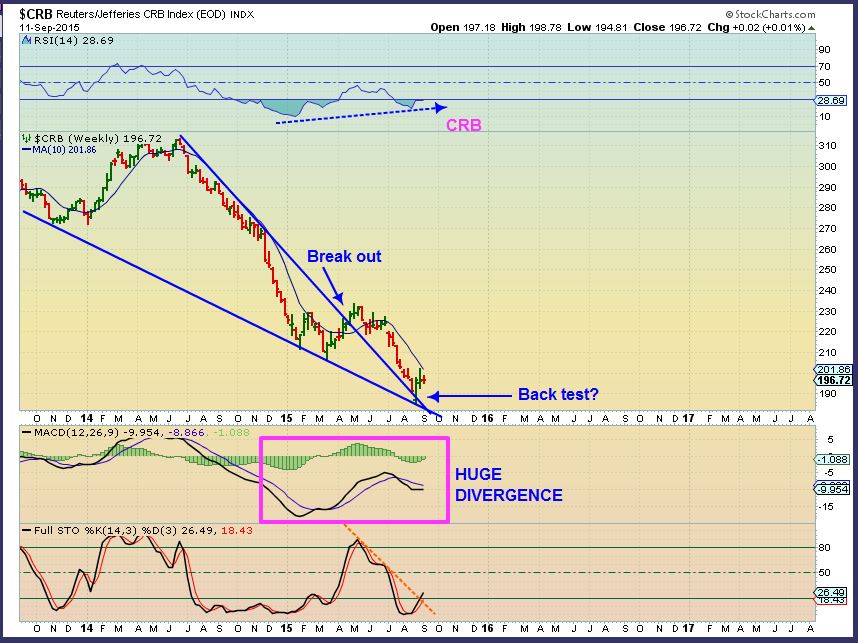
CRB WKLY– This looks very bullish to me. Commodities higher and markets lower for a change?
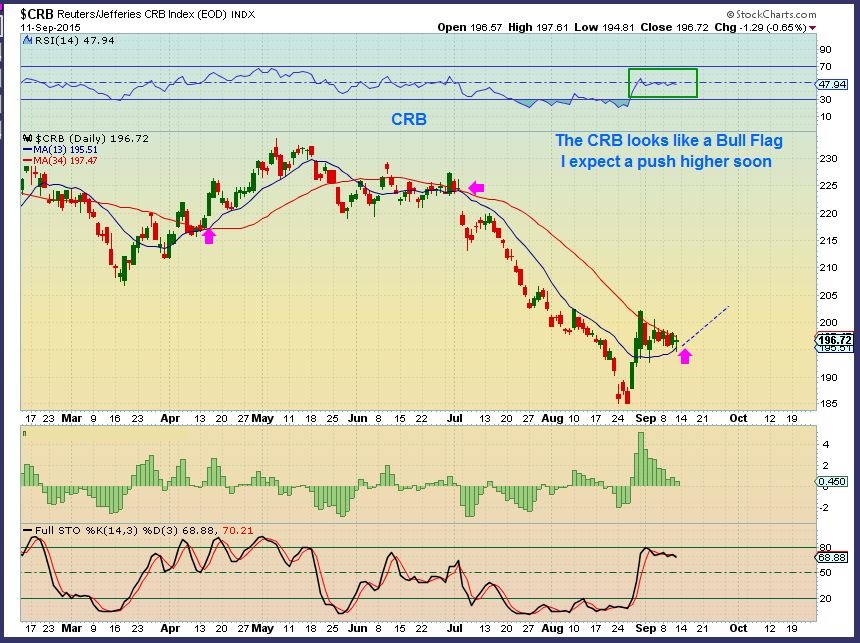
CRB DAILY – Bull Flag? Waiting on FED EX?
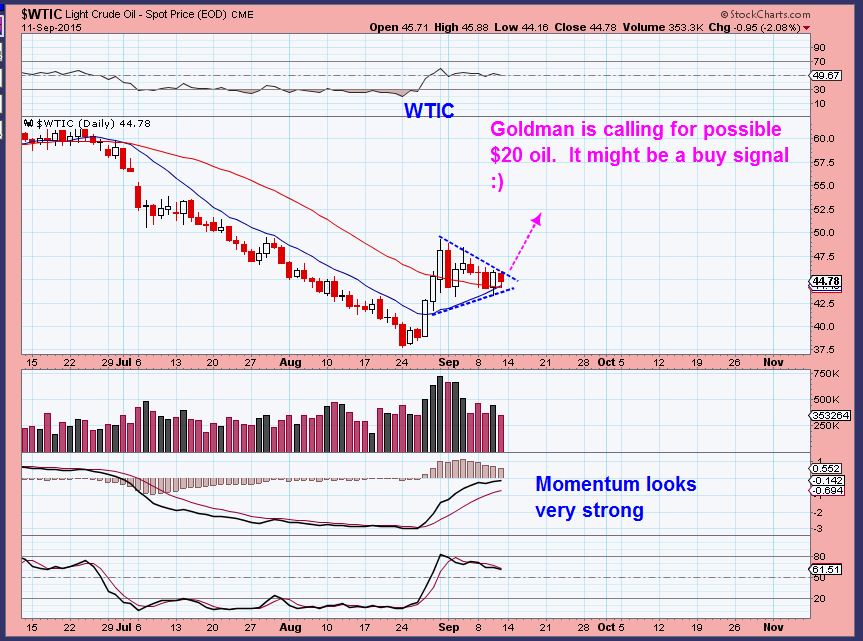
WTIC – Goldman Sachs called possible $20 oil. Oil dropped $1 , but it is not a chart breaker. Lets look at USO.
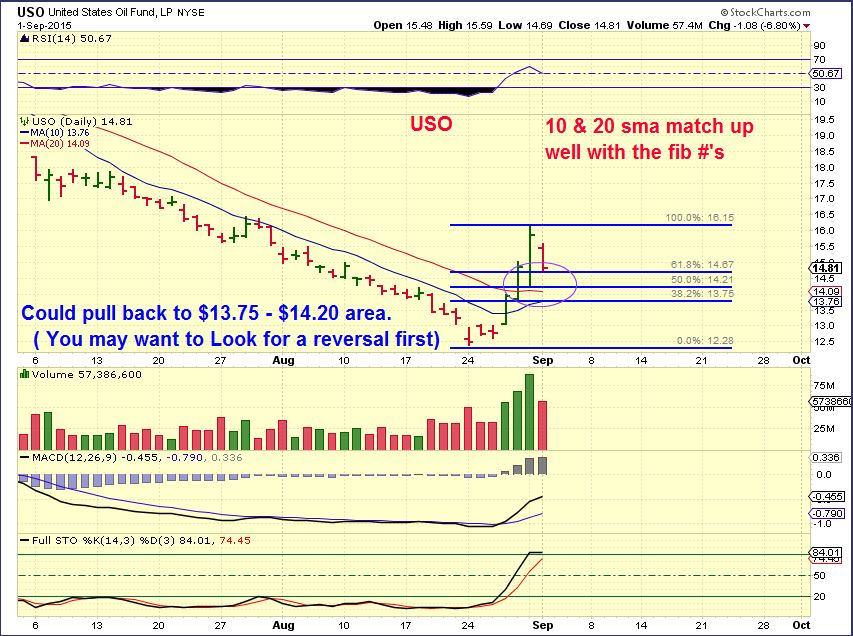
On Sept 1 – I used this chart to point out that we could get a pullback to Fib #‘s for 50% to 61.8%.
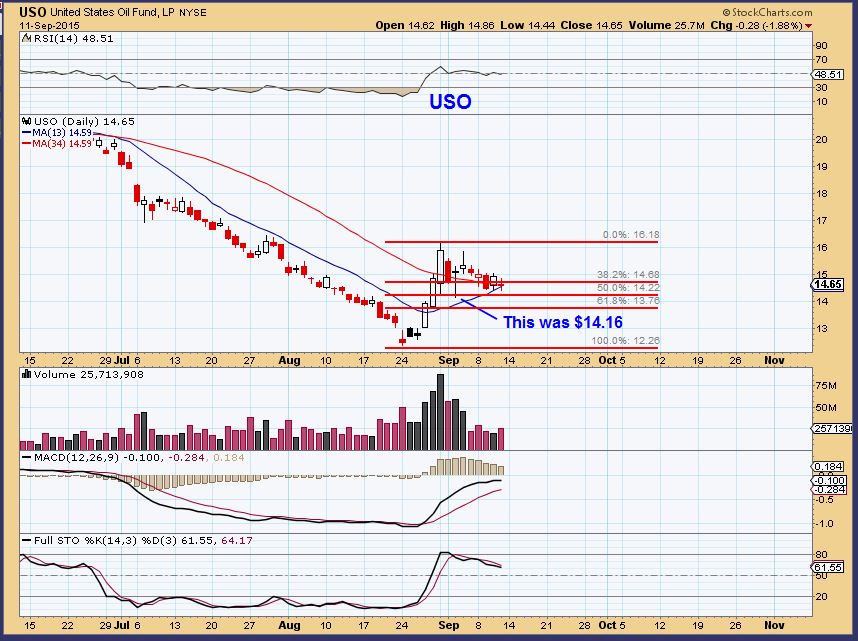
SO far $14.16 held up. Fridays drop was normal. Use the 20sma and you can buy with a stop below the 20sma, but it may also be waiting on the Fed ?
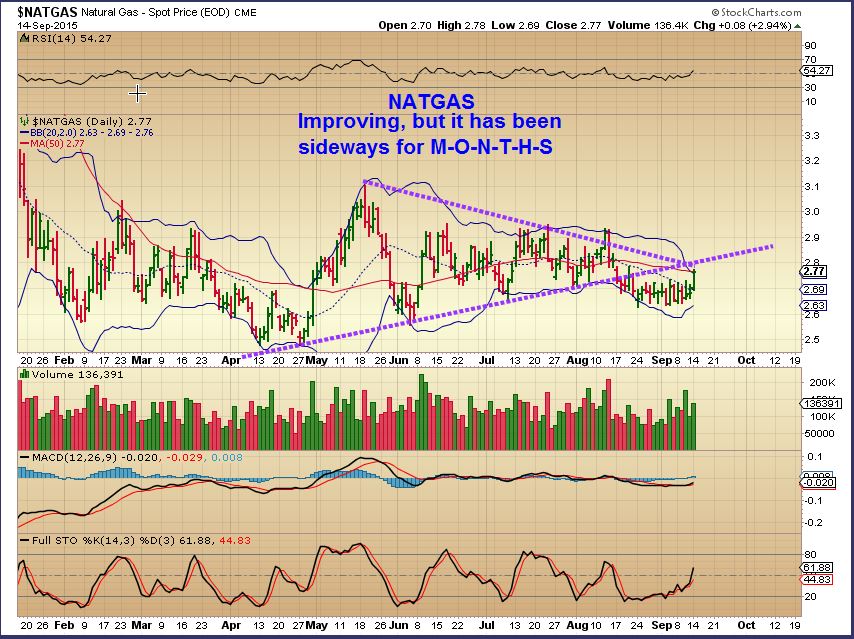
NATGAS– Ready to break out or just a back test? I am watching for a break/ Close above the $2.80 area for confidence in higher prices.
GOLD, SILVER, & MINERS – Keep in mind the FED release Thursday
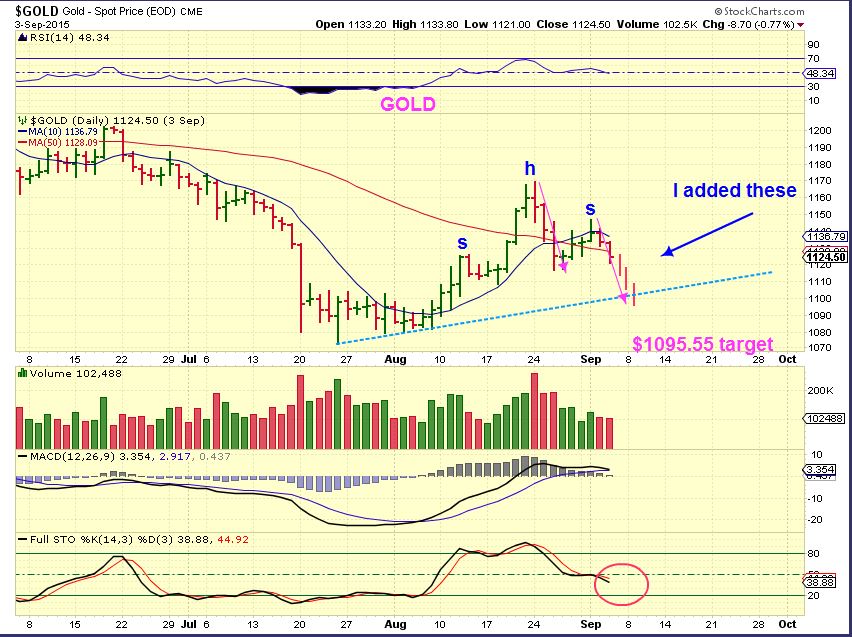
GOLD– On Sept 3, I did point to $1110, $1100 & $1095 target areas with a few charts, this being one of them when Gold was at $1124.50.
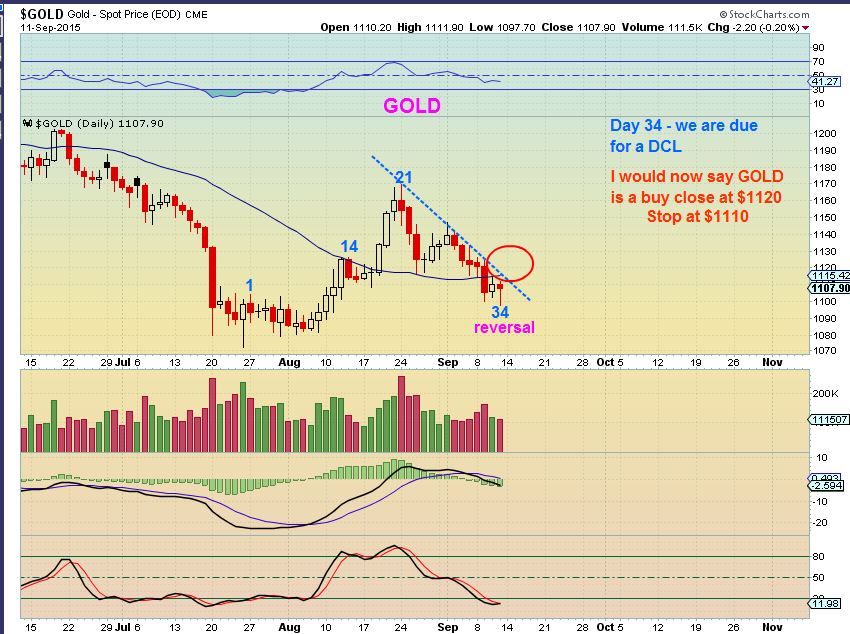
GOLD as of Friday Sept 11 – $1097 lows and a reversal candle so far. We’ve been expecting a daily cycle low. I’m pointing out what could be considered a safer entry, since Gold was on Day 34 Friday and is due for it’s Daily Cycle low. **I will add thoughts about buying on Fed Mtg Wk at the end of the report.
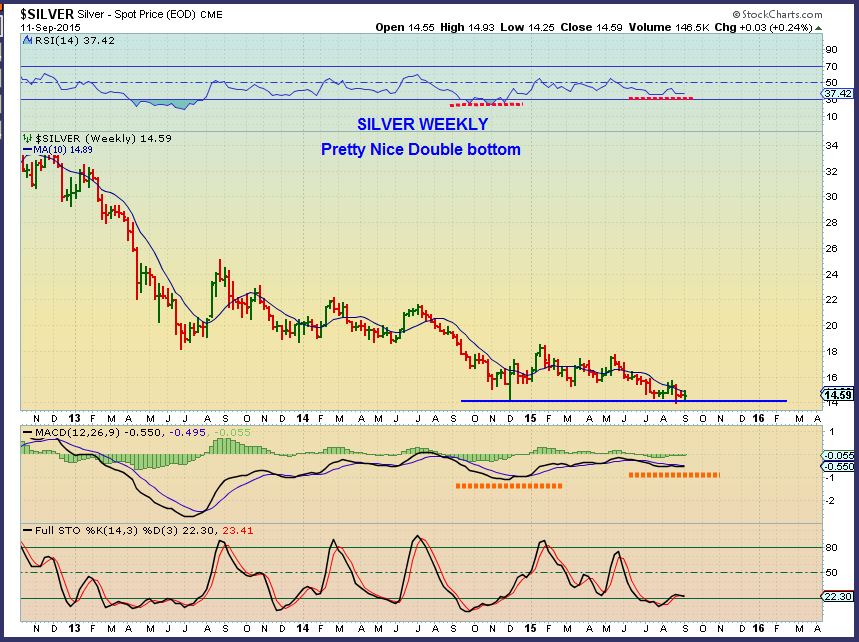
SILVER – Weekly chart looks like a possible double bottom with divergence.
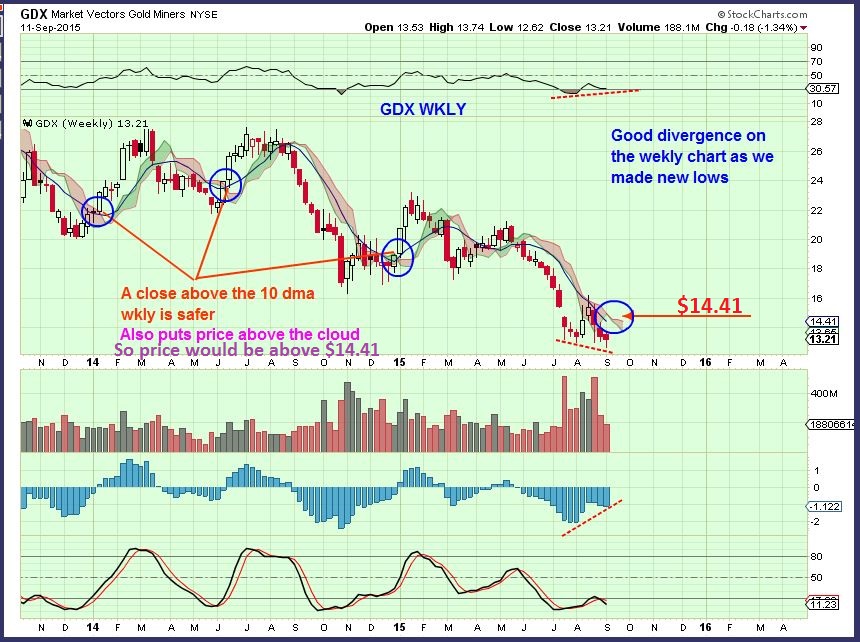
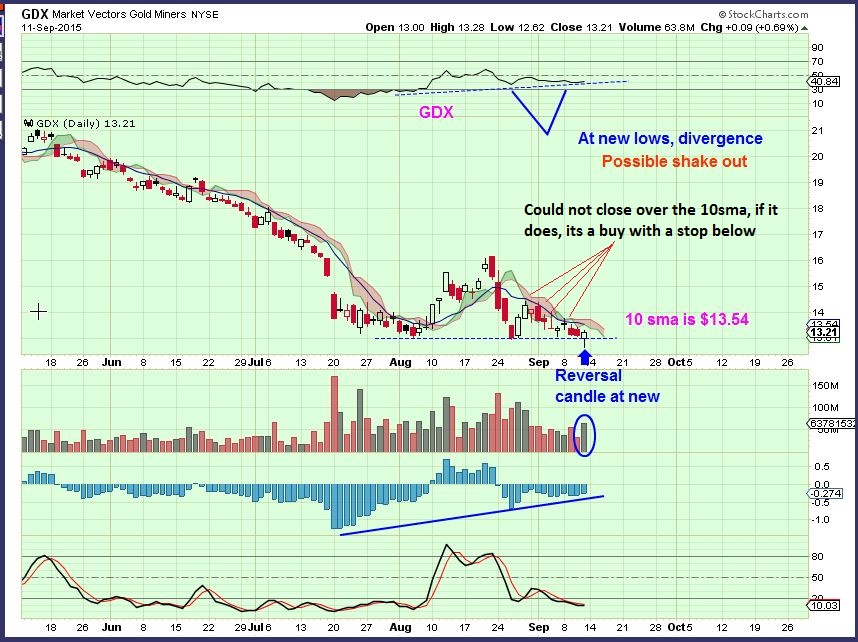
GDX WKLY– GDX broke to new lows again, but there was a weekly reversal with divergence and that is usually bullish. For a buy on the weekly – you want a close above $14.41 and you’d place a stop a little below the 10MA on a wkly basis. That is a bit safer and is higher than the Buy on a daily as seen below. ( Keep in mind the Fed Thursday).
GDX DAILY- Nice reversal ( shake out) Friday. A break above the 10sma has not happened since Aug. We may get one this week above $13.54. It is a buy, but use a stop below that 10sma. ** Again, we will discus caution in FED WK buying later in this report.
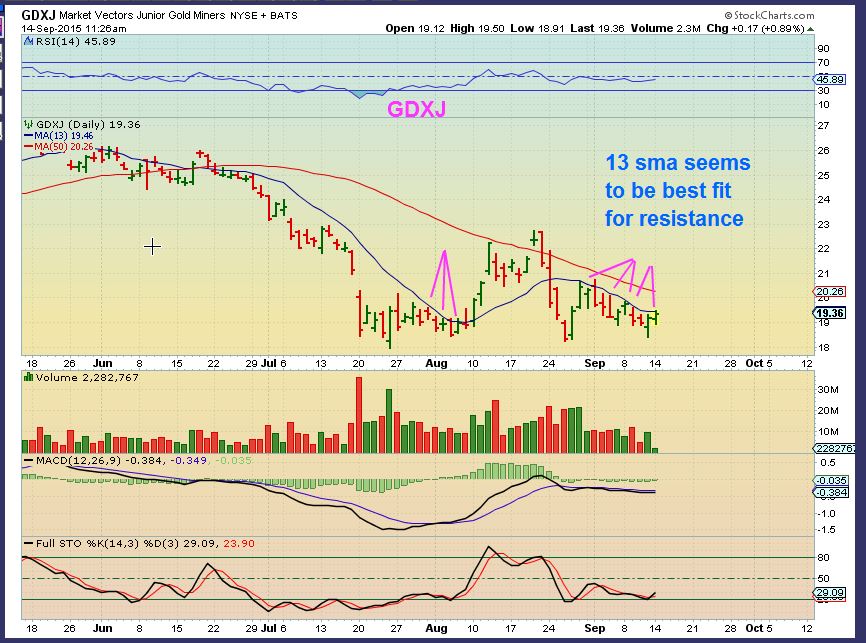
GDXJ – The juniors are actually performing better. While GDX broke to new lows 2 x recently, GDXJ did not. I use the 13 sma for GDXJ.
We are seeing signs of bullish set ups in the CRB, WTIC, Gold, Silver, and Miners now, but there are questions. Will they play out after the Fed Decision is released, or will that put a cap on things? Will the dollars recent weakness continue, or will it surge higher after the Fed decision is released? I actually think that the charts are giving us clues. For now, I believe this weeks trading may be slow & rather sideways until the FED releases the KRAKEN!
.
( I went on to discuss the importance of position size, Leverage, Whether to hold positions into the fed Mtg or not, etc in the weekend report, along with a few interesting charts of some Miners).
.
If you enjoy the analysis that you see in this report, why not sign up for the premium reports & give it a try for a month? The cost is a little over $37/ month. I have a lengthy weekend report usually containing over 25+ charts for Monday. I also do a daily report Tuesday, Wednesday, Thursday, and sometimes Friday if necessary. If you cannot sign up at this time, you can still sign up for our free email alert to allow you to be alerted anytime I post a new public report in this area. Follow us on Twitter and alerts are tweeted there too. Thanks for being here and checking out Chartfreak. 🙂

