
Shopping
When the markets are volatile and choppy, it can be difficult to buy and hold a position for anything more than a day or two. We have had some very choppy markets lately. The good news is that the current set up that I am seeing in the markets currently may provide an opportunity to ‘SHOP’ with a little less “CHOP”.
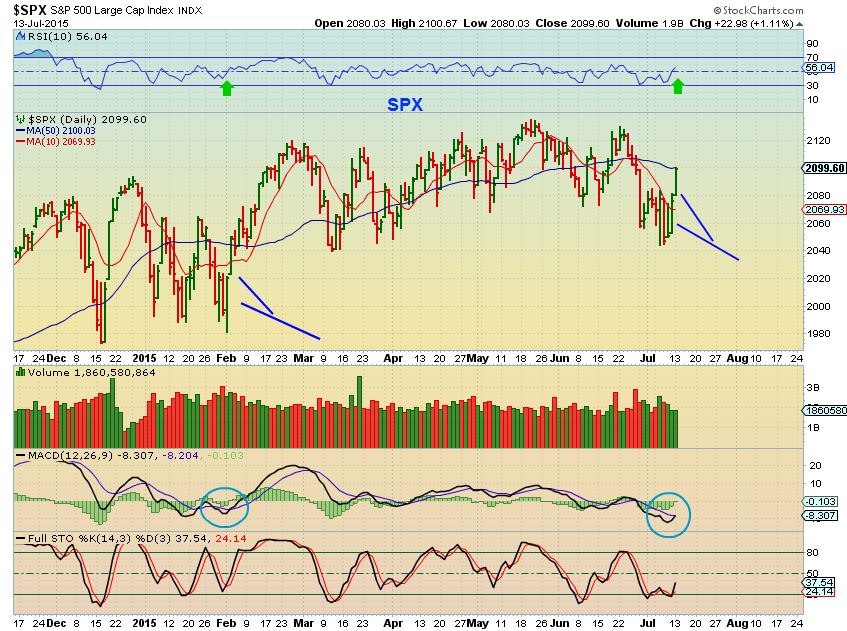
SPX – The blue lines point to the type of run I think we will see. We may have a pause or two, but I expect higher prices.
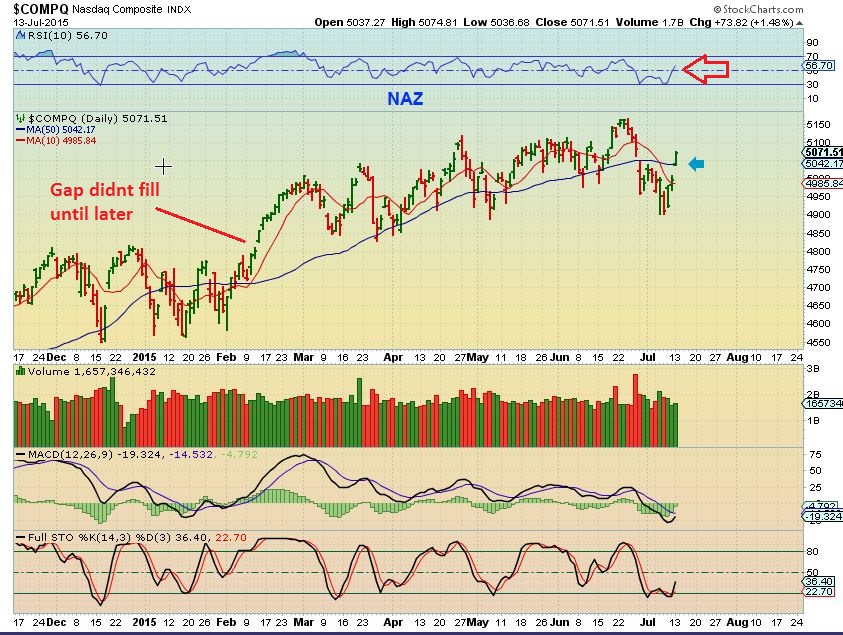
NASDAQ – We gapped over the 50sma. That gap doesnt have to fill right now.
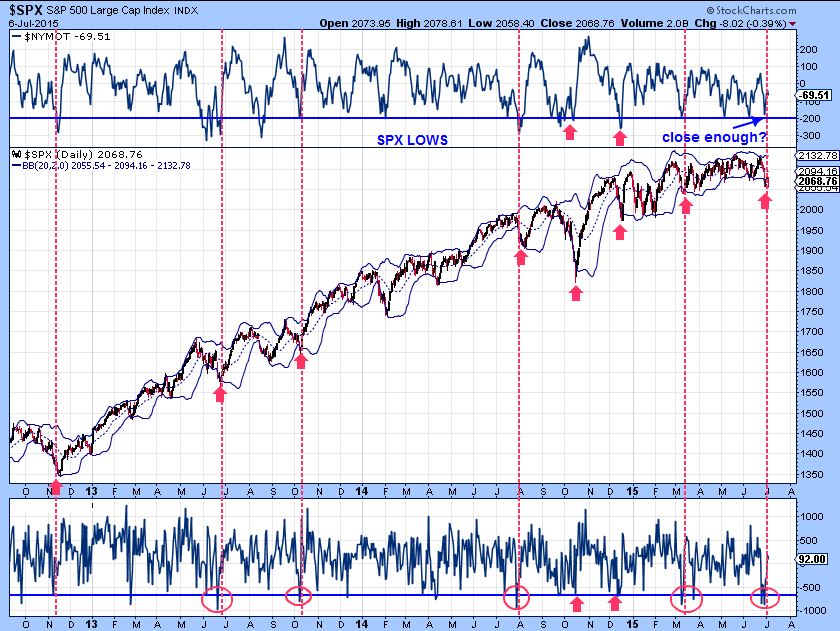
Summary: The Pop & Chop volatile markets consolidated gains from the prior run up, and made people nervous. Add Greece and China concerns and other news warnings and you had bearish sentiment increase. THAT is how bull moves start, with a lot of worry. I think we have an ICL in place. Sentiment became very bearish ( recall that I posted the charts with the CPCE #’s etc). Those bearish extremes in sentiment have caused many to go short and now we are seeing a need for shorts to cover. I think we will have a run higher continue for a while. Below is 1 of 4 charts that I used to show extremes in pessimism ( Bullish, because the crowd is emotional and often wrong). I said that I thought a meaningful low was coming. I now believe that it is here. TQQQ , UPRO, etc. or buying your favorite stock set ups can be used to trade the market back to the highs.
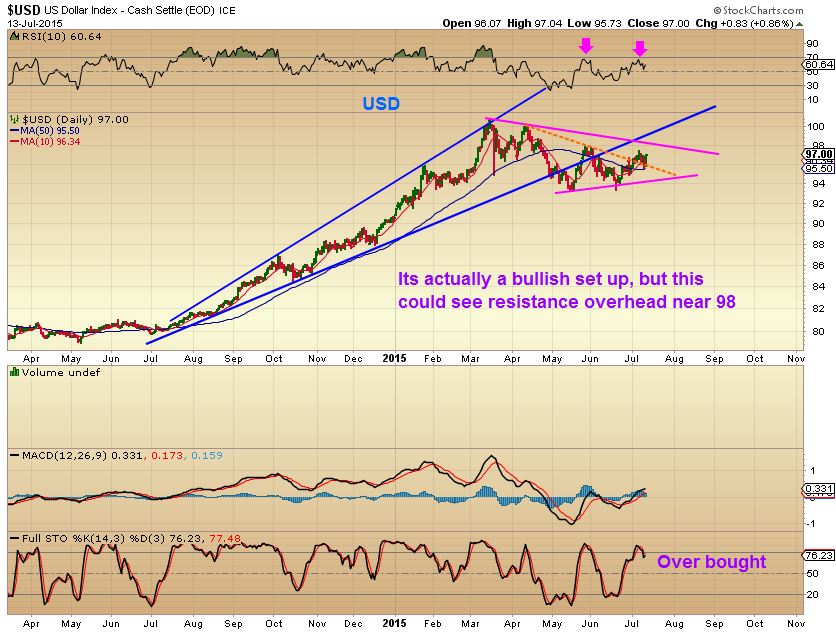
The USD is a bullish set up, but it could slow down here. It is overbought and turned down. In the weekend report I pointed out the 97 – 98area on a wkly chart.
I look at UUP – So far (this can change) volume buying was light. At resistance.
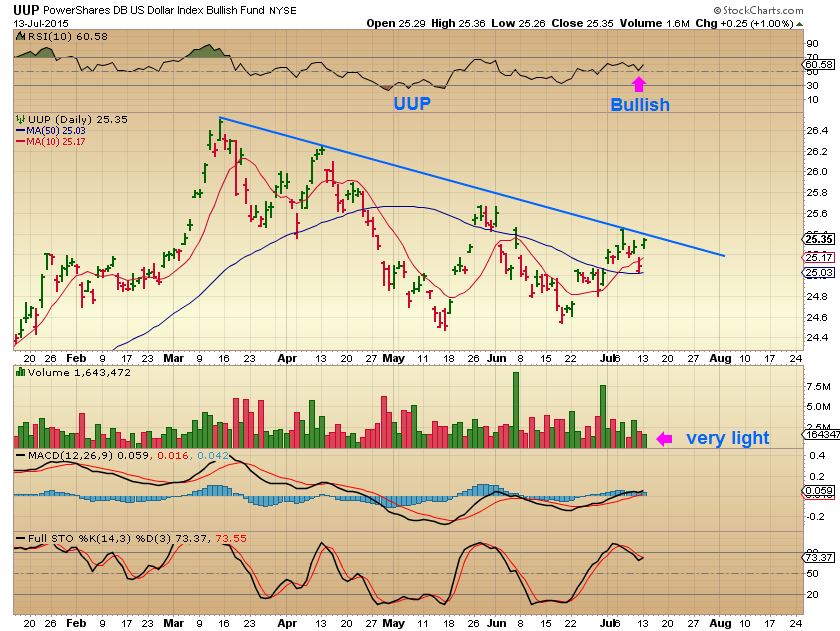
Let me ask…Is this chart Bullish to you? It looks very bullish to me…
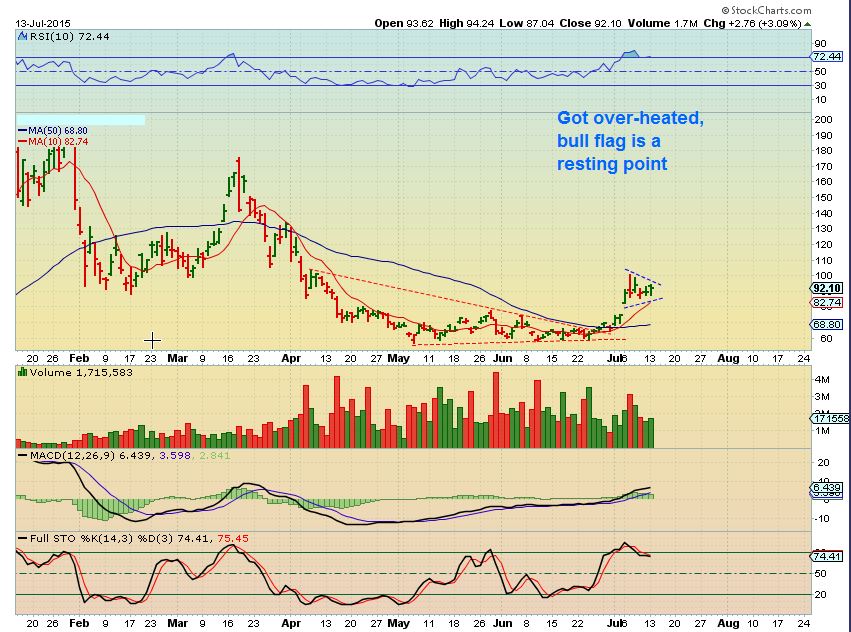
I received a couple of emails basically kindly saying , “You see oil as weak, but I see energy stocks moving higher and I think Oil is ready to explode higher. Can you look at it again?” The above chart is DWTI- inverse Oil. If it goes higher, Oil drops.
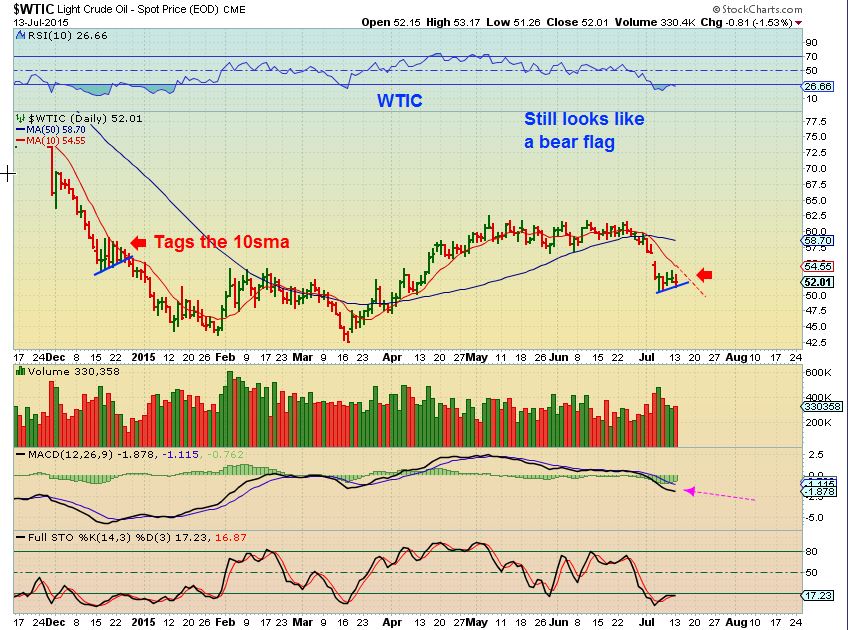
WTIC– this looks like a bear flag (So far) to me. The risk is the downside , so I cannot recommend going long until it gives me more reason to. Watch the 10sma. Look at DEC 2014, I remain cautious. Note: Oil is still very oversold , so it could actually run up to the 50sma and tag it, filling the gap. You can trade it that way with a stop close by, but I cant recommend it here as a low risk idea.
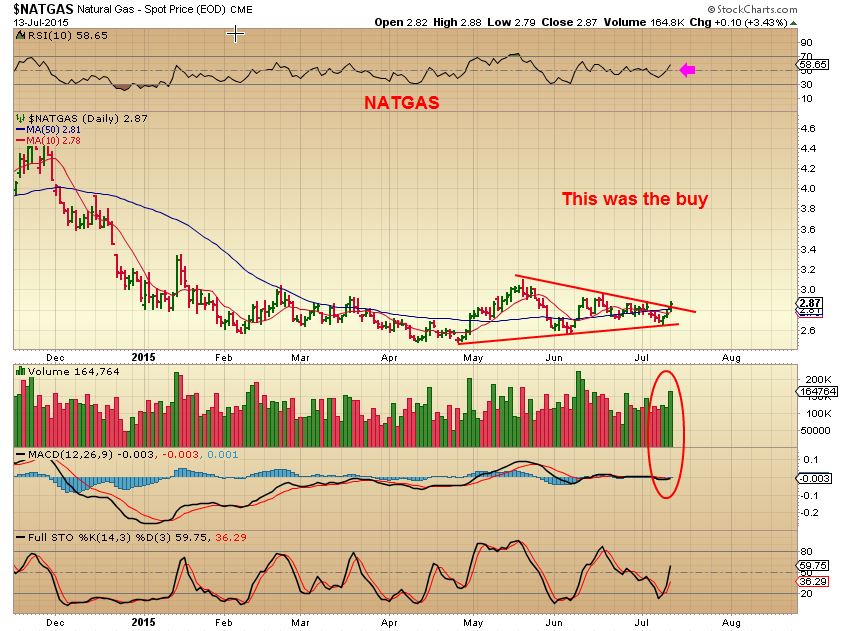
NATGAS – Its funny, I said in the wkend report that OIL looks weak, but NATAGS looks bullish. Buy a break of the upper trend line. I posted this chart- buy a break of the orange line or a back test of it.
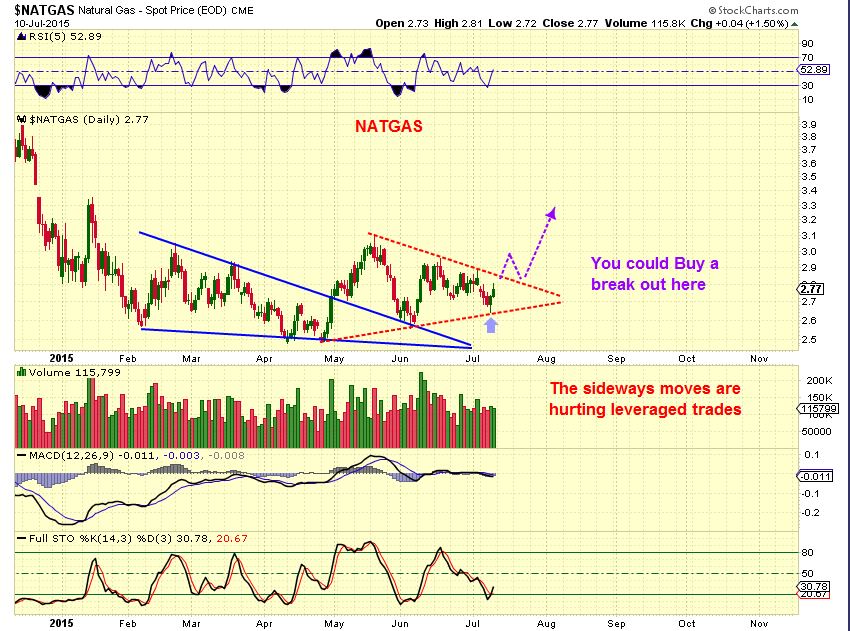
Monday – I like the volume and it is starting that break. You could buy with a stop below the 50sma or triangle.
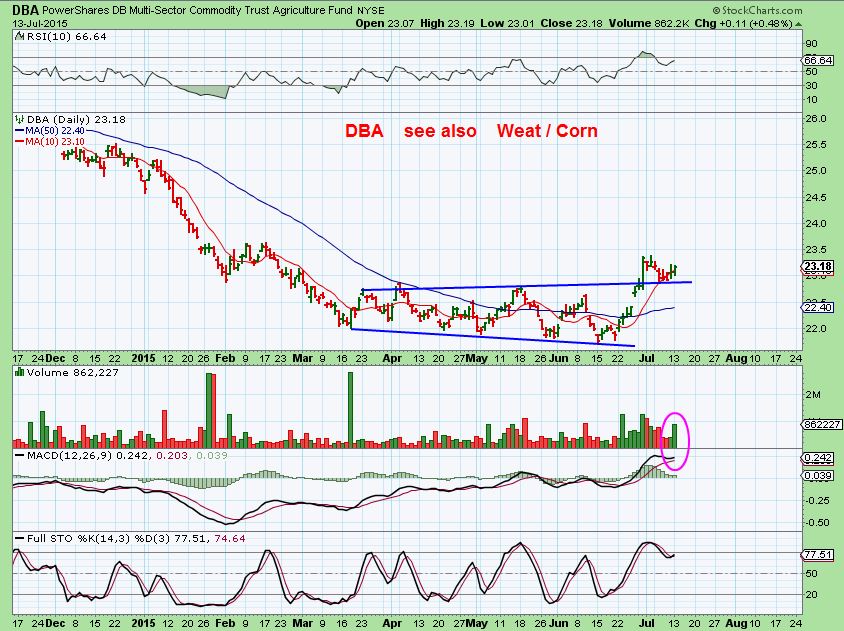
I have mentioned tickers CORN, WEAT, and DBA as bullish set ups.
DBA – bullish, loos like it wants to run to $25 from here.
GOLD SILVER & MINERS
Please re-read the weekend report if you need to be reminded of what I think is happening here.
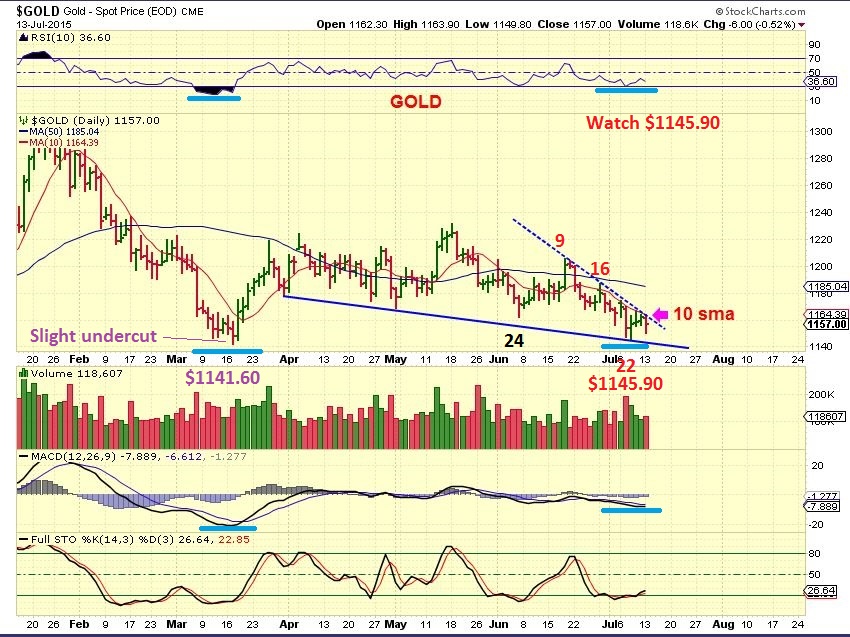
GOLD– the count continues or we have our lows in place? I’m watching to see if $1145.90 holds as the lows on day 22. Watch that trendline for a break and you can go long GLD on a close above it & the 10sma. Note: a slight undercut took place in Gold at the March lowsextending the daily count by 4 days. We may see that.
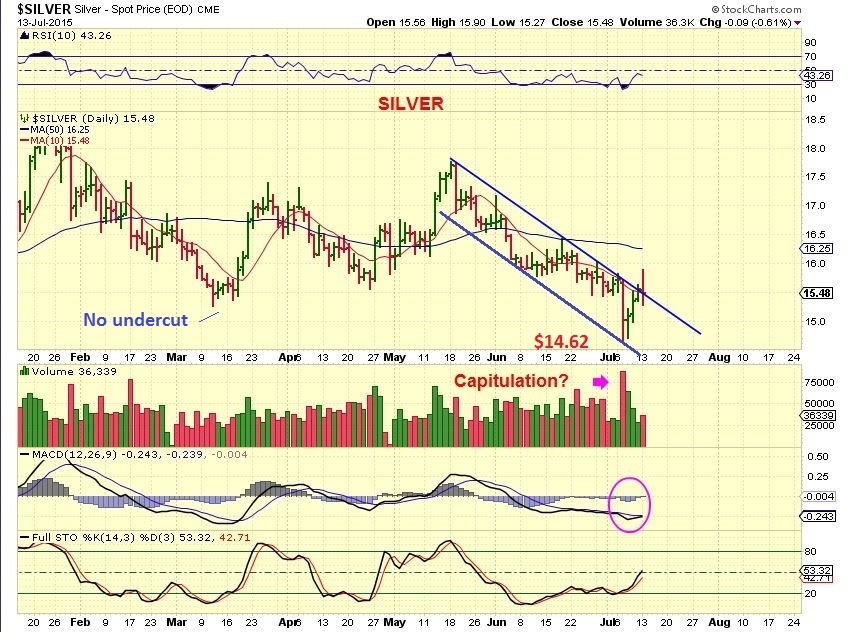
Silver – notice that Silver did NOT undercut its original low in March. Capitulation lows may be in, and I would say silver stocks are reacting bullishly. Watch $14.62.
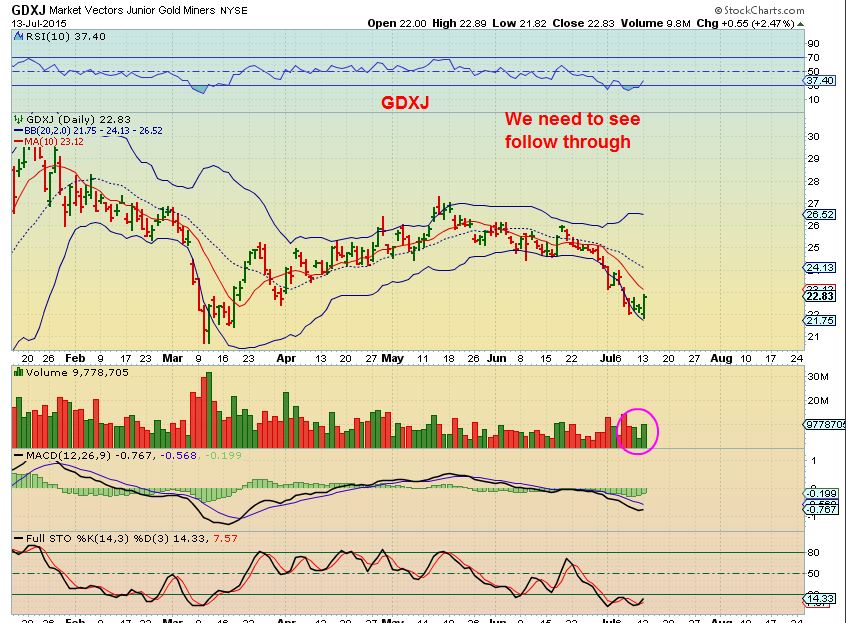
GDX was boring so I went to the juniors 🙂
GDXJ – Gold closed down $6 yesterday and was down more than that most of the day, but Juniors went green. Still below the 10sma, we would need follow through to gain confidence that a low may be forming. look back at the March lows. That represents over a week at the lows, they dont always come easy.
I thought that it would help to see how some miners were doing yesterday with Gold & Silver down.
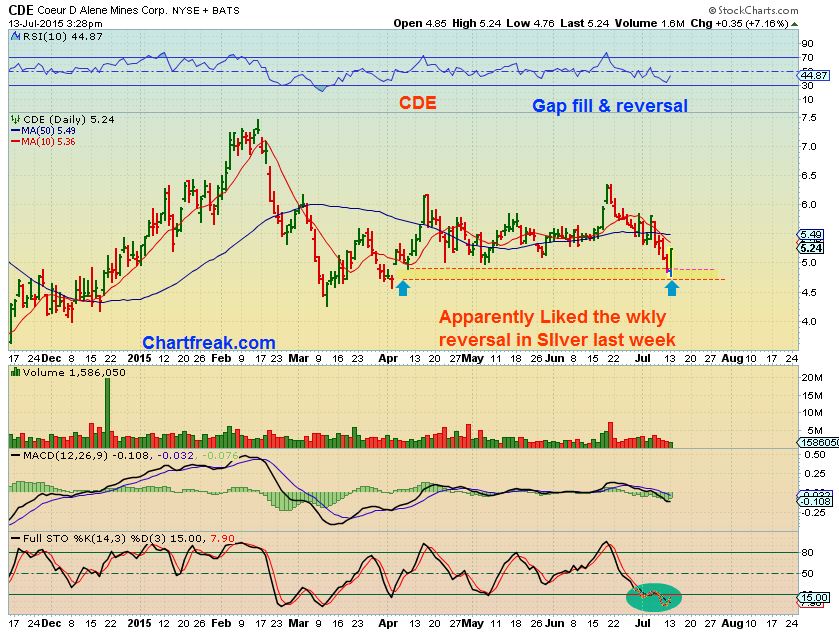
CDE before the close, up 7+%
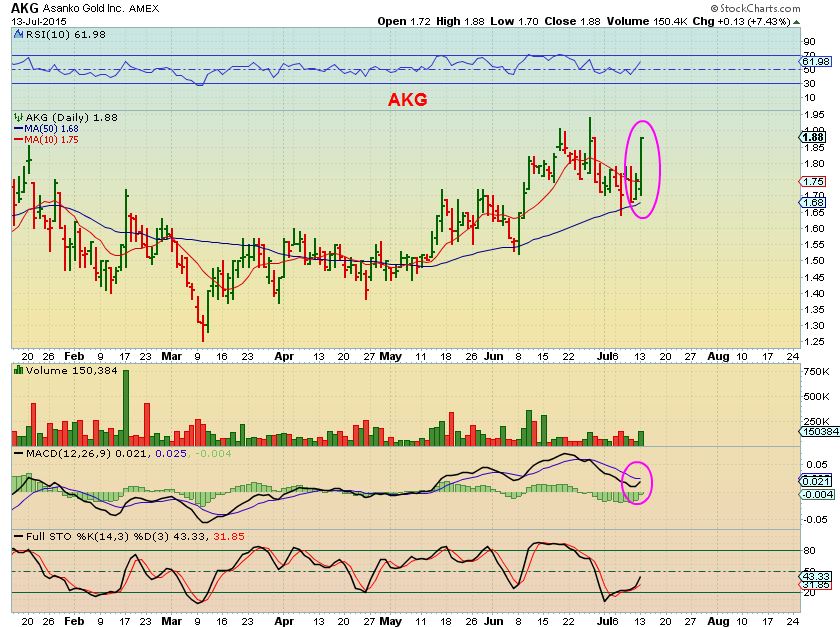
AKG – up 7% this stock does not look like we have been selling off. It’s up over 50% from March lows.
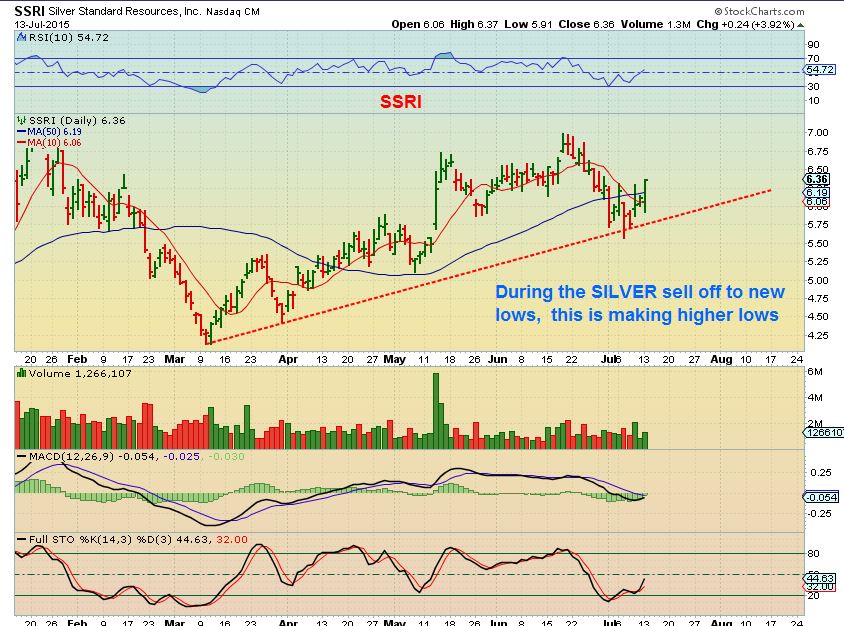
SSRI – higher lows since March and still up 50% from March lows. SILVER just broke its lows and everyone went short thinking SILVER lost support and would crash to $11, SSRI, AKG, a few others look strong.
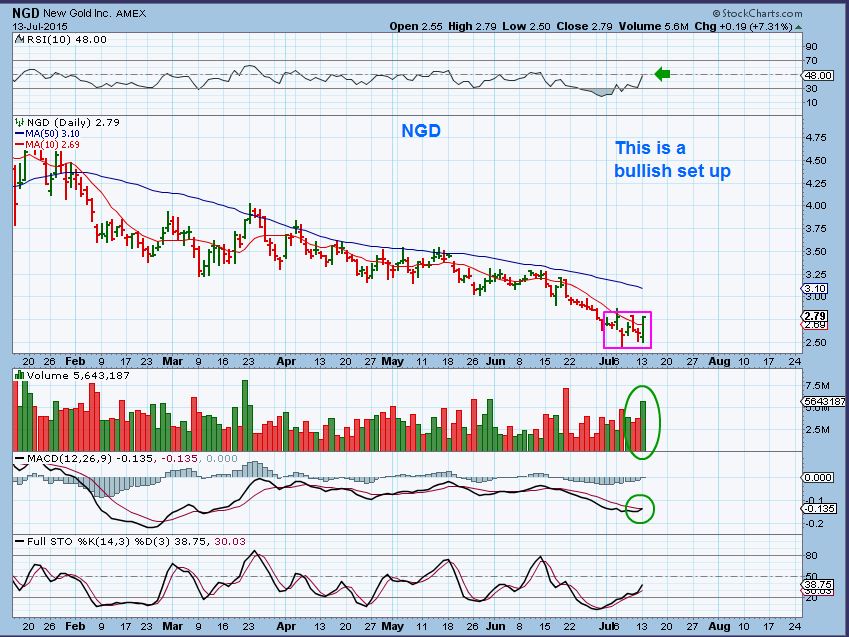
NGD – Bottoming? Up 7% while GOLD closed down $6
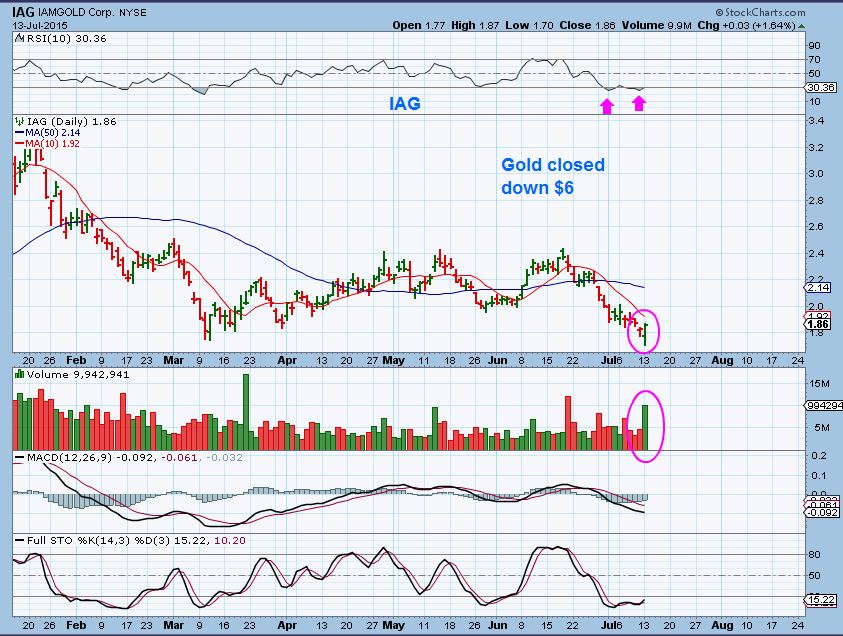
IAG – reversal at the lows with Gold down.
So I think the markets are set to go higher as mentioned in the weekend report. This is the time that you buy pullbacks to key areas or look for bullish stock set ups.
I think OIL could go higher to the 50sma and tag it, I will have to watch how it reacts if it gets there. The DWTI chart looks like a full flag however, and the OIL chart could be a bear flag.
NATGAS is a bullish set up and can be bought , or buy a dip.
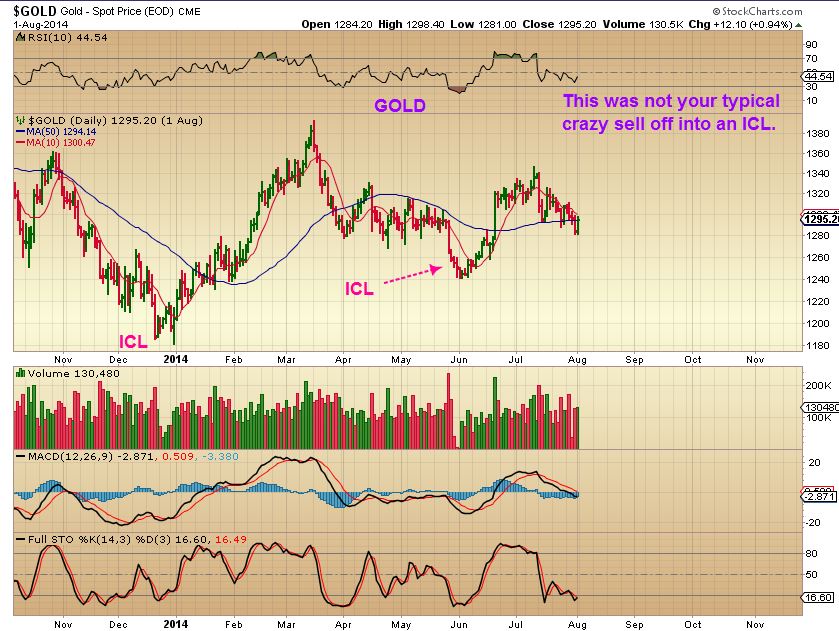
The weekend report covered what I expect in Precious Metals. I think we are putting in an early ICL due to the COT report, so I dont want to miss this next move. IF it proved to only be a DCL, then we would know early on and could step aside and wait for that final drop. It looks like a mild ICL. I cant say 100% that the lows are in here, but the stocks are starting to show bullish signs, bullish divergence, etc
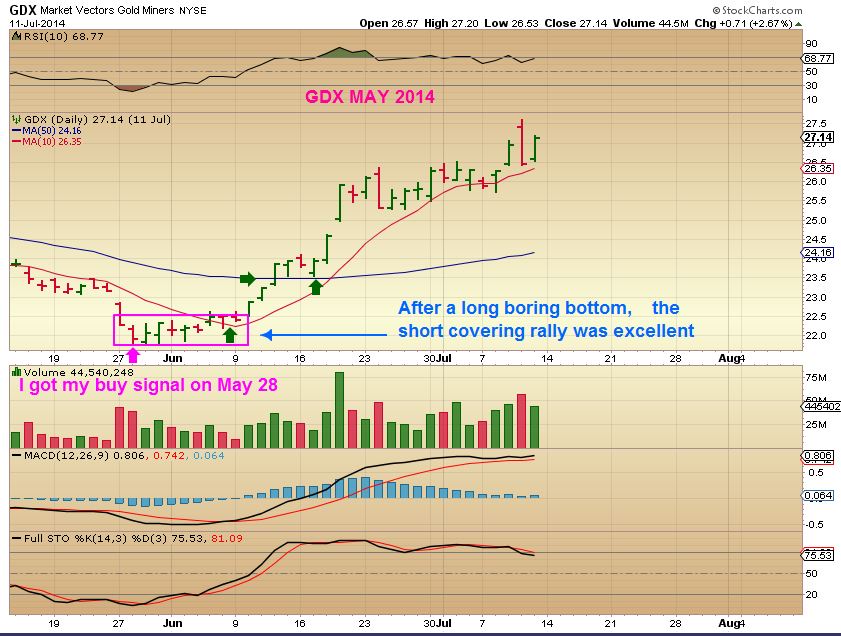
Let me show you a milder form of an ICL in MAY 2014. I was writing the chartfreak reports back then and got my BUY signal May 28. This run was great once it got going.
…Notice how long GDX lingered at the lows. Plenty of time to climb aboard, so dont feel like you are missing the move if you miss the lows. GDX bottomed late May and there was plenty of time to buy. Most expected it to keep dropping, it was too mild of a drop for an ICL, so holding was a little uncertain at times. THEN it took off with short covering, almost green everyday for 2 weeks. You could have bought (green arrows)
1. Above the 10sma, but there was a dip below & recovery.
2. The break of the 50sma could have been bought.
3 . The test of the 50sma could have been bought.
SO some may start buying their favorite Miners now in my opinion. I started taking positions yesterday and am still holding. Those COT #’s are telling me that a meaningful low is close. Some Silver stocks are still up 50% from March lows anyways, so there is strength. For those who hate risk, you may want to wait, as shown in the chart above. You could have bought that low a week later as it crossed the 10sma. 2 weeks later as it crossed the 50sma was still very profitable. Its up to your risk appetite, can you take a little draw down? I dont think the Miners are going to sell off in a big way after they get above the 10sma. I will keep an eye on things and keep reporting, but even the stocks I mentioned in this report with reversals yesterday are showing signs of buying. Start small and add later after they prove themselves may work well too.
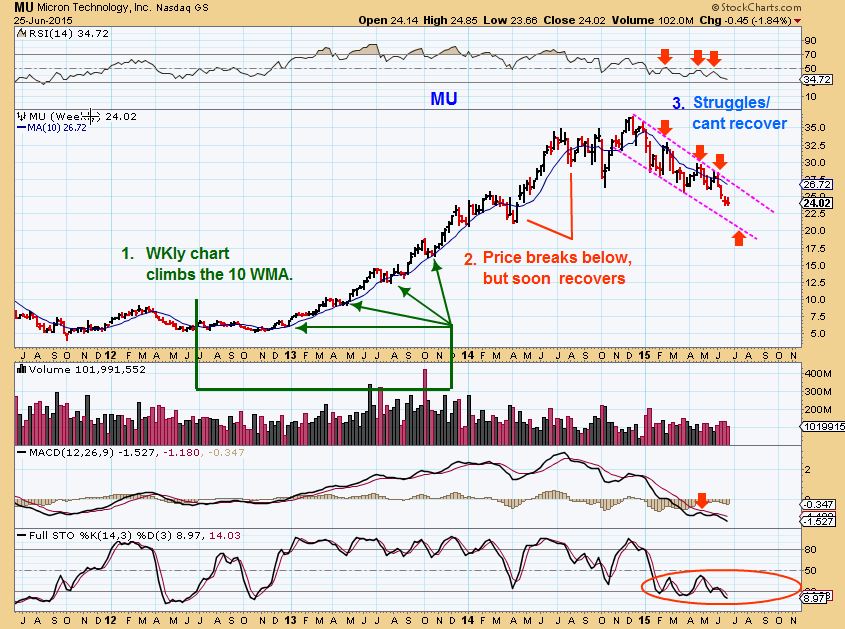
I will release this now (8:45) so it can be read, and I will add a few trade ideas later, please check back. I havent drawn the charts and need time to do so. I was going to recommend MU (Very oversold and bottomed yesterday) , but I just saw it up $2 in premkt. I had posted this MU chart here wks ago and looked to buy a bounce in the $17 area, since it broke below the trend line. We may be seeing a recovery of the beaten down stocks with this ICL in the SPX.
Thanks for being here, I will be back with more charts in 1/2 hr to 45 minutes?
~ALEX
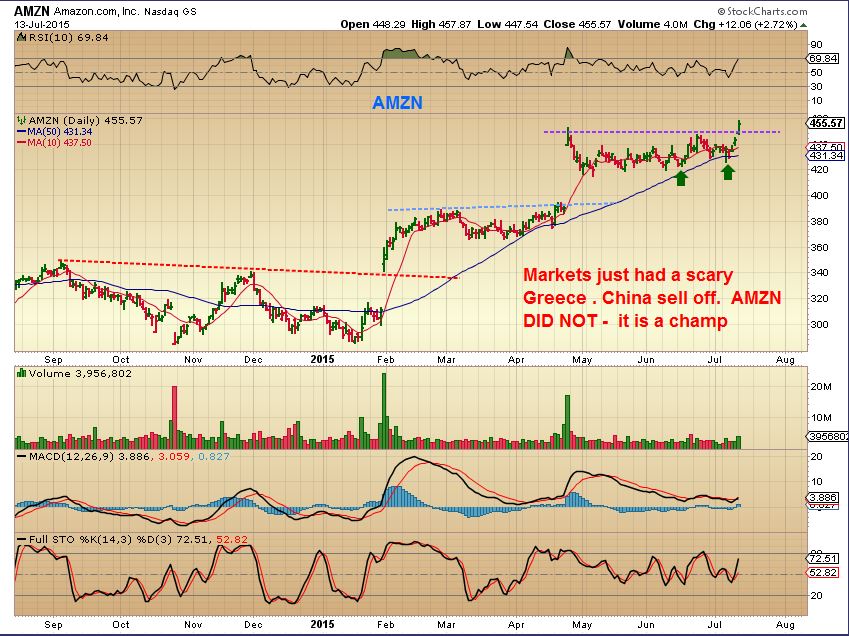
Trade Ideas… I want to start by saying that we have had volatile , shaky markets in a correction lately. If you see a stock that was strong and acted well, that says a lot about its stability going forward. Those holding that stock were not wanting to sell it , even in a correction. There are a few here.
AMZN – Solid stock.
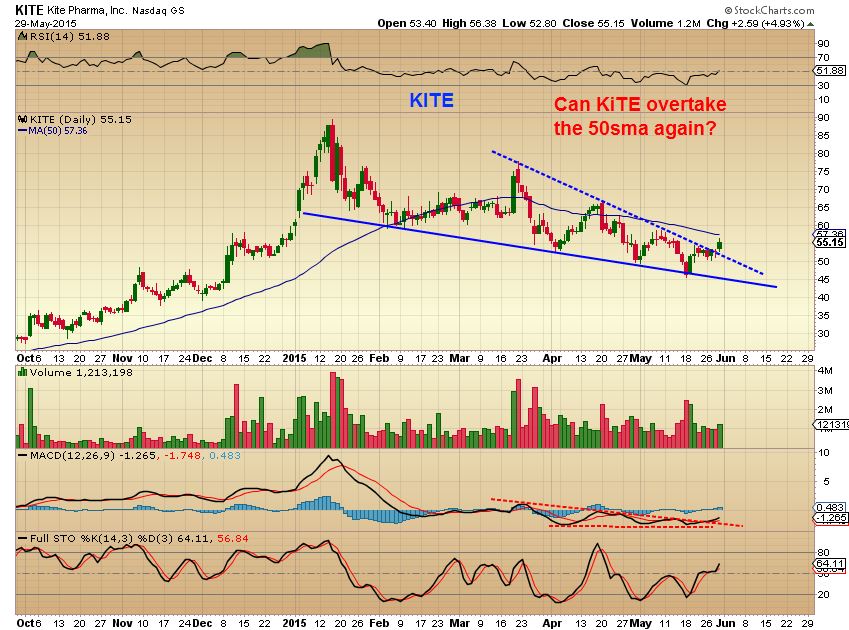
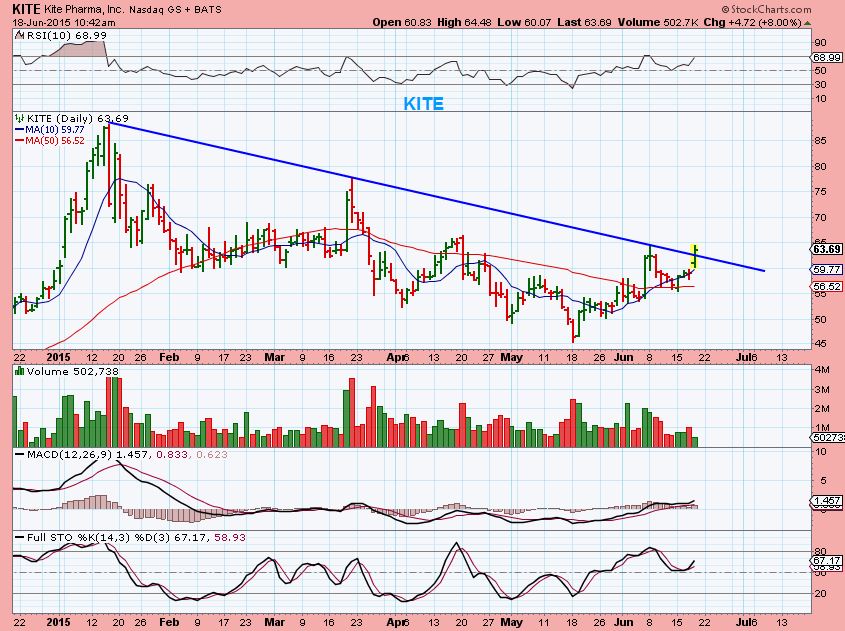
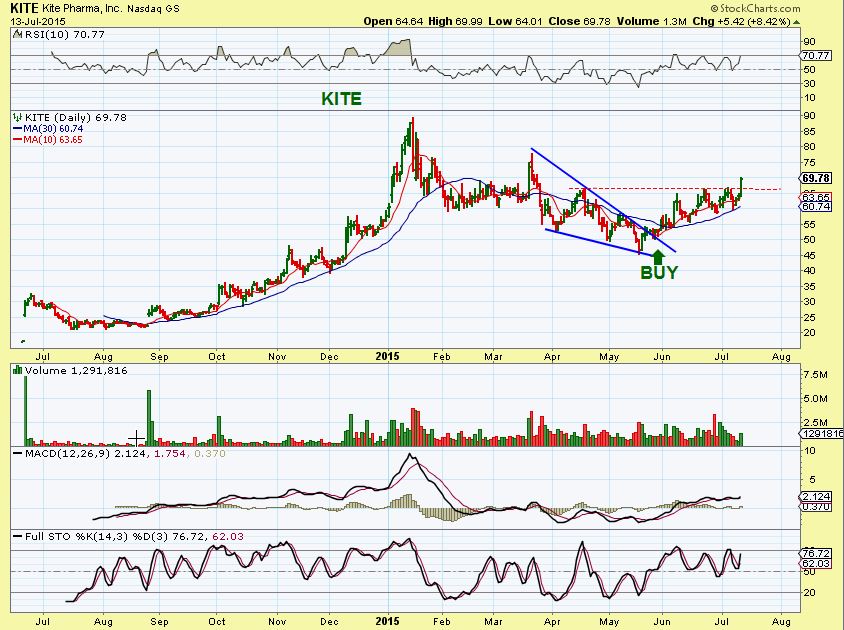
KITE – I have been pointing this one out as a good set up. It continues to act correctly each step of the way ,so it can be a longer term buy & hold now / rising stop. See all charts below
$55
 $63
$63
 $69.78
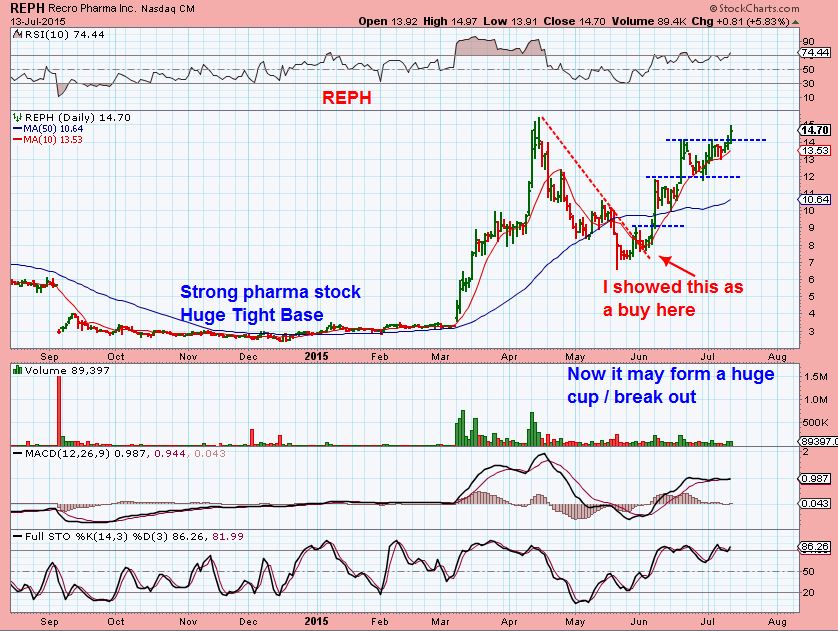
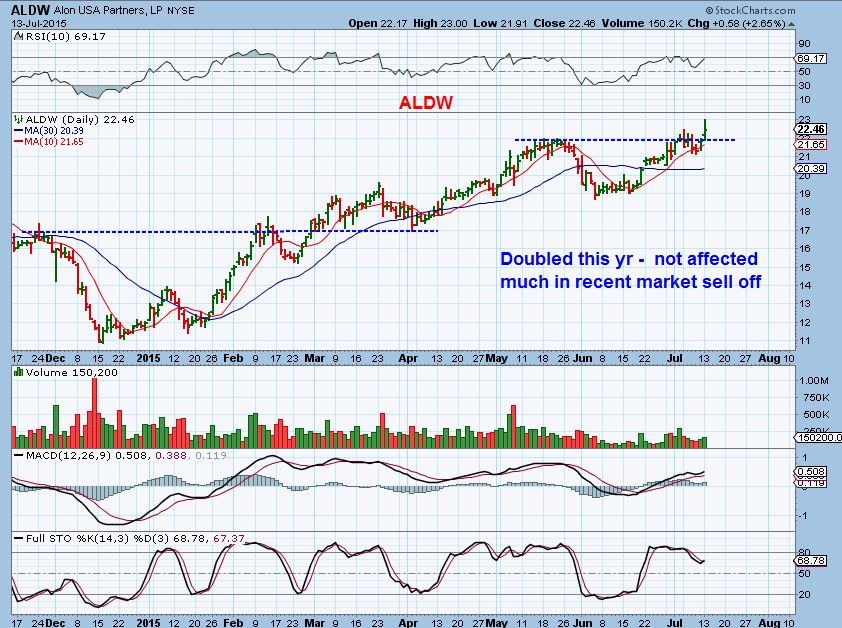
REPH…same thing. Strong Pharma company. HUGE RUN UP $3 to $15…I knew this would be strong. It was a buy at $6 and $8
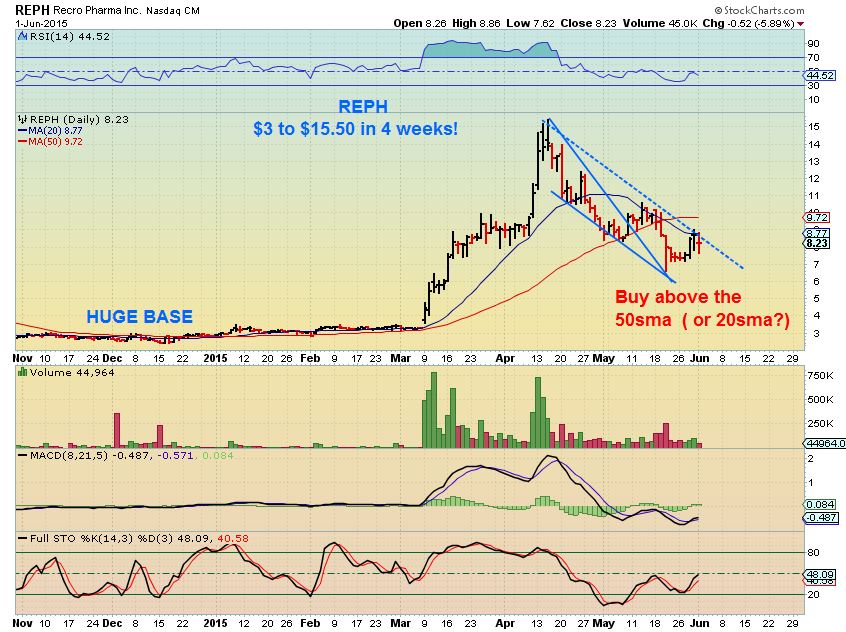
Still a Buy , though may form a handle.
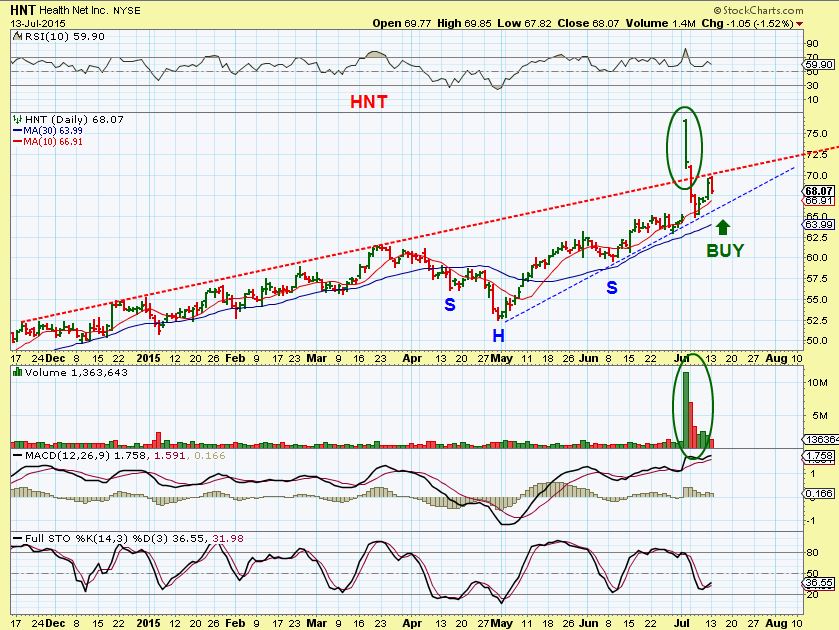
These 2 stocks werent affected by recent corrections.
HNT…almost a Buy again


ALEX, PHARMA? Recommendations?
Just added some 🙂
I have added some trade ideas to the end of the report.
These are stocks that didn’t show signs of weakness in the recent correction / volatile markets. They do not include MINERS, but I did show some reversals and miners in the report that I think are showing signs of reversals or strength and can be considered. I will likely j=have more tomorrow if today’s trading remains bullish
Go back and look when you recommended LJPC. Up 145% in 67 days. Nice call.
I’ve been watching that one daily , Bill. Because I didnt take the trade 🙁
Alex, I agree with what you are seeing in WTI, with one issue/question. I was looking at the chart and said the same thing, it looks like a bear flag forming. BUT, I am also seeing these long tails (see chart). I see them and think WTI can’t be sold off for long, so I’m leaning for a at least a bounce higher. News coming out of IRAN this morning will probably lower crude costs.
Right, as I mentioned, it is very oversold, so OIL could run up to the 50sma and tag it. At that point does it recover or drop again? At this point I would say it tags it and rolls over. I’ll know better when we get there though.
When the 50sma is lost, it is often ‘tested’ to see if it can be recovered. It is at that point that OIL will either recover or be rejected. I didnt have time to write everything in the report, because I wanted to release it , but My opinion is that it will depend on how much time OIL spends below the 50sma .
Check out TPLM with strong volume
CLNE
yes, there are a few . SZYM is trying to hold up too.
TPLM up big. Why, no news?
I’ve been watching TRX for weeks, and its doing a mini melt up.
It has almost doubled in a month , just moving higher and higher a little each day.
I like RIG, BAS and POT here. How do they look to you?
Its amazing how closely RIG & BAS charts look. They look like TWINS.
I see signs of a possible bottoming process here, but what I dont see yet is a clear low risk reason to buy yet. It’s till ok o take a chance, as long as you know the risk. No recovery of the 10sma yet. Downtrend line not really overcome yet. MACD cross almost in place.
SO If you bought here it would be with the idea of catching a possible bottom, not yet confirmed. Thats ok, but you need a tightish stop below recent lows. (refresh for a chart of Rig)
That’s how I see it. Sometimes I see bottoms that aren’t there yet and get in too early. Looking to learn from you as we go forward. Tight stops in place at recent lows. What’s your top analytics to look for in a low risk setup? close above the 10sma, MACD cross, oversold, RSI over 50?
Top analytic – above the 50 & 200 sma trending higher. 🙂 but I never wait that long, I try to catch the move out of lows for maximum % – Gain too, if the signs are there. yes above the 10sma is often important as step #1, but I even jump the gun on that with buying a lower low with large divergence in the RSI (if you know what I mean by that).
Sometimes bottom are more of a process than I have patience for – lol. I often try to get in early too, but then I get stuck in a bottoming process when I thought it would just take off.
A good example of an energy stock that looks like it already bottomed is MHR right now.
giggle
Hmmm, You seem to giggle a lot,
I have one ticker for you. MJNA 🙂
Sorry? lol .. oops-redact that ..
ahhh yes… mj ..and its twin.. potash- they move 2gether ;o)
of course … . being the astute speculator that I am…, I may have taken home some of that on occasion in days of old .. purely for research&analysis purposes …
I still watch GWPH daily. That should have been the buy and hold pick. what’s with MJNA? How low can you go?
MHR doesn’t look a buy to me. If it was a double bottom, sure. Still lower lows, below all the MAs, Oversold for sure and MACD crossing, RSI diverging
i actually think mhr LOOKS to be finishing 2 of III w/ the big III wave on deck .. jmho https://www.tradingview.com/x/udVGdQE8/
Whats your thoughts on WTI crude where are we wave wise?
ha! that’s what i suspected!! we all need shrinks! ha ha ha………………………….
i posted wti this morning… hmmm .. ohhh .. on yesterdays thread…
click on my name and you will see my “informative” (cough cough) threads……………….
dannnng… as pooh bear says … i feel a rumblin in my tummy… these oil stocks are all about to bust a rhyme .. i mean cut loose ………… ORRRR i just need some Tums… ;o)
And where is your homework to back this up Miss Maria?
lol… hmm i should prob just change my name to ” TheProblemChild” ha ha ha
well gut feel mostly but quickly b4 i get fired- PVA, MHR, ECR, XCO, SD all 10-12%
BAS MDR, DQ, REXX, TGS, onthe rise..DQ CLNE
**gut feel = kinda like the ocean waves are getting bigger..tide is rising..some of that salt water is hitting my face.. even when i stand on my tippy toes…..yea.. kinda like that 😉
Stopped out of REXX this morning. Bummer
Somebody here kept asking me about TWTR when it crashed. I basically said that after that crash it could bottom and your money would be stuck for a while.
It has based and sold down for a while, but Now it looks like the recovery is starting.
I love it when the Miners are down during the morning and then turn Green into the afternoon, because then we dont have gaps that need to be filled.
#willtheybuyintotheclose?
#hashtagger
#Idid
JNUG, late day, 5 cents off close. I’d still be short of it weren’t for recent CF analysis.
I remember last May vividly. 1 thing to watch out for – it was short. I left a fair amount of chips on the table for the ‘second leg up’. There never was one. So, if this is a more mild ICL like May 14 and Mar 15, we’ll have to stay frosty.
Still in but hedged now. A violent down and recovery would be much appreciated!
Anybody buy WMT last week! Double bottom, moving up. I’ll wait to see if it comes back to the 10MA.
Alex, whats your pick of the day? I need one more………..
lol.. u neeeeeeeeed one orrr u wannnnt one.. ;o)
No I Neeeeeeeeed to trade
WHat are you looking for ? A day trade? Buy and hold for a while? a ten bagger? 🙂
I don’t expect you to get a 10 bagger looking at something today. I’m looking for a week trade.
Yeah, I was kidding 🙂
I have a few , but ti’s always hard to know which ones will keep going & which wont (And anything Pharma is subject to “news” events about tests / trials / and the FDA etc.
Check out GALE
I mentioned DENN back when it was 10ish, now look at it on a 1.5 yr chart.
I think ZIOP is ready again
Obviously news can crush any stock. You can’t predict that. So, if you had to pick one right now, you like the Pharma sector. Probably because you think the general markets are going to trend higher for a week. Oil and Gold who knows! ZIOP looks good, higher his and lows, starting to get overbought! DENN scares me at those double top areas. Could pullback. I think GALE is the winner. All indicators pointing higher. Its after 4:00, I’ll look at it tomorrow.
I’ll throw a couple new ones in the report tomorrow
Sounds good.
Do you notice in general, that stocks tend to run up to the 50ma, then pullback from there, but if they break thru its generally a breakout?
I notice that if they sell off big time, they run to the 50 and often pause, because they run out of steam by the time they get back there. They then may break thru later. If they break down just a little below the 50sma and go sideways , they can pop right back thru (And break out higher).
I was thinking more of on the way up. See the attached of WMT. I suspect a touch of the 50 will be rejected lower, BUT if it breaks thru, it may run for a while.
SOL looks good to me. Between the 10 and 20 ma. MACD crossing up. Just bounced off the lower trend line. RSI at 0. Not a lot of volume? Anyone else, thoughts?