This weekends report will show what the Charts have to say about the health of various markets. Just like any living breathing thing, we can go from healthy to sick , from strong to weak and visa versa. What we will see can change, but this is what I am seeing at this point, based on the charts …
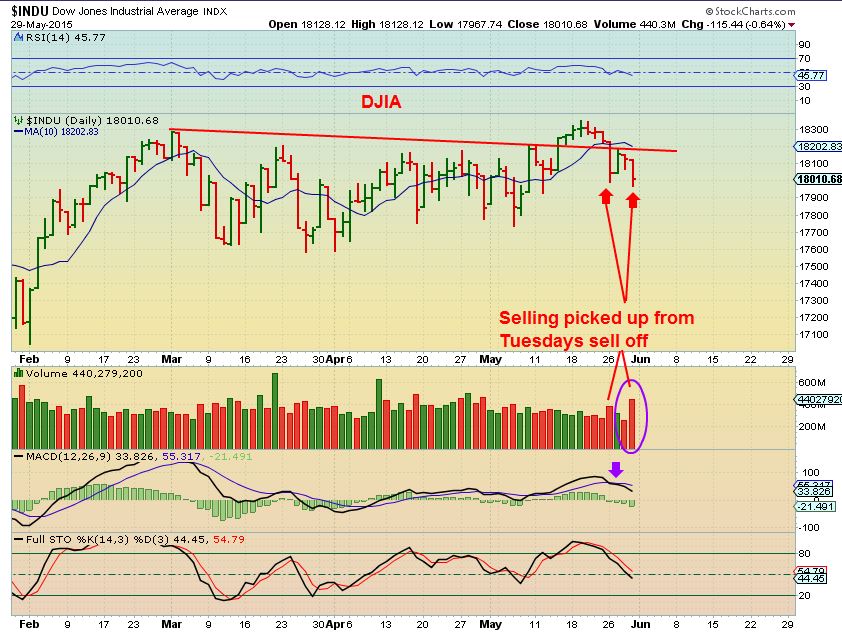
The DOW JONES INDUSTRIAL AVERAGE – Selling down with a MACD cross, volume picked up on Friday
So lets look at the DJIA WKLY chart…
Not exactly Ugly , but it is over bought on a WKLY & the WKLY MACD is weakening.
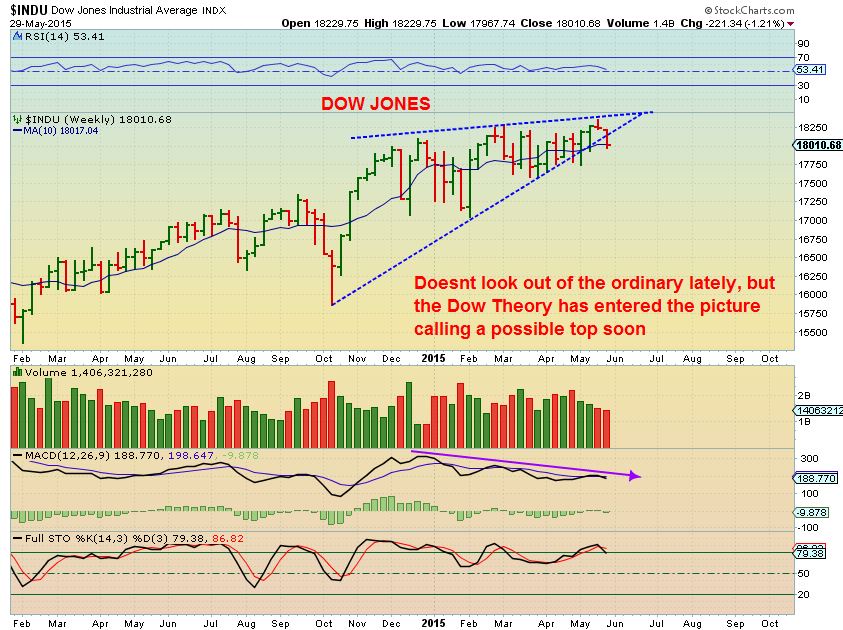
The DOW THEORY is coming into play now and it warns of a larger correction. Recently I pointed out the failing Transports. If the Transports ( see utilities too) , are no longer in an uptrend, it could be signalling a bigger sell off is coming in other areas of the markets.
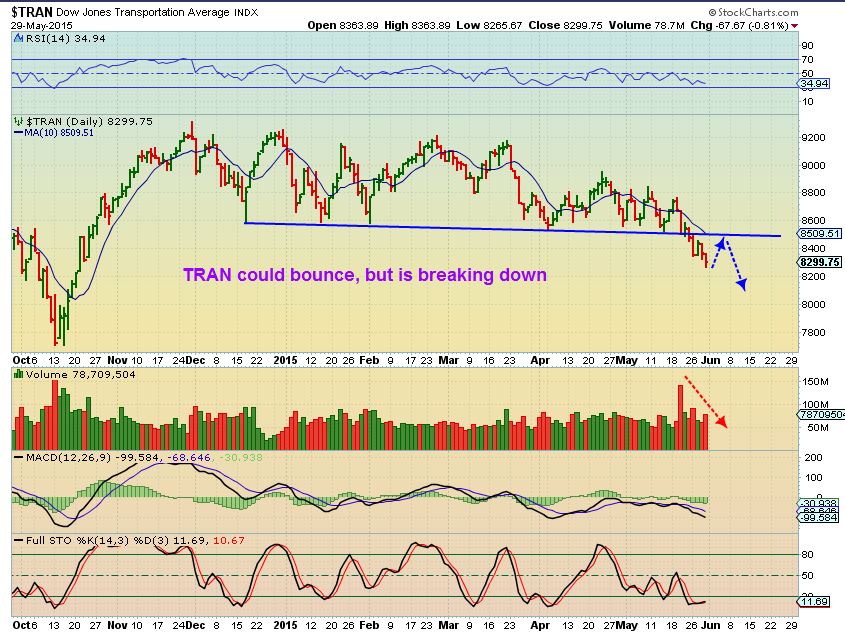
TRAN– Weakening
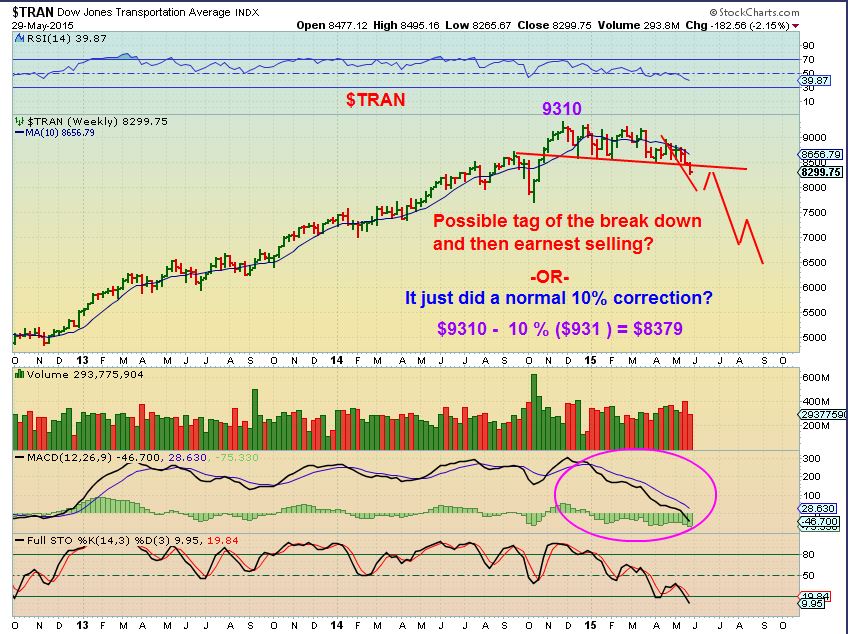
TRAN WKLY – It broke down this week and if it doesnt recover could lead a sell off. It looks Weak.
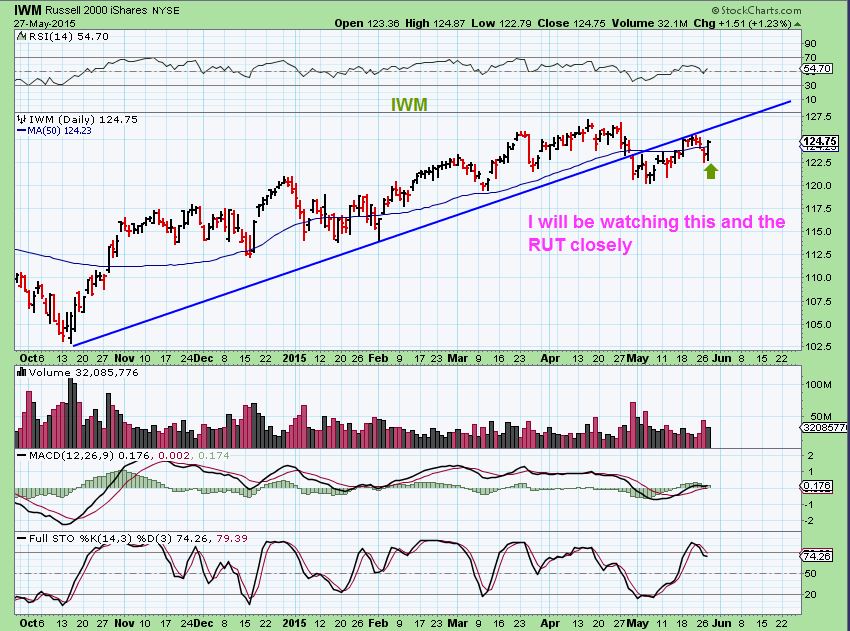
I showed this chart of the IWM ( And RUT) and they haven’t changed yet. Weakening.
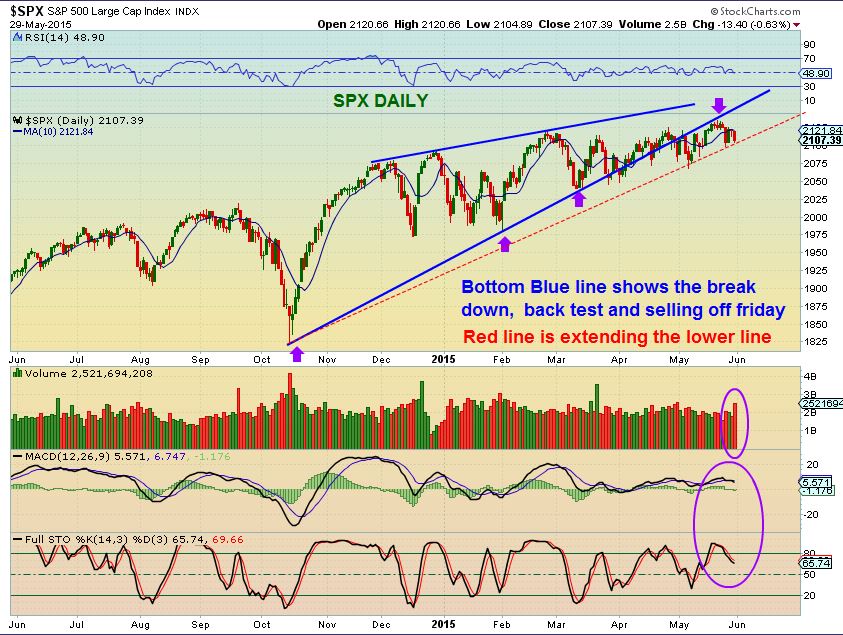
SPX Friday May 29 – I drew 2 lower trend-lines, but the Blue one is the initial one and shows weakness and breaking down. The Stochastics can sell down a lot more.
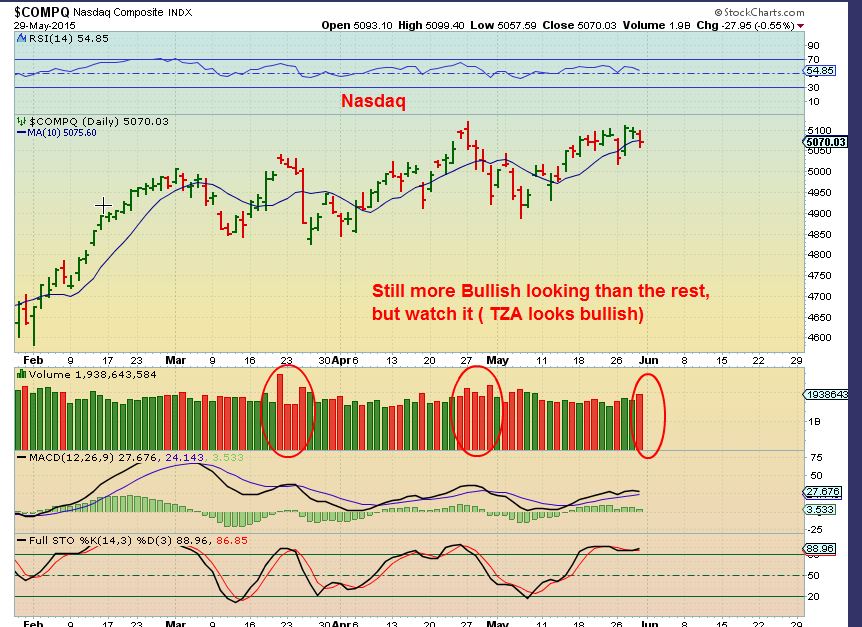
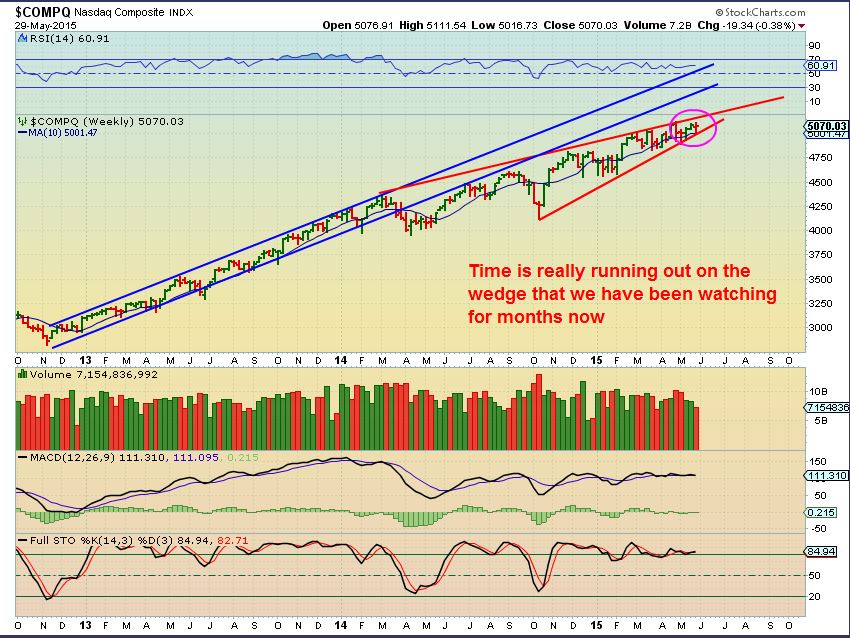
The NASDAQ has remained the strongest and is still near highs, but volume increased on the selling.
The big picture is still warning of a coming sell off
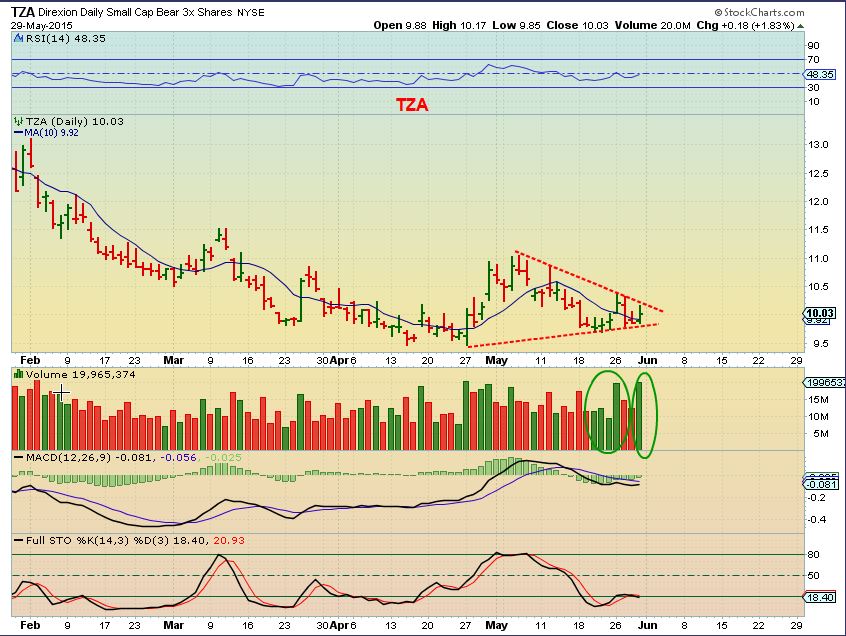
The chart of TZA , SDS , etc. looks more & more bullish with time
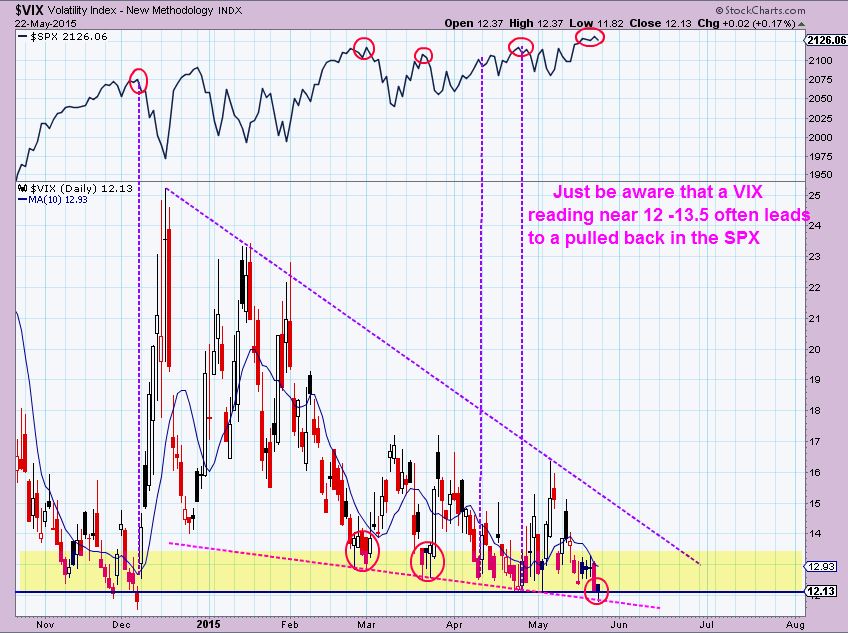
And when the VIX jumps, the markets drop . I showed the correlation in this May 22 chart with the Vix in the main window, SPX above
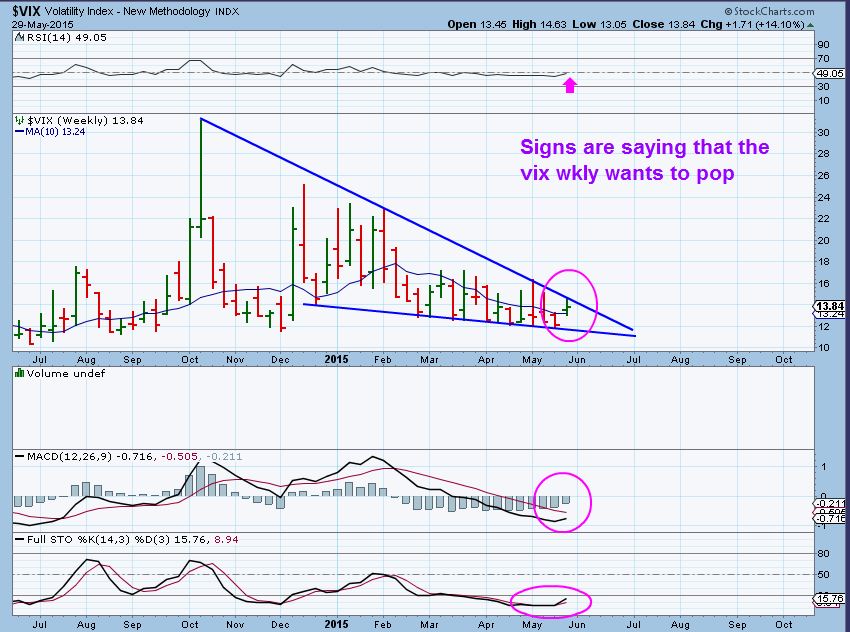
The WKLY VIX now – room to drop, but wants to pop soon.
SO I do see good chart set ups for trades in many stocks, especially in Tech and Bio-Tech. With the above information however, I would be a ‘shorter term trader’ at this point and raise stops if my Retirement fund is in the ETFs for the equity markets. When markets do top , it takes some time as distribution allows escape for smart money at the top and the last ones in (retail buyers) buy the new highs and get stuck. Is this a TOP or possibly just a correction coming? Time will tell , but it says caution .
Chart 1- With OIL I brought to our attention Thursday that we had a reversal on the daily and could trade UCO, USO, UWTI. Maybe we dont tag that $54 area that everyone was looking for.
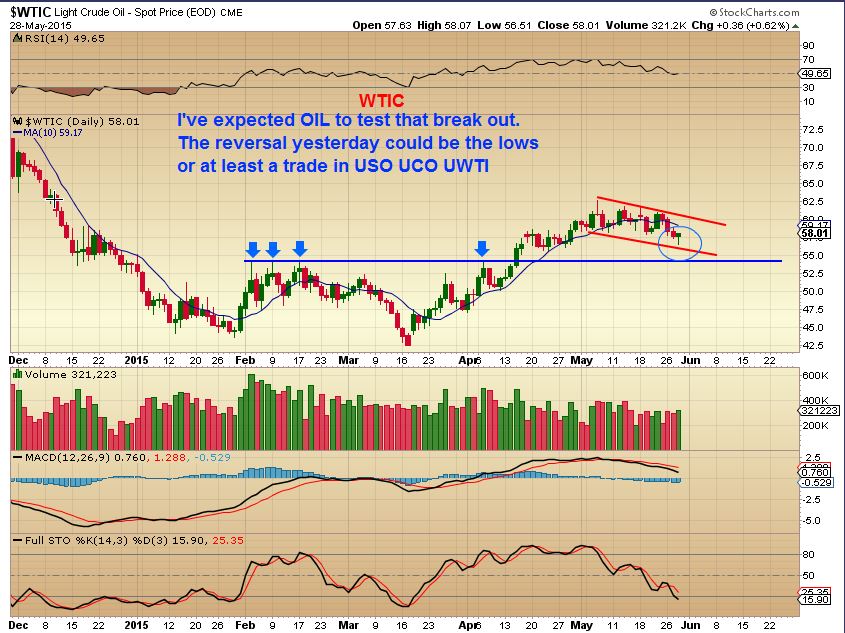
Also Thursday : The wkly reversal right off of the 10WMA (Chart 2 ) . The first run up was GREAT, is it ready for round 2? Holding the 10 WMA into Fridays close would be Bullish .
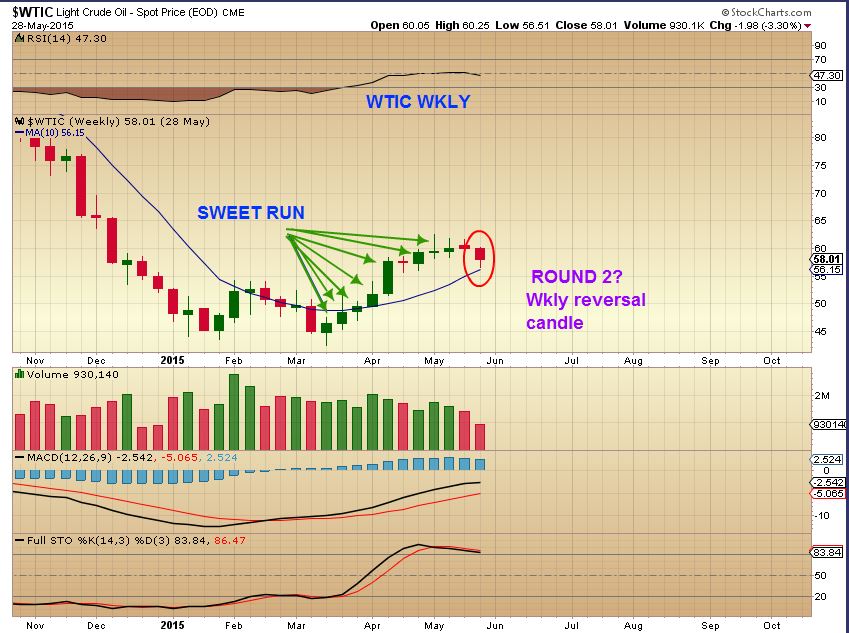
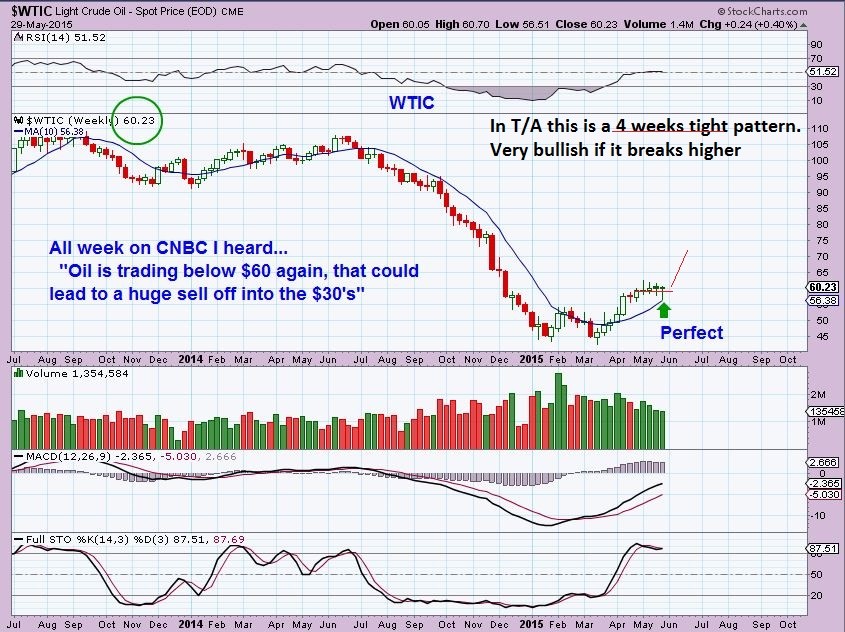
Friday that WKLY chart got even better. Oil moved higher , tightening the candle . Oil remains Strong and healthy despite what CNBC analysts say .
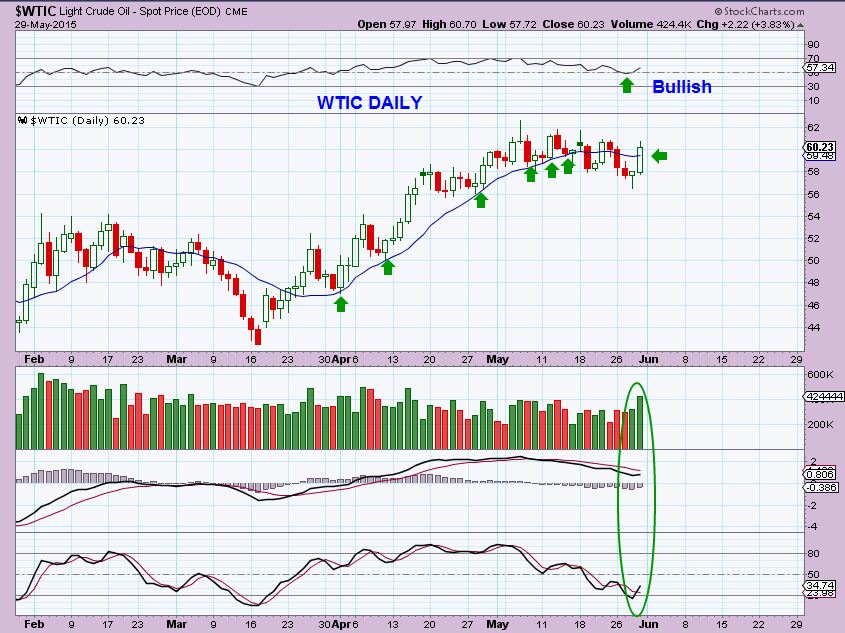
OIL DAILY FRIDAY – BULLISH FOLLOW-THROUGH On Strong volume. That looks like the daily cycle low.
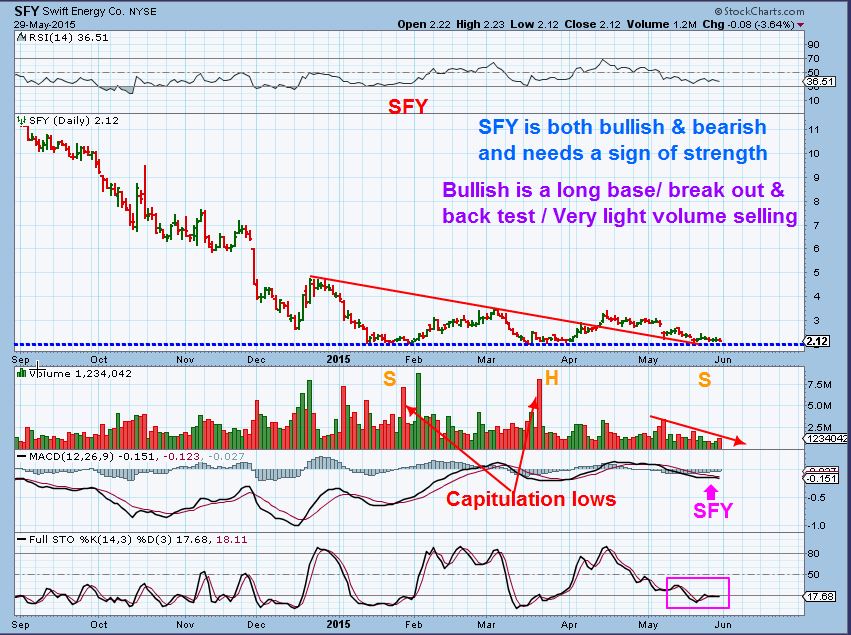
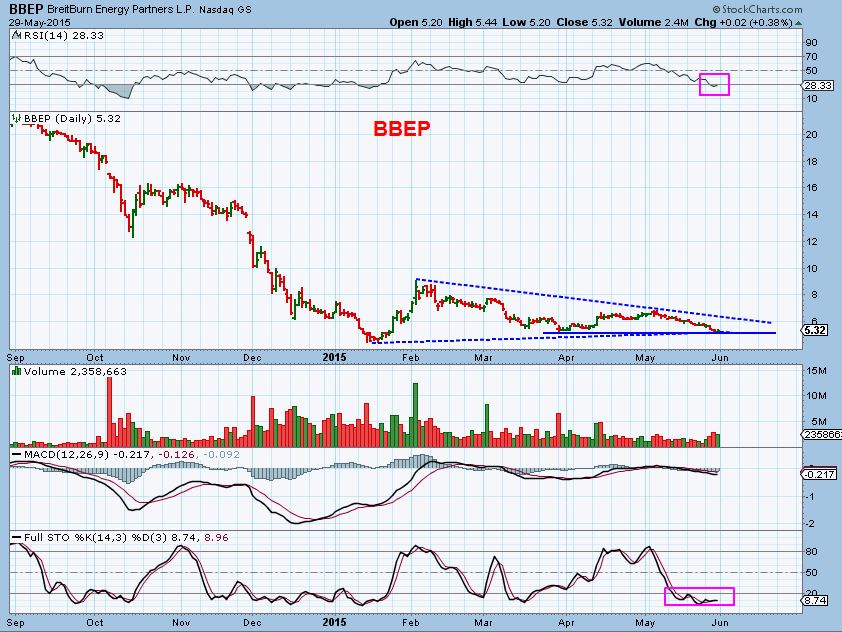
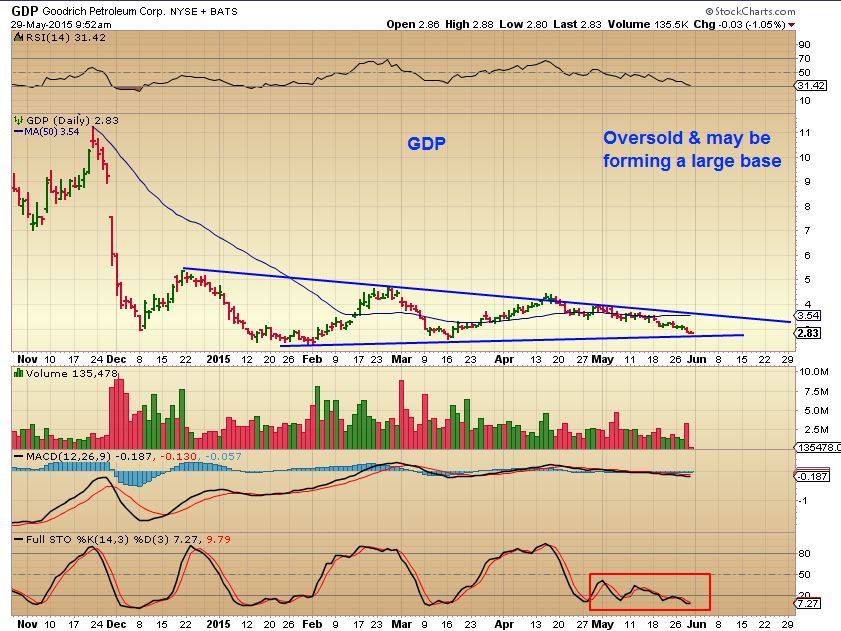
Interestingly, the XLE & OIH didnt react that much. I was a little surprised, but not overly concerned at this point. I need to see that change however, because some of my former favorites are near lows or seem weak ( WTI, SFY, BBEP, LGCY, GDP, etc) . I am watching REXX, BASS, KEG , etc since they are stronger above their 50sma and want to see them break upward. All 3 are pinched between the 10sma and the 50sma right now .
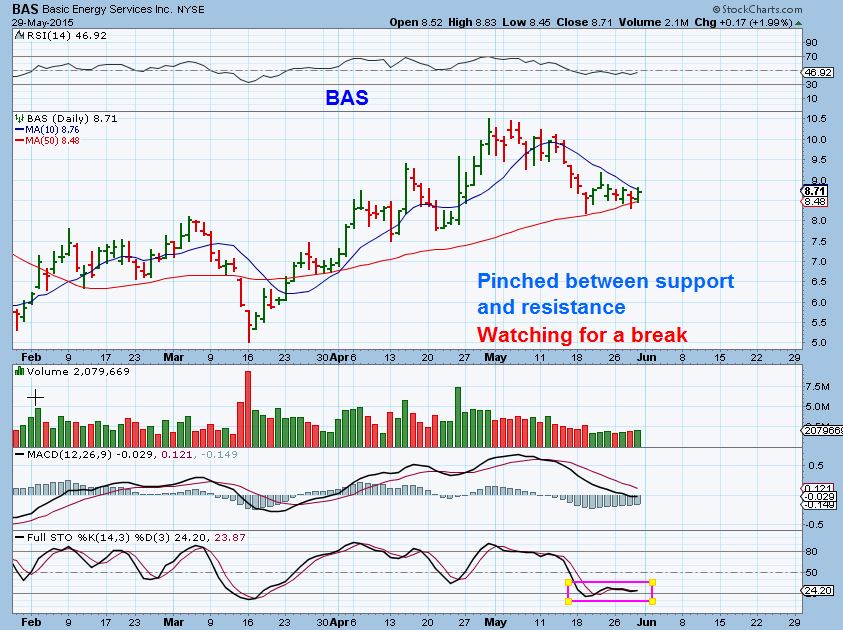
Examples of weaker ones that may just still be forming bullish bases. Need further proof.
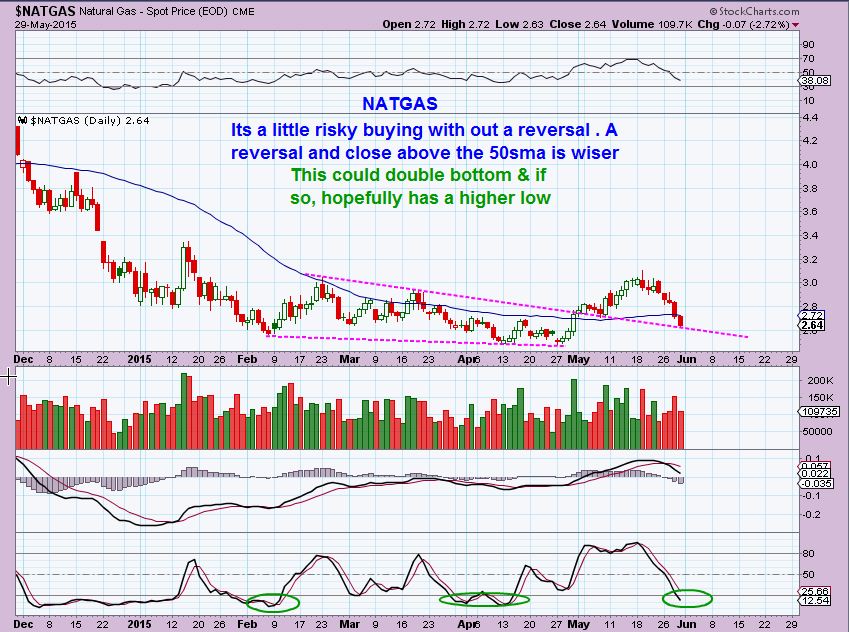
NATGAS – Thursday I said OIL looked strong, but NATGAS could keep selling. My Thursday chart had a Possible trend-line target
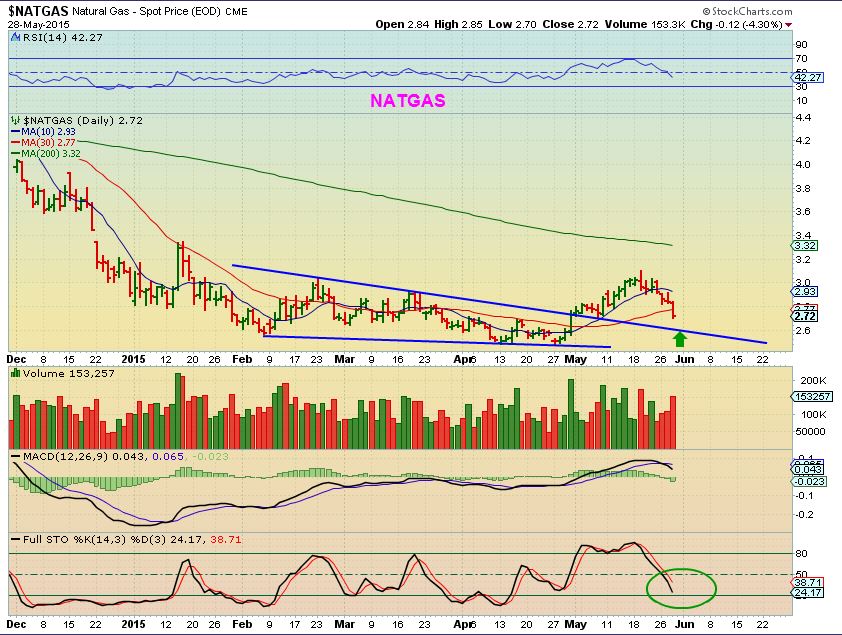
NATGAS is there now , but it needs a reversal or sign of strength now.
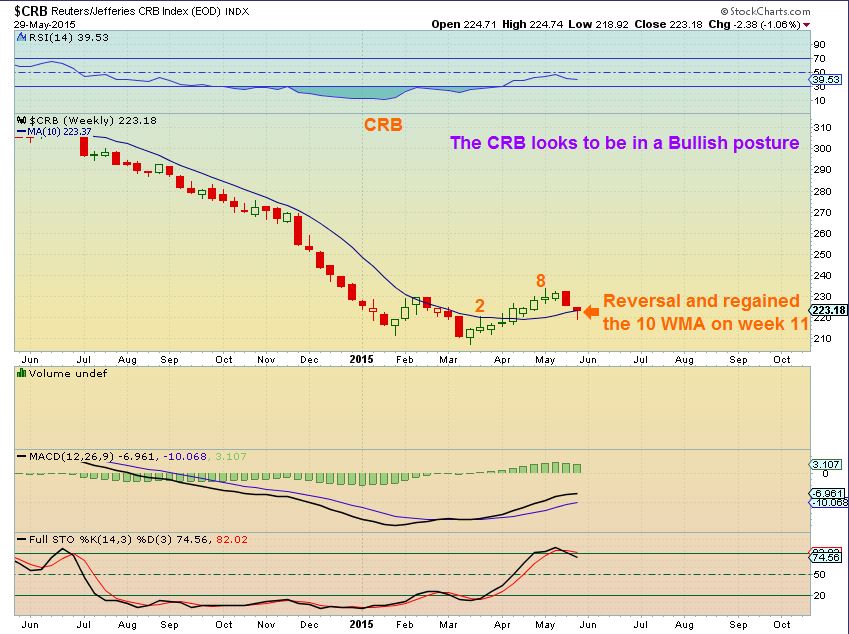
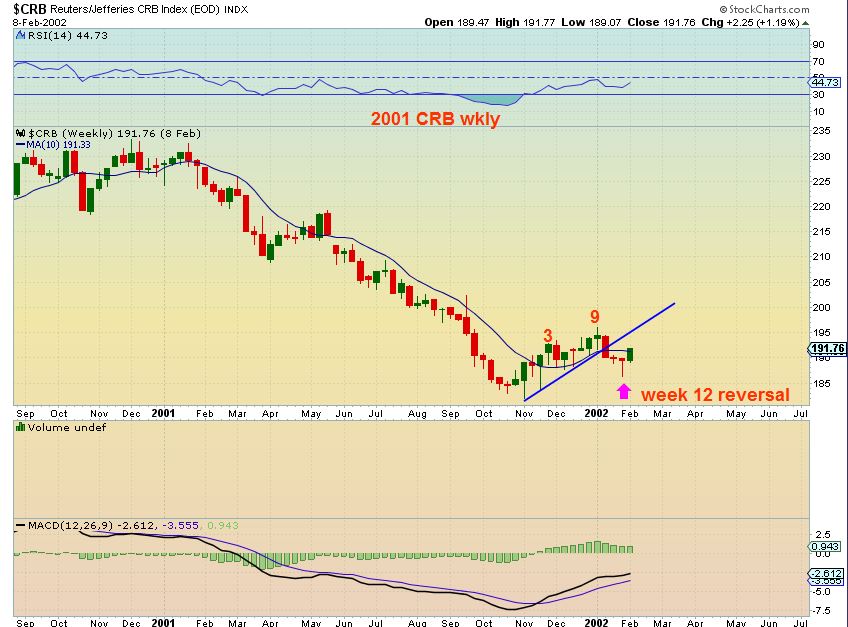
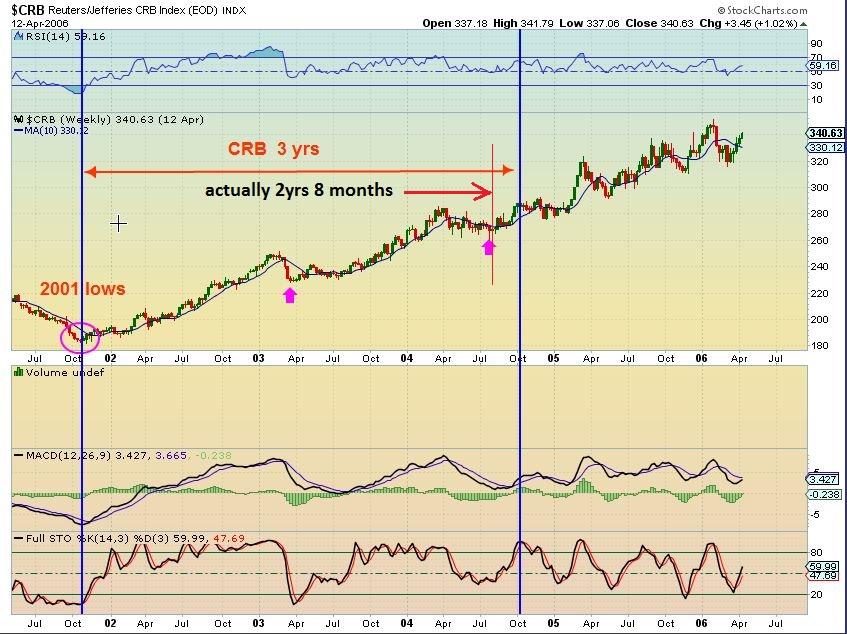
The CRB – Looks strong to me and look at the 2 charts below . There is an interesting similarity between the CRB lows now and the CRB lows in lows in 2001. Almost twins so far.
CRB WKLY – Runs higher for 9 weeks , sells down for a couple of weeks. Now it reversed at the 10WMA on week 11
CRB 2001 – 9 week run up, sells off for 3 weeks and reverses on wk 12
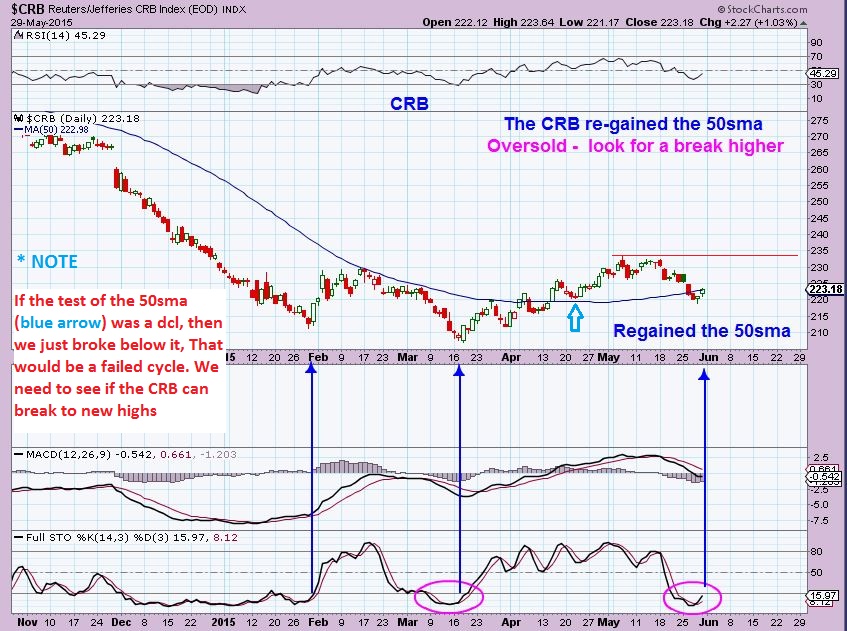
The Current daily chart of the CRB. I noticed a possible failure if the April tag of the 50sma was the 1st dcl. The recent stop run below the 50sma causes that to look like a cycle failure. A failure would cause this to roll over after a bounce and not exceed the red line.
We had a brief conversation in the comments section about the CRB. One of our readers announced that the rally in the CRB is likely over. He thinks the CRB is done moving higher, because he expects 3 yr lows before a bottom can be in .
For those unfamiliar, a 3 yr low means that in either an uptrend or down trend a dominant low is seen roughly every 3 yrs. I agree that these lows come ‘roughly’ every 3 yrs, but my thought was ” Could we have just seen the 3 yr low in March even though March would be early?” Is there precedence that this can happen so we can remain open to that possibility? Here is what I have found.
Notice the Lows of the CRB 2001 OCT/NOV. Count forward 3 yrs for the next dominant low. It is barley visible , arrived early at 2yr 8 months (4 months shy of 3 yrs at OCT /NOV). So a 3 yr low can come early.
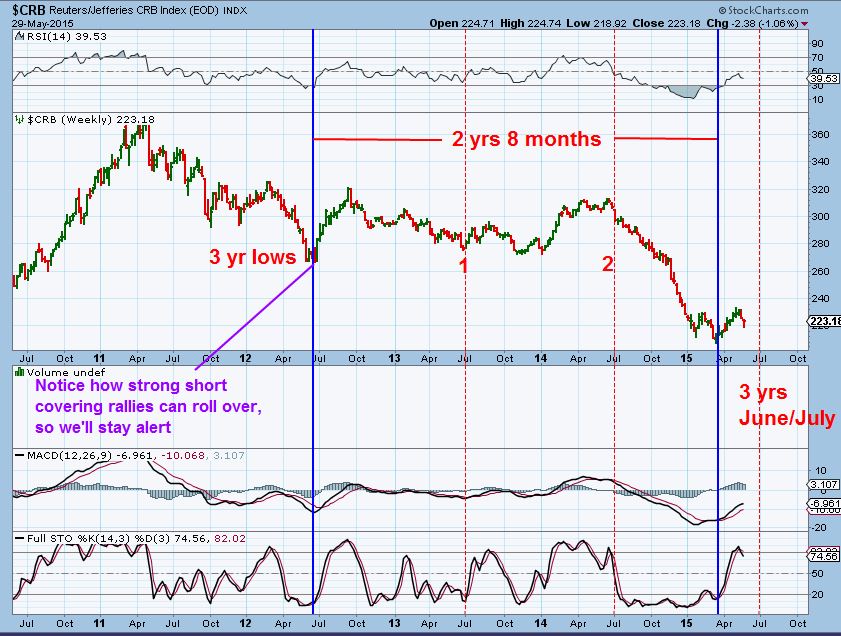
CRB – Here is the current 3 yr low. The above chart shows that it is a possibility timing wise that THE lows can come 2 yrs 8 months . We have that with our March lows. I also remain alert to the possibility that we can roll over, since other nice rallies did, but again, the lows may be in. Time will tell.
GOLD/SILVER/ MINERS
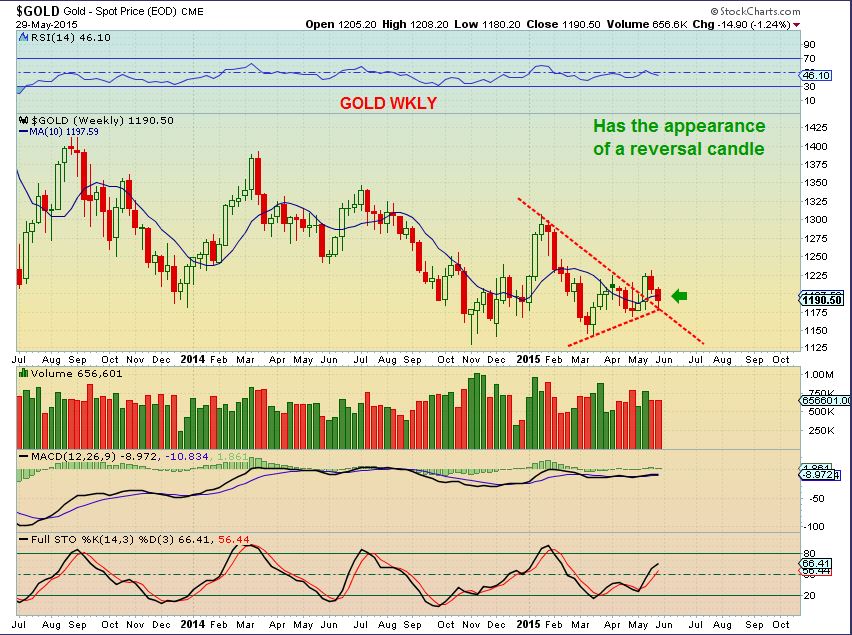
Golds wkly chart – looks good, has the appearance of a break out & back test.
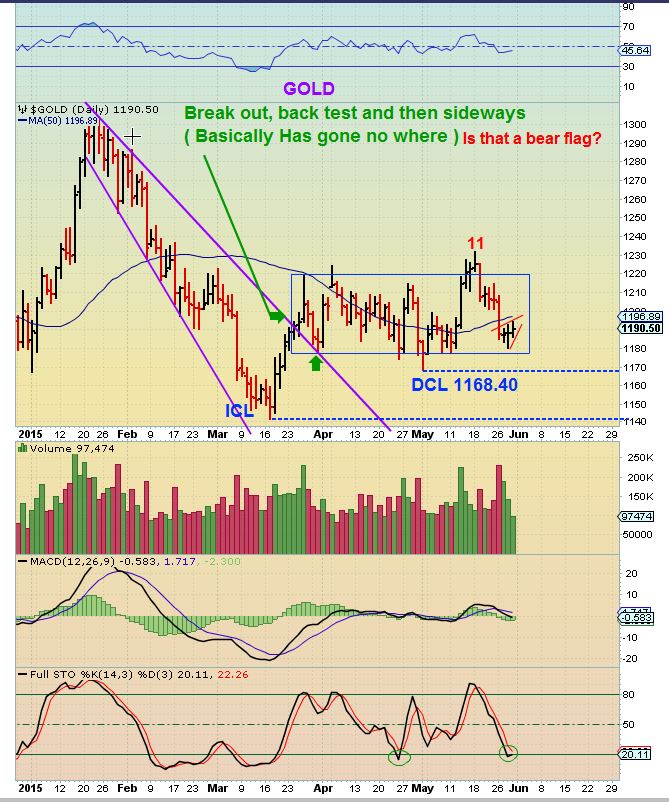
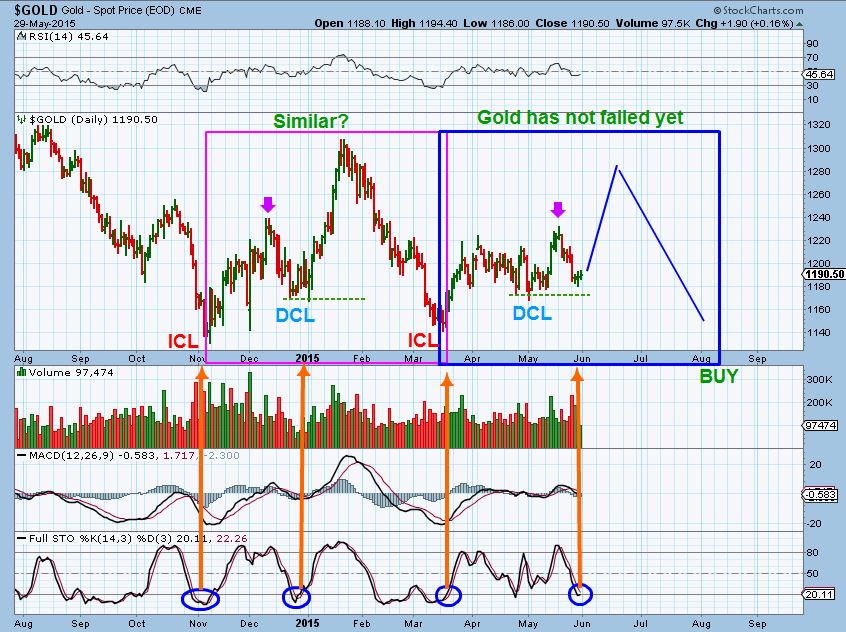
GOLD Daily – it has basically been going sideways for weeks. It is oversold and looks to possibly have put in a Daily Cycle low Thursday which means we should go higher ( In T/Analysis , it could be a bear flag however) . If we just continue sideways to eat up time , a DCL may come this week. A break below 1168.40 is a failure.
GOLD – I always stare at then & now. Very similar. Gold supposedly ‘Failed” then, but I called it a stop run and it zoomed from $1170 to over $1300. Could we run up like that again, and then drop into an ICL? Gold is oversold again.
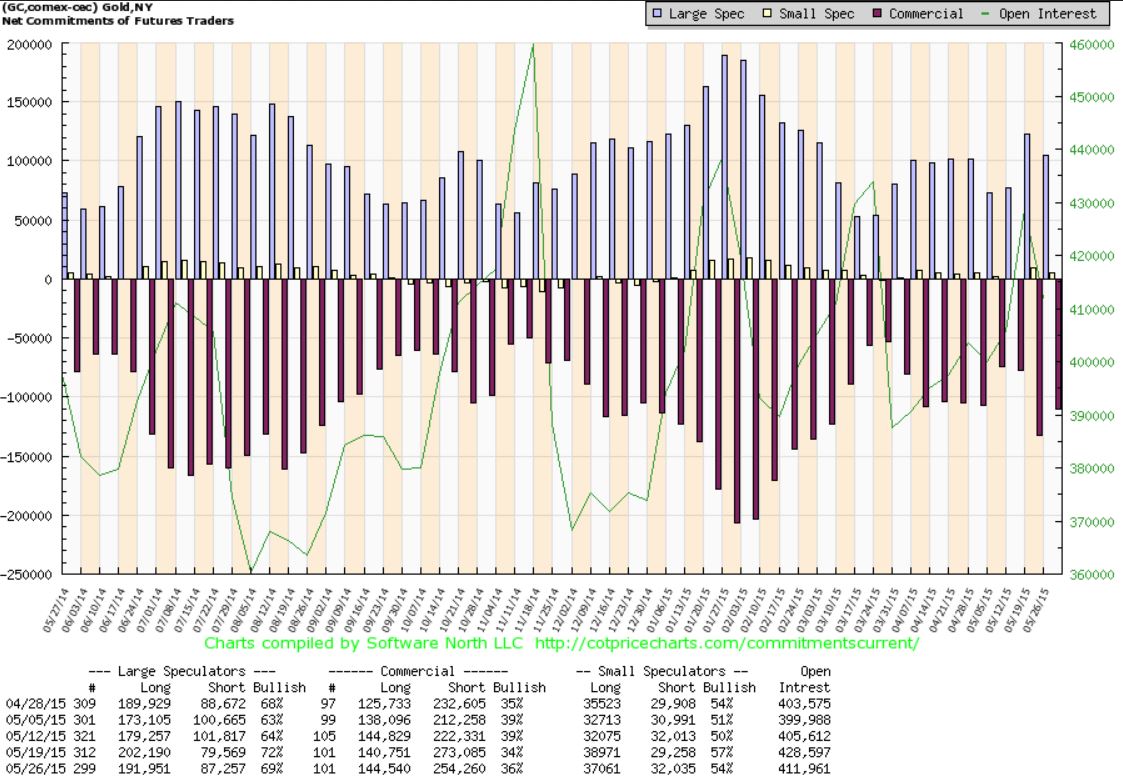
GOLDS COT – It did have a little improvement
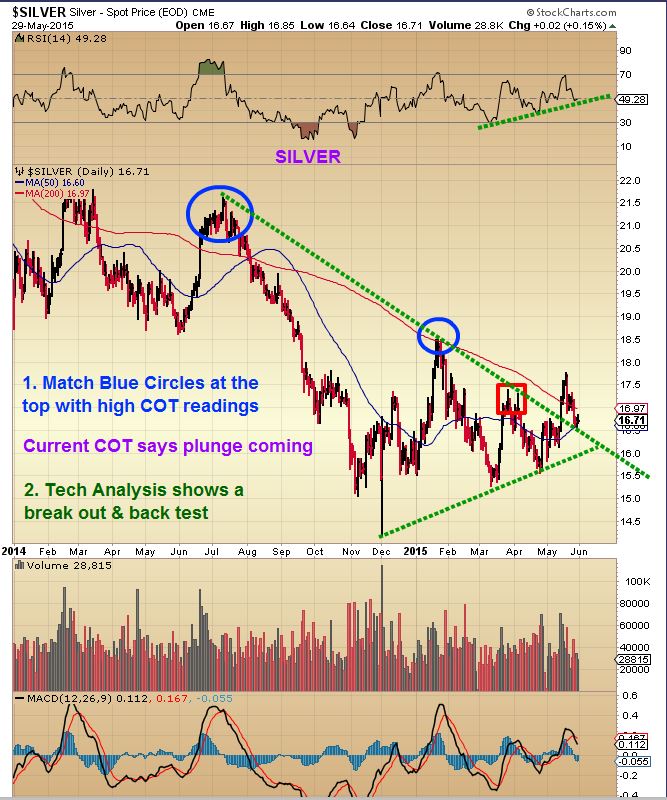
SILVER – The silver chart shows a break out & finally we dropped enough to back test. The Chart “appears” Bullish, still above the 50sma . The Silver COT says CAUTION, as you will see.
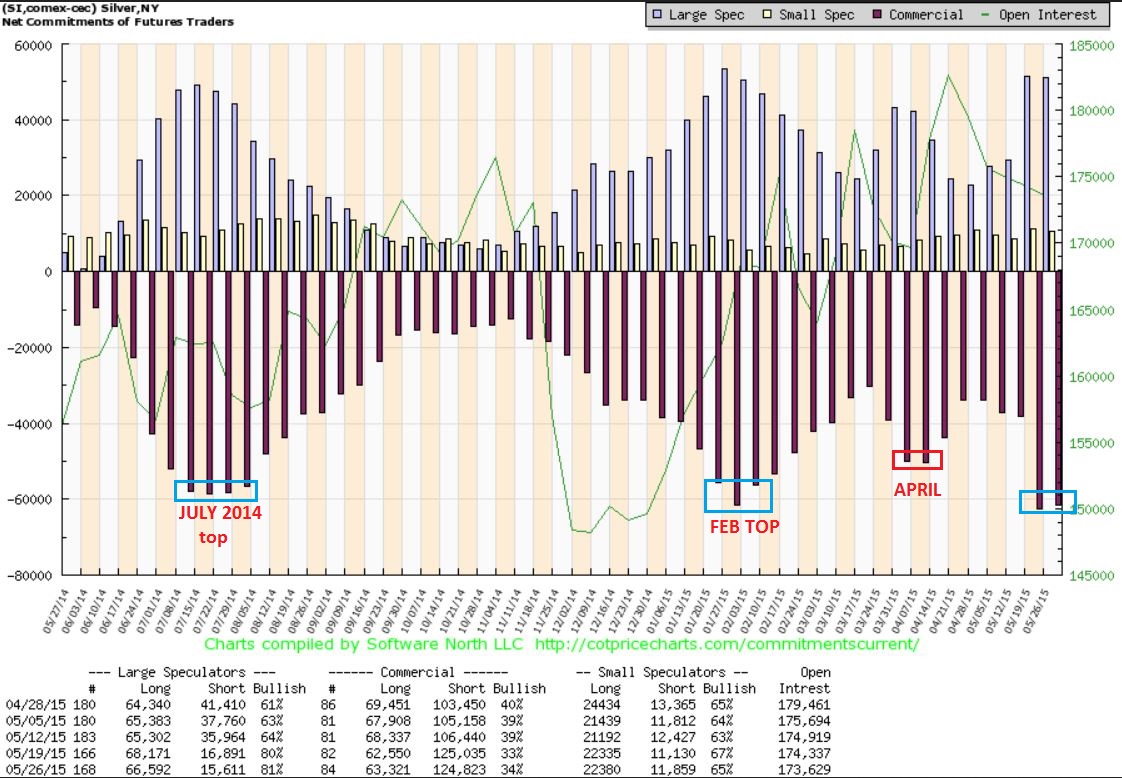
Silver COT
Match the Silver chart above with the COT chart here. Notice where the COT reading was at each top. The current COT reading is where prior tops were. THAT says proceed with caution.
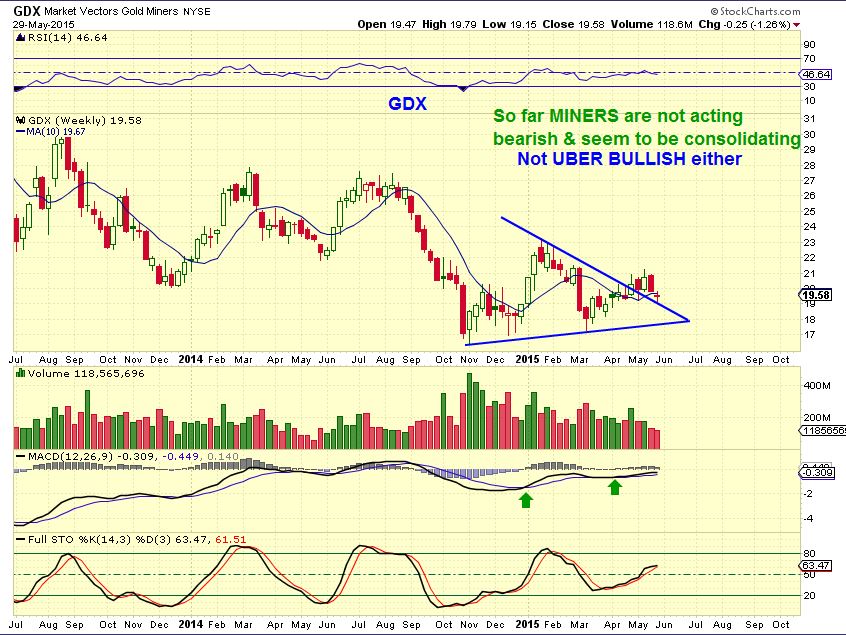
GDX WKLY – The weekly chart looks good actually . A small Reversal here on support, miners hardly moved this week.
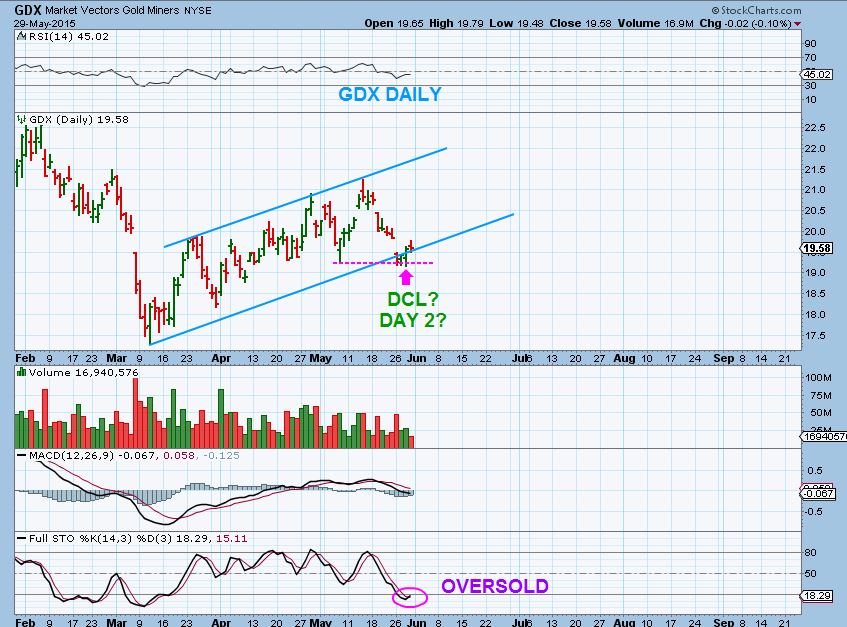
GDX DAILY – Was that a Daily Cycle low on day 14? Early but has been done in the past. Oversold is good, but I dont trust this set up without a solid stop in place.
Conclusion on Miners? I have mentioned individual Miners that look good, but others are “iffy” , so traders will choose their set ups. Others may want to wait for the next real trade-able low. An ICL that will come weeks from now.
LESSON:
I also keep myself open to the possibility that everyone is looking for GOLD $800 to $1000. Sure that can happen, but to me it just seems less likely to happen if every one is expecting that. Again only Time will tell. Also in the comments section a reader said ,
” Since we’ve still had nothing that looks like an 8 year cycle low I’m expecting it to occur later this year or early next.”
I can understand using an 8 yr cycle as a guide. For example: You’d say that we had major lows in the year 2000. 2000 lows +8 yrs = 2008 lows . 2008 lows + 8 yrs = 2016 . I wanted to research those 8 yr cycle lows .
The comment was ‘ Since we’ve seen nothing that looks like an 8 yr cycle low‘. I needed to look at that, it’s important to know if thats true. Here is what I found:
1. An 8 yr cycle low in 1993 bear market looked a lot like now, maybe at the next ICL.
2. The 2000 8 yr cycle low actually came in Early at 6.5 yrs in 1999 , because the 2000 lows were Higher lows. Interesting
3. I’d say that Both the 1999 and 2000 Gold sell off lows also looked very similar to now.And a higher low came next.
4. 2008 8 yr lows were only 7.5 yrs .
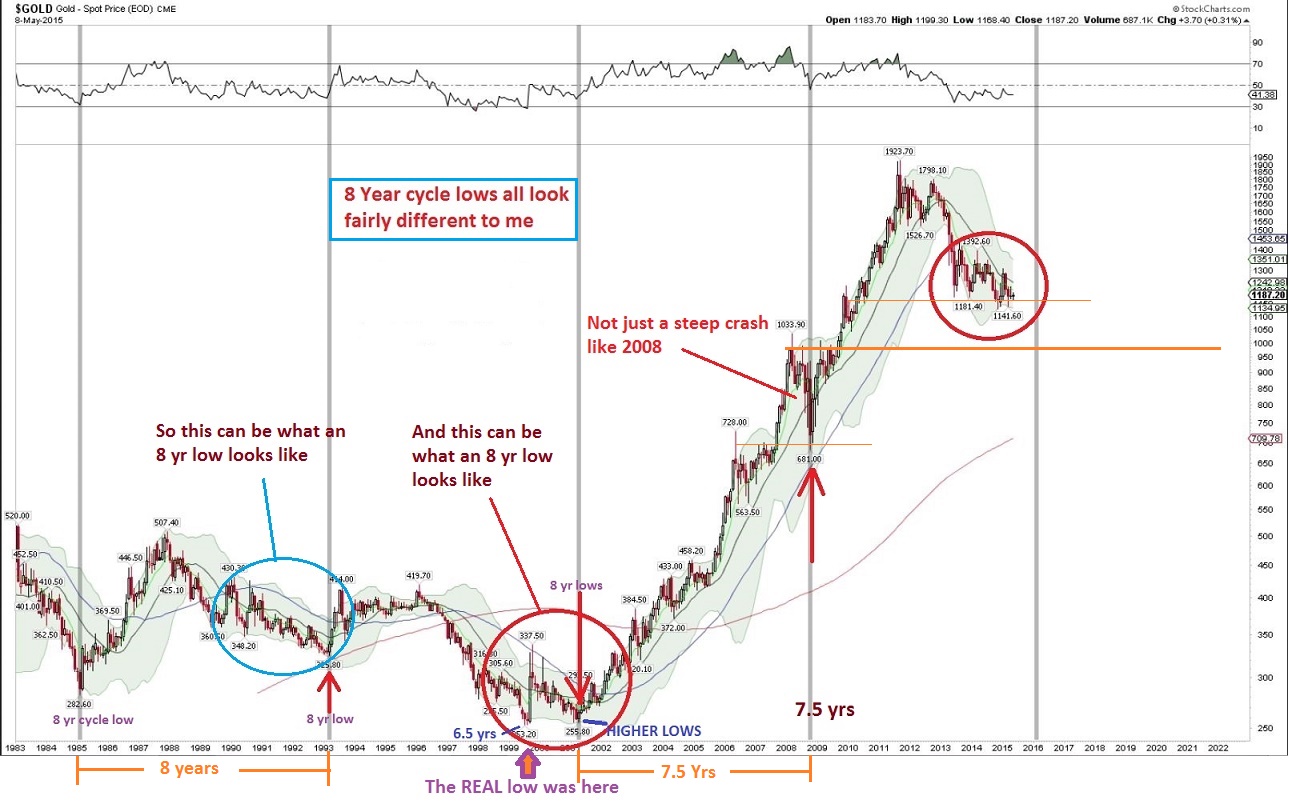
Conclusion: Yes we could always sell off to $1000, but I dont think it has to happen. Yes the 1995 & 2008 8 year cycle lows were STEEEEEEP looking , but that doesnt mean they all have to look like that. They didnt. I would actually LOVE to see a small break of the Nov 2014 lows at the next ICL and have everyone go short for $1000 Gold. Those waiting for “8 yr steep sell off cycle lows to $1000” could be left behind, still anticipating a 2016 final low. In reality, Only Time Will Tell.
.
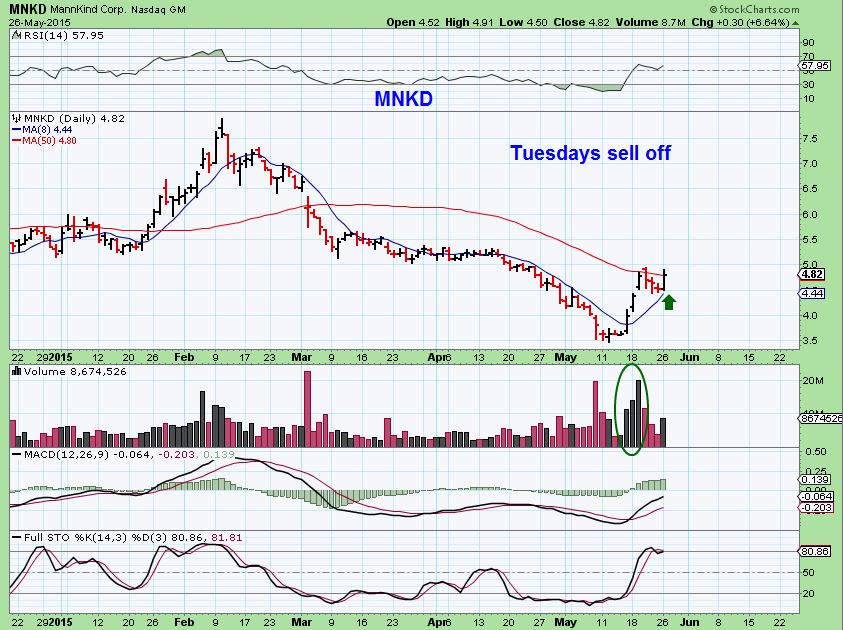
So as for the markets this week, this type of movement in the markets works best for traders and stock pickers. Others may need to wait for a trend to develop. How many times in the past few weeks have seen Rallies sell off and sell offs rally the following day? Many short term ETF trades have worked , but buy & hold is frustrating many. I have seen some GREAT moves in the biotech sector. I’ve mentioned MNKD, ANTH, IDRA, CRMD, AMPH, ATNM, and more ( see below for a few examples). Check those out if you’re looking for charts set up or possibly setting up. OIL / ENERGY may be set up to run higher again now. I like the set ups there , but want to see how the XLE & OIH move this week too. REXX, BAS , KEG look good above their 50sma , but the lag by the energy stocks was not expected by me. NATGAS could possibly reverse this week and we’ll be watching for that. GOLD & MINERS may want to go higher with swings in place, but they are less convincing to me. I am watching individual miners for clues, and cautious with that COT in Silver. Waiting for the next ICL takes patience, but is often far more rewarding that whip saw . Many sectors have jumped up & down and are going sideways, but some individual stock picks / Stock set ups have worked out best. Proceed with caution in what could be unhealthy markets and we’ll see what happens this week in TECH, BIOTECH, OIL & ENERGY, NATGAS, GOLD , SILVER, and MINERS . A lot may depend on the $USD.
~ALEX
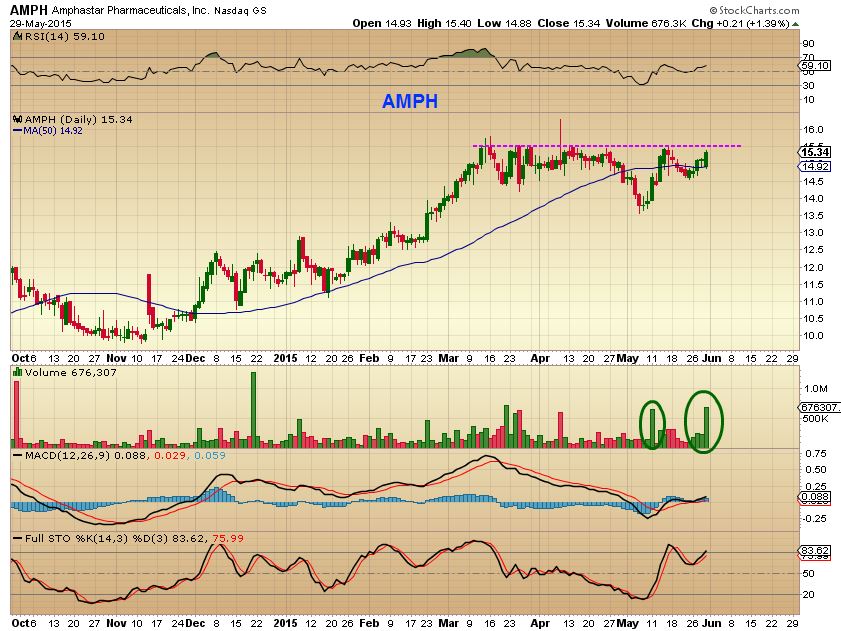
AMPH – example of a Biotech set up
MNKD – posted here May 26
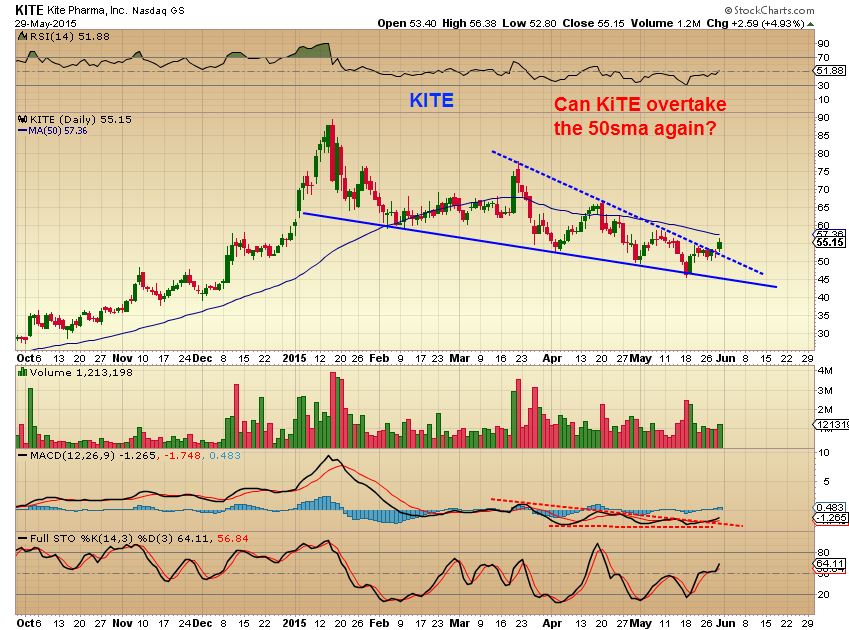
KITE – coming alive?
CBLI- Pop posted here May 26
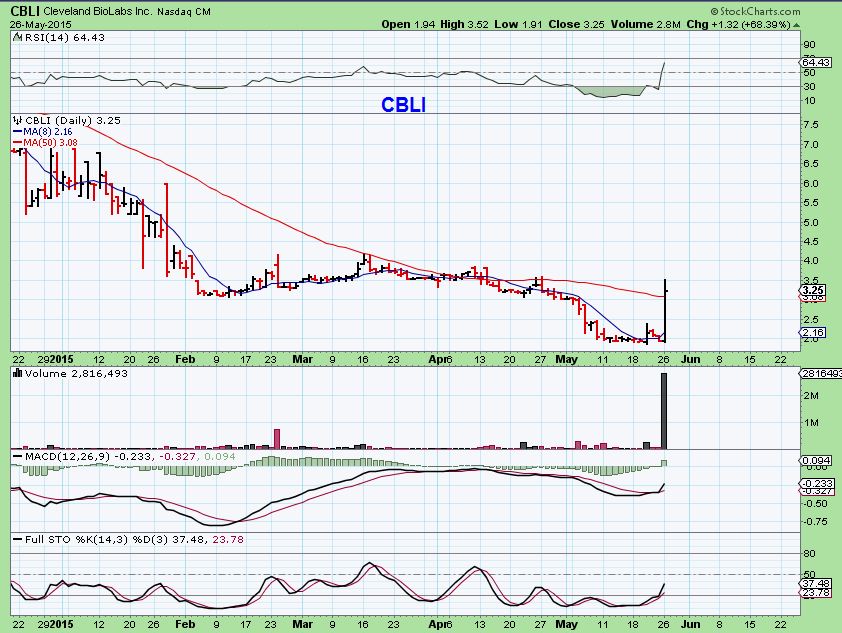
Chart set ups 
 Frustrating
Scroll to top

Just something I’ve noticed. The market seems to have caught on to the gold cycle and it appears to be evolving. What used to be an 18-28 day cycle now appears to be stretching to a 28-40 day cycle, usually with one or two false bottoms to trigger cycle traders stops.
I agree. I used to see shorter cycles in Gold much more often too, like 20-28 days stands out in my mind. You’d get the occasional 14 day too. I see a lot of 34 days and wondered why the change.
I just re-read your comment and interesting that I noticed the same thing with the daily cycle lows. The stops are constantly being run, and even run again , stretching the length of the cycles. It gives a false DCL l, so that these false dcl’s look to have ‘failed’ on the next quick drop, but that becomes the real DCL & the cycle count is updated (If that was understandable)? .
That is partly why I dont feel convinced on the current swing low. It looks like a bear flag in GOLD under the 50sma anyways.
Yes the maket has figured out to run cycle traders stops.
can we assume that is HFTs/Algorithms…?
Unfortunately the futures market in gold is no longer about price discovery. Until the SEC decides to enforce position limits it is now about price setting.
I forgot to put this chart in my report. I was only using it to point out that the DAX was doing pretty good too, until recently. The 2 yr weekly looks pretty dramatic .
Trouble in Europe? Say it isn’t so! 🙂
Regarding the long term cycle in gold, I just don’t think there’s anywhere near enough data points to be significant and give us meaningful information. Sure it gives us an idea that we could be in the wide vicinity of a major low, but the real utility is quite limited. But it’s interesting to look at these things.
Well, something got gold excited!
I’d say the odds of that being a DCL just shot up (pun intended).
mmm hmmmm :o) I like SLV/USLV too…
Well, easy come, easy go! It seems that this market (stocks and gold) will continue to chew people up for a while before making a definitive move.
yup…its nuts…get in/get out ninja style. ;o)
LOL
No kidding. I almost went short when PM gains slid early. Glad I held off.
Thanks Alex. I am as confused as anyone on Gold and Miners. I bought Dust and held through the holiday weekend, made some money and got out. I thought DUST was a double bottom and getting ready to break out. Then last week, GDX looked like a bear flag? But it also was trading in a channel. I bought NUGT last week, I’m ahead so far. Have tight stops at break even now. I like VIX, I may take a try there. Took positions last week in RIG, CLNE & BAS,
Sounds good Bill, I am not so certain about how long this move in GDX will last. If it is going to be Left Translated , it usually peaks early, like 8 days or so. Then DUST may fill the gap at $12 and become a buy. Thats just a guess based on COT and other negative thoughts with metals until the next icl.
GDX just filled the gap, isn’t reacting as strong as GOLD for sure.
Originally I was thinking that the 200sma overhead would be a good sell if it got there ( Buy Dust) but I’m not sure if it can get there unless more volume pours in.
Hello everyone !!! Dust has a gap @ 12.00
Will be filled ???
Doesn’t look like it!
Add me to the confused pile!
I’m a believer in your outlook Alex. Jumped in VXX in pre-market while it was down. Lots of green turned to red in less than 1/2 hour. Going to stick with VXX only till proven wrong, or as insurance.
Yeah, keep an eye on it . I used mental stops and used to trade UVXY , I did ok when a trend somewhat formed because the moves were bigger in one direction, but on bottoms it can get tricky until it really breaks. The chart does look good so far. best wishes.
Yeah, ISM changed things around, for now. Thanks for lookin out for us Alex. I’m holding position for now.
Crazy moves in the dollar this a.m., but didnt hinder Silver so far
IMGN, CTIC, ONTY, OXGN, etc
many BIOTECH are Popping in a big way
ASCO started today, lots of big presentations in oncology pharma space. I think we’ve mentioned CALA some. Broke down hard today with data out; I’d stay away for sure. I know there are a few setups in Bio tech but I’d be careful, it is very binary right now and if you and up on the wrong side… Might be better off with IBB or at least a small basket and check fundamentals and data points first.
Good Morning,
Added OTTR to the Energy basket this morning.
Watching CZZ, APA, AE, ERF.
Never saw OTTR , interesting little base there in the past couple of weeks.
I really want to see some positive reaction to OILs pop, and I ‘m not seeing it much ( XLE OIH) .
I couldn’t be more disappointed, ok now that I’ve said that twice, should be enough emphasis. Could go from plenty of profit 3 weeks ago to stopped out of everything for losses by tomorrow.
cashed out of USO calls last week. looking to rebuy later this week. cashed out of spy calls….looks like a possible repeat of last week to me. could see a low later this week that lasts a couple of weeks . staying away from nat gas until later on. did not catch the gold run but as Alex had suspected it was probably coming…will still wait to play the short side on the next daily cycle top for gold. Thanks for a superb weekend report Alex!
Thank You Shermo – Its been a little tricky with all the false moves and lack of follow through. Nice trade on ur USO
I added on UWTI near today’s lows. I guess we find out tomorrow if that was a good idea or not!
Nice to see UGAZ positive!
GOLD Forecast, my 2 cents? I’m seeing a 2nd bear flag on the XAUUSD chart. Should happen fairly quickly. See lower target below
Really, really discouraging action in energy stocks Fri and today with big rally in oil and then holding on today. Not sure if they are just giving back a little or portending a fake rally in oil, but another day down tomorrow and will likely be stopped out of everything I have in the complex.
Interesting day in gold, I have no idea what to make of it other than glad I didn’t make any moves this morning!
Looking again at REXX chart, looks like 3-wave correction (with equal downdrafts) now at support on lower BB and just above 50 with oil starting next leg up possibly. Looks like great entry point to me (stop below 50).