What’s On The Radar?
If you’ve been reading my posts here for a while, then you know that we caught some large Moves in Miners Dec through Jan rising out of their bases. When that move topped out, we switched to Energy from the end of Jan through Feb. While OIL sold off relentlessly, many of the energy stocks were forming sweet looking bases ( please see prior reports if you are new here. ). With both of those sectors, I have also kept an eye on the SPX, NASDAQ, NATGAS, etc. So what has caught my attention lately?
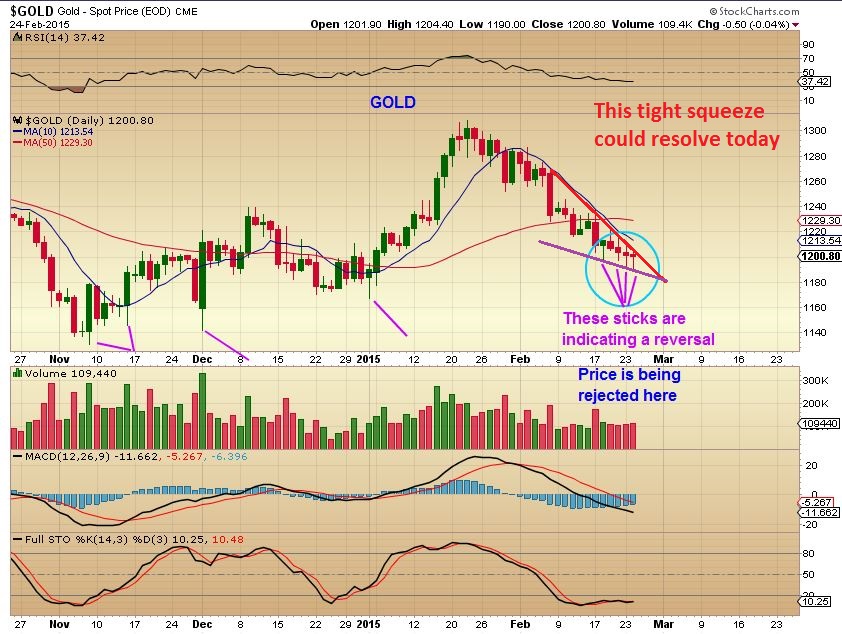
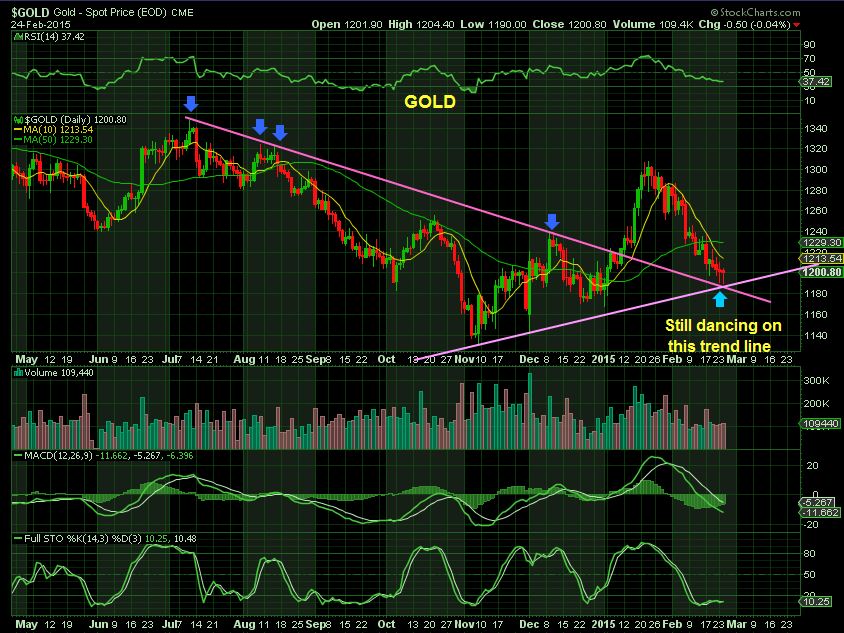
On Feb 24 – I called a likely temporary bottom in Gold using the charts below.
GOLD is in a squeeze with spikes along the bottom. This is a bullish set up
This next chart showed that GOLD was on a supporting trend line…
So a trade was likely presenting itself
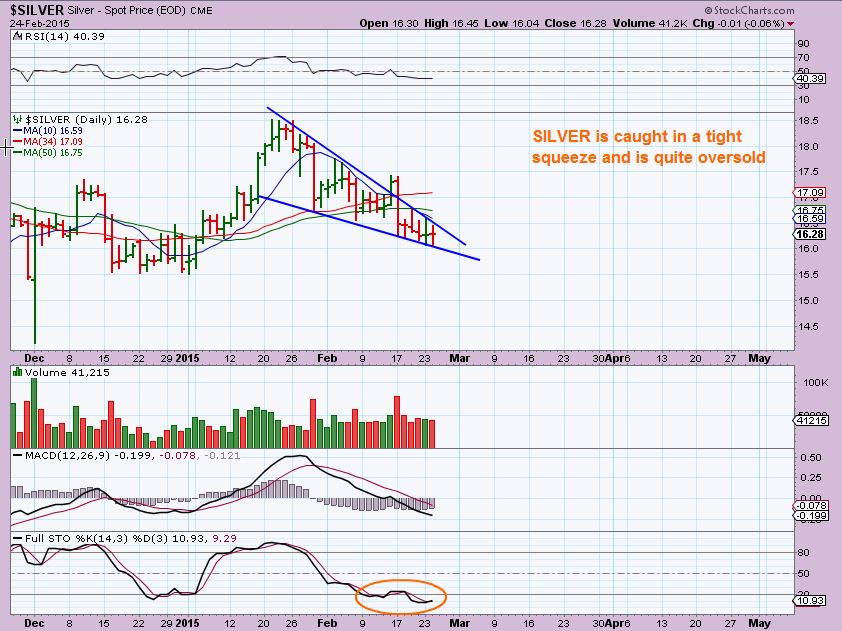
$SILVER was also has a bullish Squeeze
The recent move in Copper caught my eye too
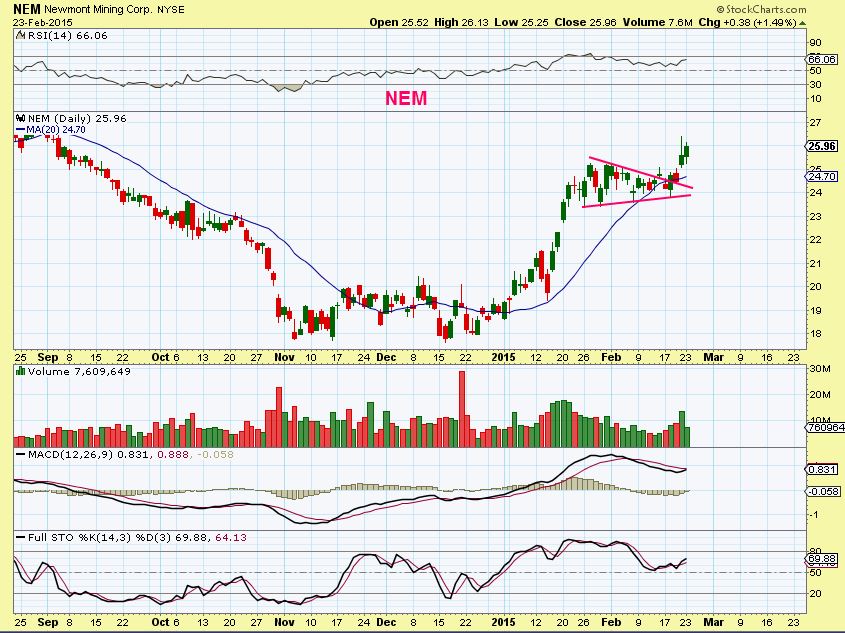
Again back on Feb 24 , I pointed out that some miners like GG, NEM, ABX , etc were actually holding up well during the recent sell off, saying…
” NEM looks like it started a new leg up. GG has only pulled back 50% , a normal bullish re-trace ( so far). “
But is this another great run up like in Dec through Jan? If you know what to look for, there will be signs as to whether it is or whether it will just suck in the longs and turn downward again, like it has so many times before. I have identified these moves accurately in the past, and have prepared the Chartfreak Premium readers for this current move and what to expect going forward.
And the Energy stocks? Did they top out after that last run? Many ran higher and seem to be forming bases again, but these bases can break out higher or crash back down to lows if OIL begins selling off again. Since many think that OIL is still going to the mid 30’s, are these bases trade-able?
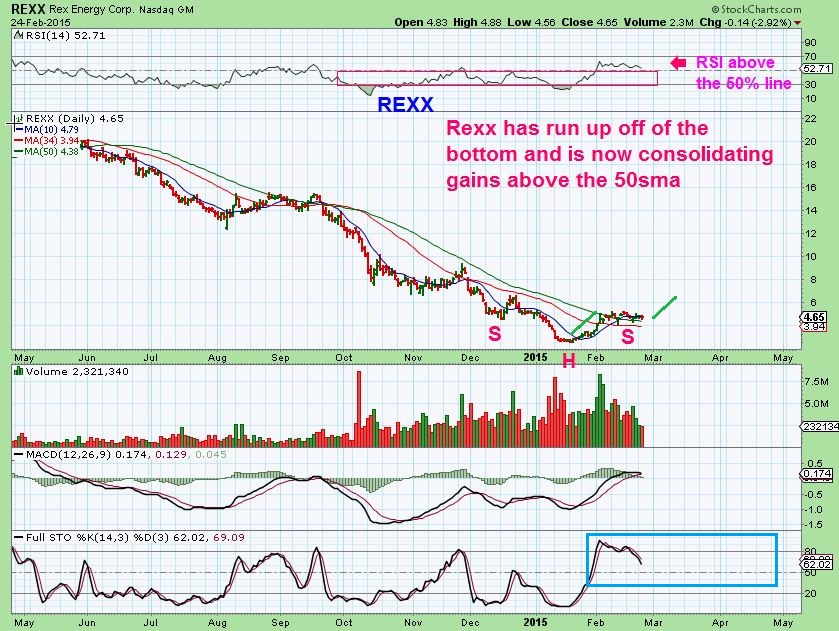
REXX – I pointed to this Inverse H&S set up as of Feb 24. Still going sideways, how can we tell if it is a good entry?
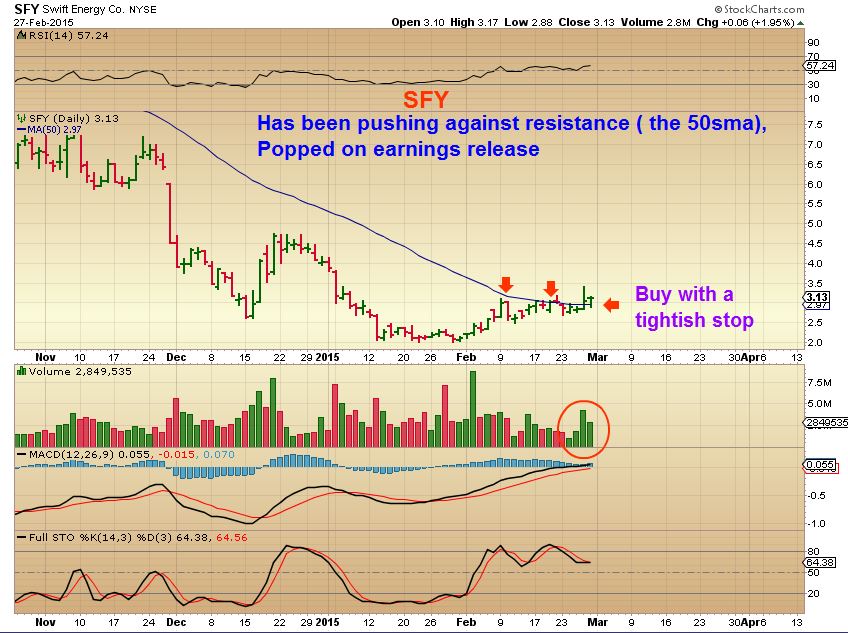
SFY– Earnings already out, no surprises in that area.
1. There are many energy stocks that have developed strong bases, and some we have seen 50% to almost 100% gains off of the lows in 1 month, since they were first mentioned here at the end of January. GDP, EXXI, BAS, REXX are a few good %-Gainers from those lows, others like WRES, NADL, DNR have run up & pulled back. Since “Buys” were called over a month ago, are these going to recover further? Or was that just a dead cat bounce?
2. Is this “Low” in GOLD & MINERS the real deal for another strong leg higher? Could it just roll over after drawing in some long positions?
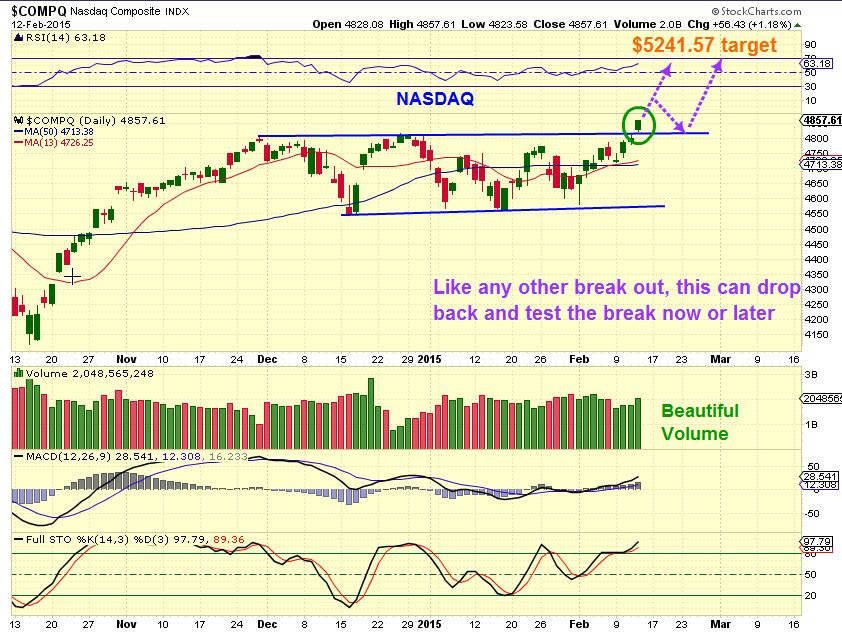
3. What about the Nasdaq? I actually called for 5200 possible target back on Feb 9 after breaking back above the 50sma. This is my NASDAQ FEB 12 chart. I have stated recently that after tagging that 1st target of ‘5000 nice round number’, we may just pullback and test the break out ( or worse)? Today we tagged 5000 .
Here in the premium section of chartfreak, those ideas are currently On The Radar and analyzed regularly. A 1 month trial will get you access to all prior reports and future reports. I posted a 32 chart weekend report yesterday , and usually do Tues, Wed, Thurs (& Fri as needed) with a few special alerts midday too. Thanks for checking out the public side of Chartfreak , and best wishes in your trading !
~ALEX




How do I access your free trial offer?
Hi Troy
Under the “Blog” tab – You are in the section designated as free content. You can see from the reports listed in this section if my style of commentary and charting is something that you think you may benefit from. If you are interested in more from the premium content, its only about $37/month or we have quarterly & yrly discounted pricing.
If that doesnt interest you at this time, this tab has updates about once a week & you can check back from time to time or sign up for our free email alerts to let you know when a report is posted here.
Thanks for checking out chartfreak