
ENERGY (And A Touch Of miners Update)
Just a quick post today to show you what I will be watching at the close on this 1/2 day of trading, and also what to look at Friday morning when the markets resume trading. It is noteworthy that OIL sold off again today and OIL is heading back to its lows. Bear Flag?
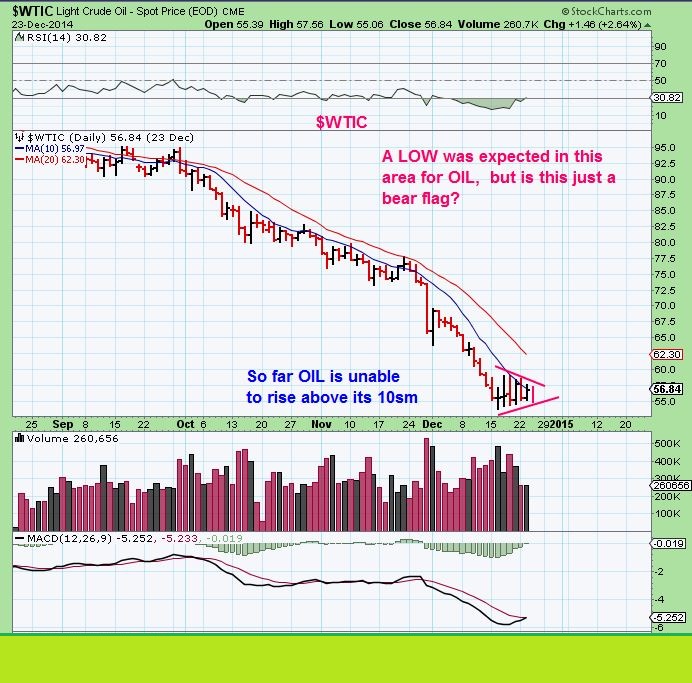
It’s certainly possible that OIL undercuts recent lows. It almost did that today, but notice this …
XLE – The energy sector got sucked down with the OIL sell off, but notice that the XLE is NOT revisiting its lows as Oil drops back down to its lows today .
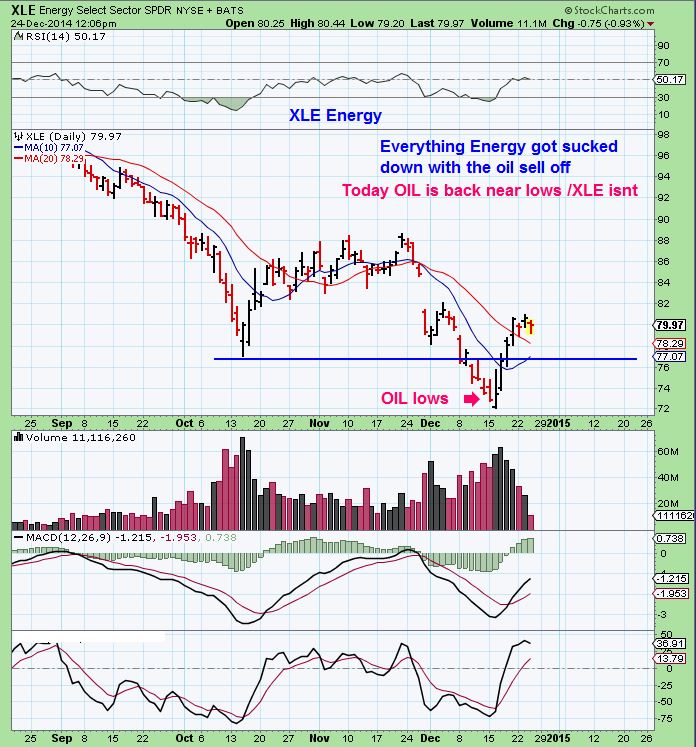
Significant? I think it indicates that OIL may not drop much lower or even if it does, the energy stocks may be in a recovery mode. THIS could lead to buying opportunities on pullbacks in some energy stocks. Lets look at a few Energy stocks mentioned a week ago when Energy was putting in its lows and see how things have unfolded and also see if there might be any interesting set ups.
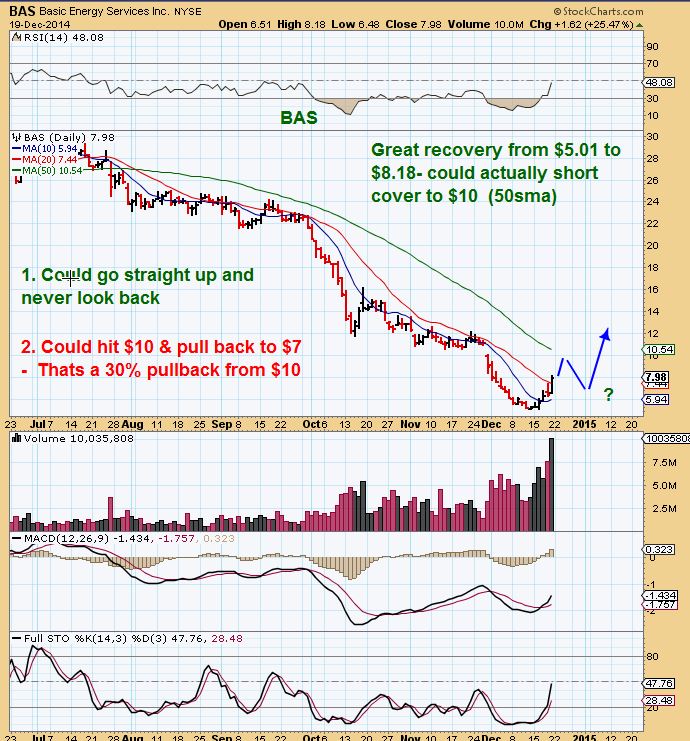
You may recall in my ENERGY report that while Energy stocks were undergoing rapid recovery due to short covering, and I thought that they may run straight up to their 50sma, I said I couldn’t recommend buying them at that point, because they also could pullback. We should wait until they pullback first and see if they put in a higher low. Some did run to the 50sma, others already started a nice slow even pullback.
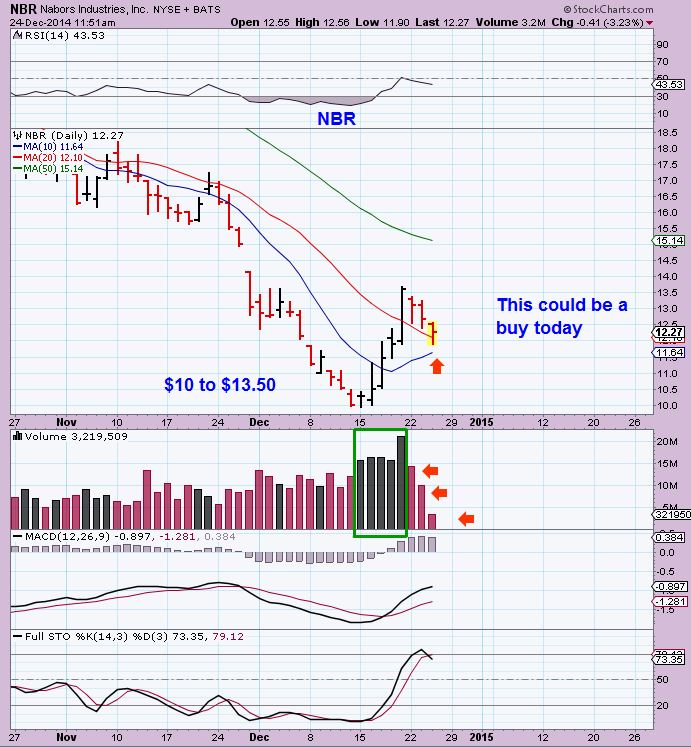
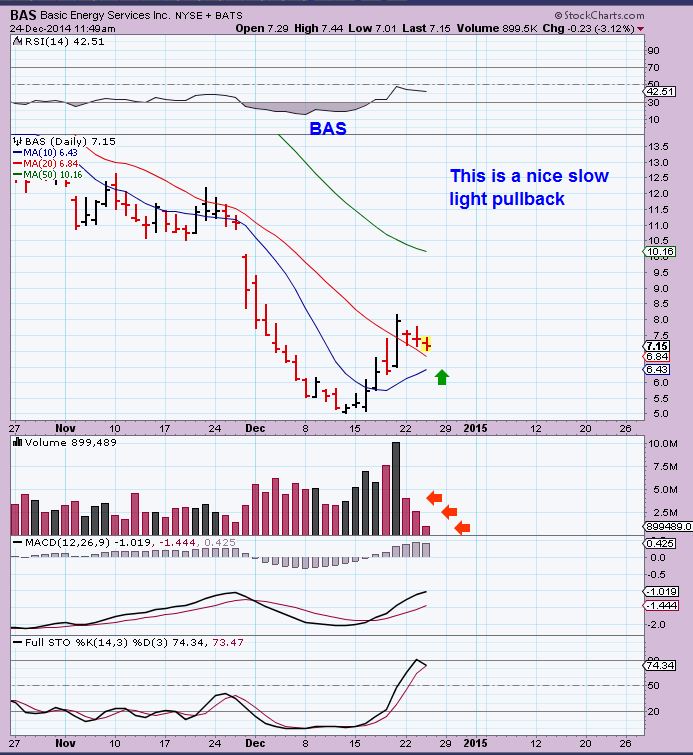
I’m showing these as possible BUY points Friday or Monday above their 10 & 20sma. The pullbacks seem to be light, even with OIL back at lows.
NBR ( Then & NOW – next leg up could run to the 50sma)
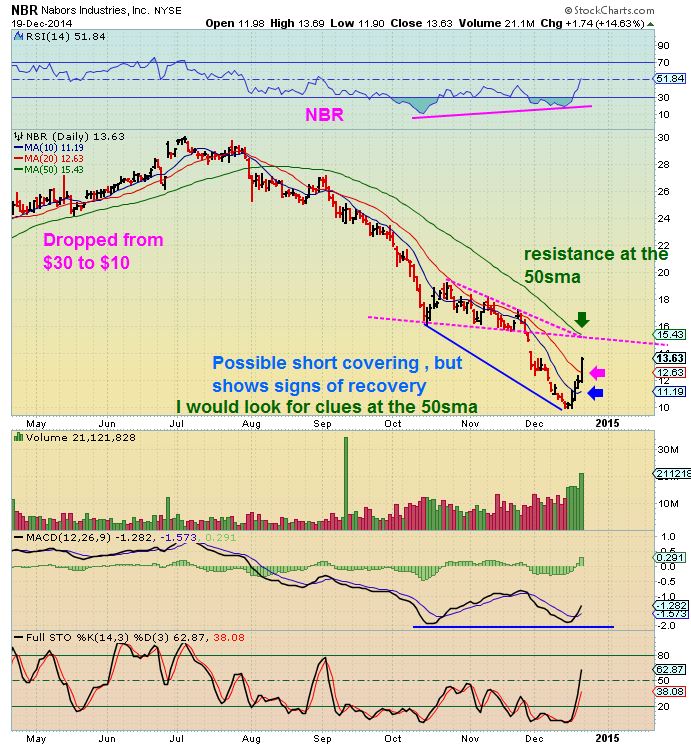
NBR – Dropping back light volume
BAS ( Then & now, also began pulling back after I wrote, next leg up could go to the 50sma )
To show the potential on the beat up energy stocks, remember TPLM- popped off of $3 ?
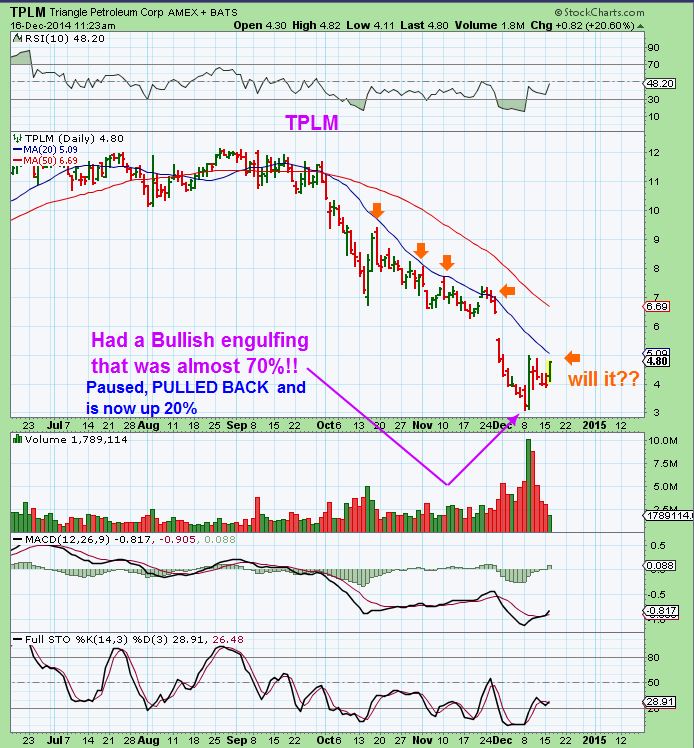
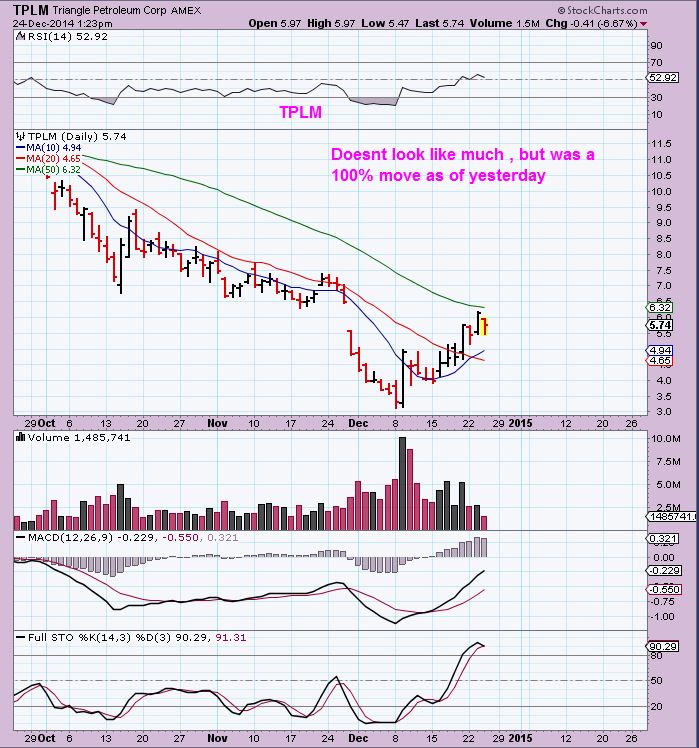
TPLM Now – Kept going to the 50sma , up 100% yesterday ( $3-$6) Pullback to $5 ish?
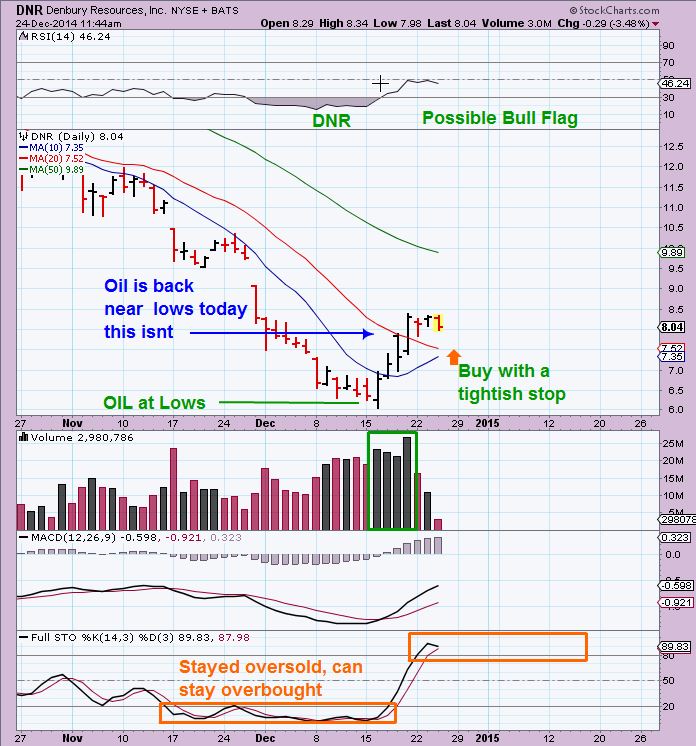
I LIKE DNR
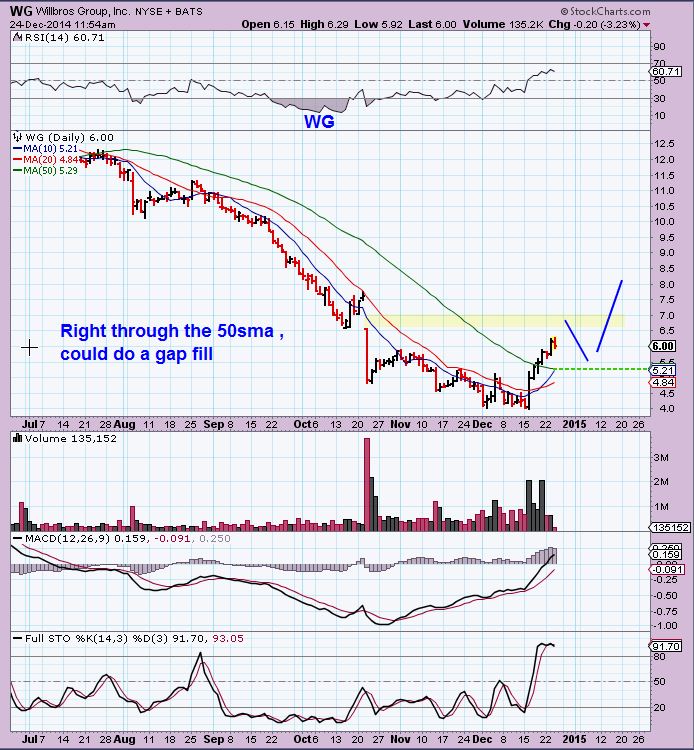
WG This one was a break out buy actually
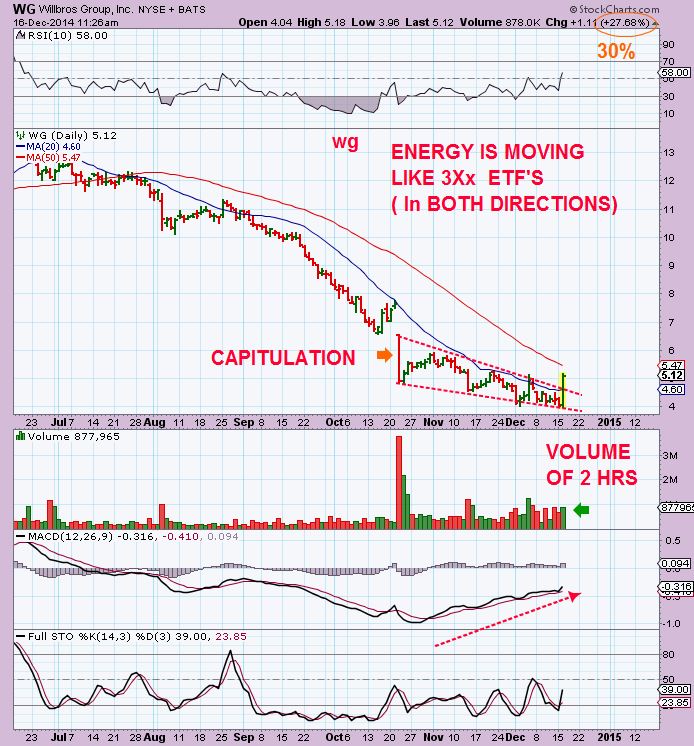
WG – is one of the ones that hasnt turned back ( Even at the 50sma). It may fill that gap & then drop to the 50sma
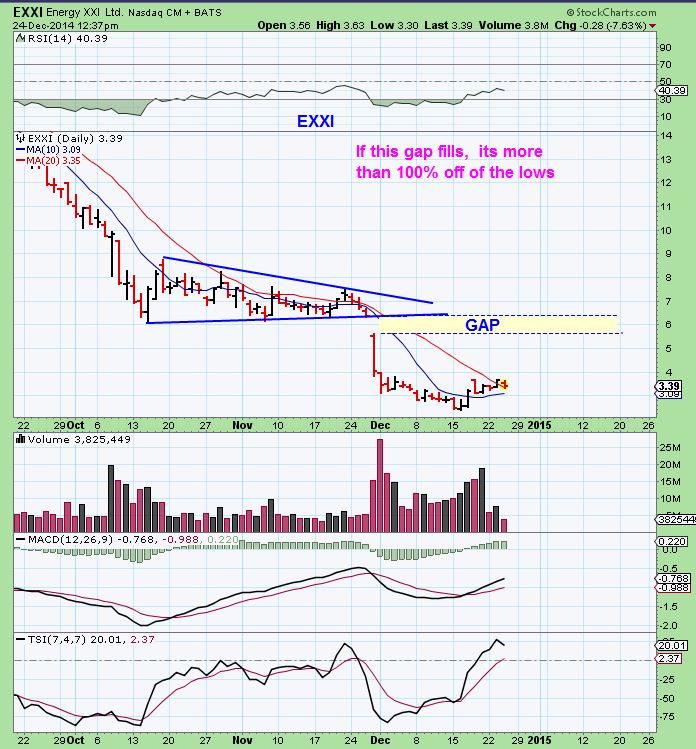
EXXI (Then & Now)
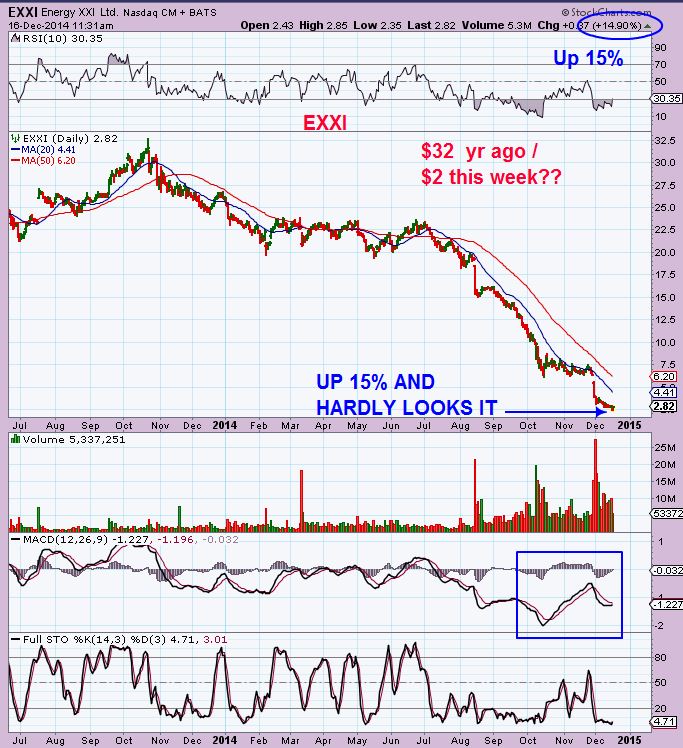
EXXI now – Popped & went sideways , so it Hasnt moved a whole lot – Just above the 10 & 20 sma . Could be bought on a dip to the 10sma with a stop below the Moving averages . It hasnt been as strong as others yet.
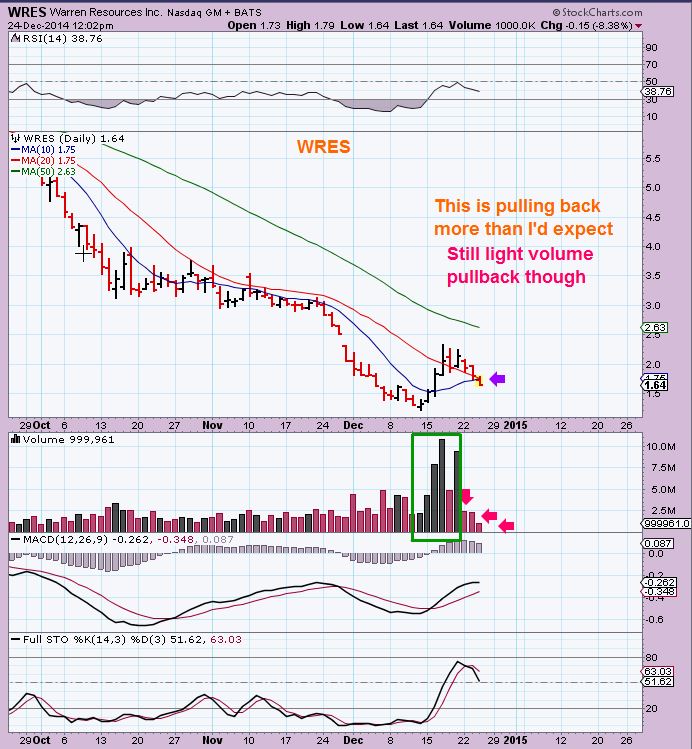
Now I want to show something else. I am currently looking at a Bull Flag in SFY – ( Above I showed NBR and BAS with bull flags too) They could break higher, some others have as shown- but I also was watching a Bull flag in WRES and it has dipped UNDER THE MOVING AVERAGES. Let me show you WRES
WRES –
This is here as a learning lesson.
This broke down more from the bull flag type set up. It can happen. WRES may double bottom or just put in a higher low . I dont own, but would have had to stop myself out here, and accept small losses , rather than risk that it is weak for a reason unknown & could break down below prior lows. I’ll be watching this one .
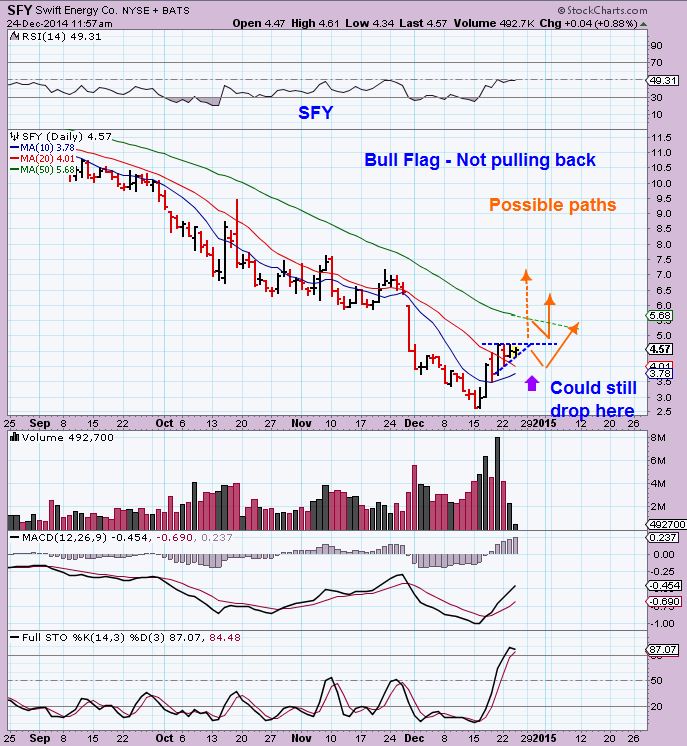
SO I spoke of SFY above and the possible Bull Flag . Here it is ( And again, like WRES, they can break down too)
SFY – Bounced strongly off of the bottom DEC 16 ( THEN & NOW)
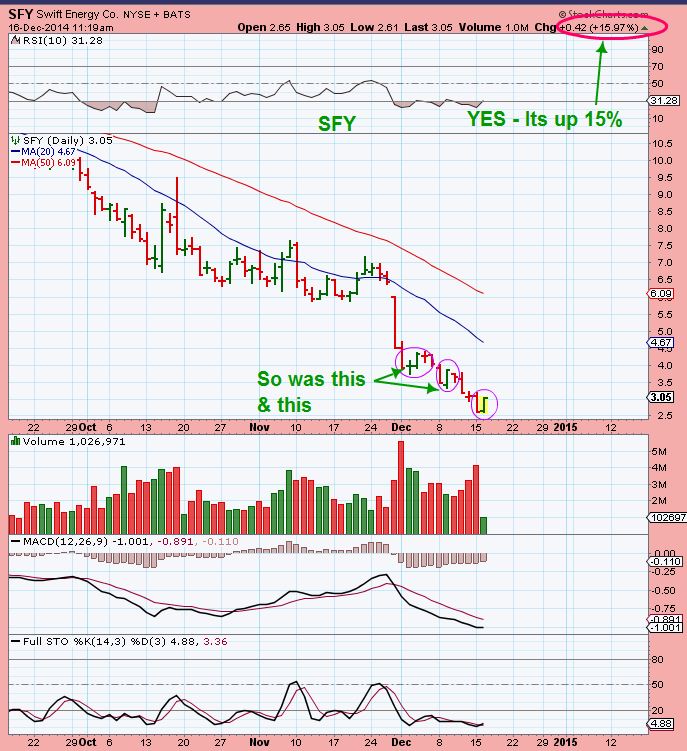
SFY ( break down? Break out? Tag the 50sma and dip? Break through? Toufh call but it has already almost gone up 100% on just this small pop off of lows).
SO I wanted to share that outlook with you , because SOME energy stocks have Popped up 100% off thier lows. As oil is at lows, these are holding up. It indicates that likely they all got caught up in OILS slide, but now they dont belong down here. Some have great upside potential if the energy recovery continues.
SO did I throw in the towel on Metals and miners? No- We just didnt see anything different from what we have seen lately . GOLD was down at recent lows today and Miners took off upside again. They are being held down at their 10 sma. See if they remain under that Friday . As mentioned by me in prior reports, CDE, HL, AG, are good looking stocks here, and it makes me wonder if they started their 2nd leg up already. They look good and some of these Miners are well off of Nov lows.
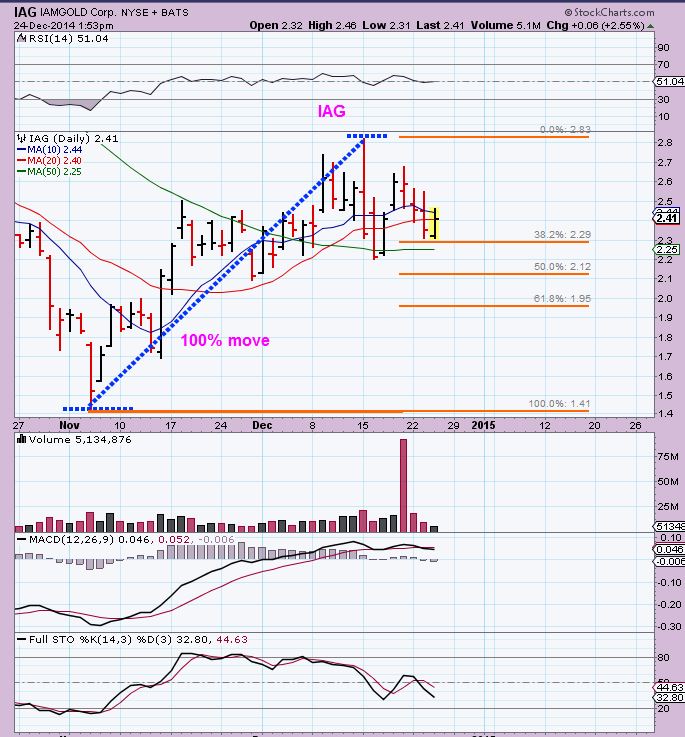
See GFI, HMY, NGD, IAG, EGO, CDE, HL, AG, etc etc Good looking charts from Nov lows to now.
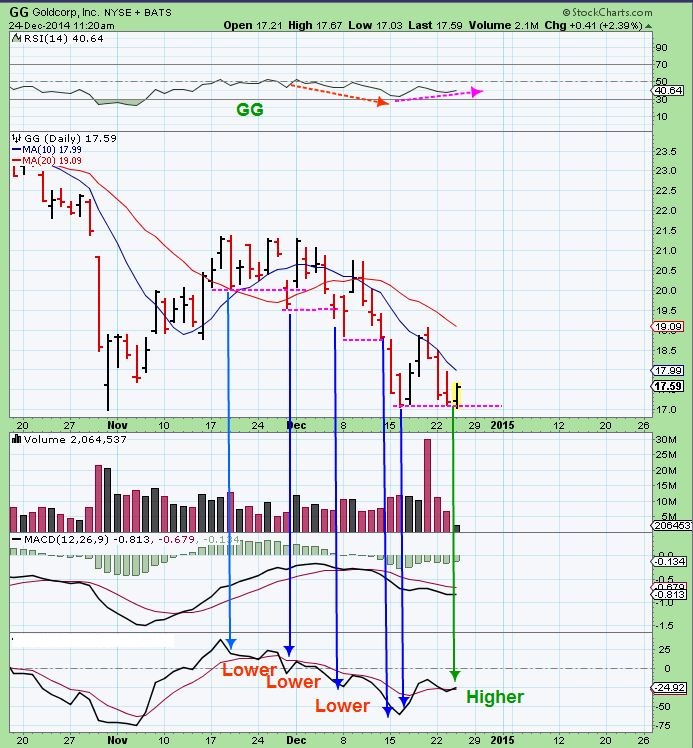
We are still waiting for this recent low to prove itself as the start of the 2nd Daily Cycle in Miners or not, but I looked at a few individual stocks and they show signs of hidden strength. Let me show you GG for example, since it is back by Nov lows and makes up a large part of GDX .
GG- I see hidden strength inside that last dip.
Each dip down to a new low caused a lower low in the bottom indicator UNTIL the last dip, which produced a higher low on the indicator.
Looking back to NOV lows, GG is close to that low now, but that indicator shows strength at these lows too.
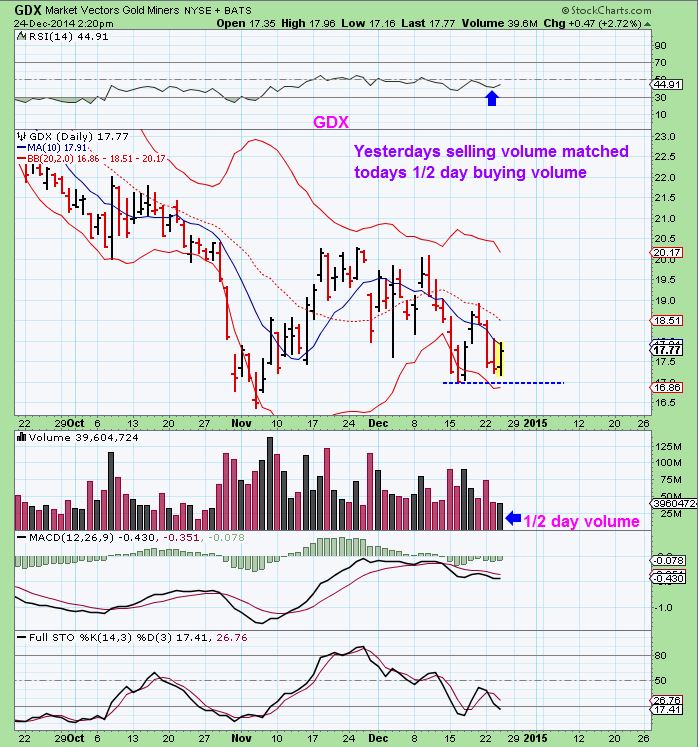
SO until this ‘GOLD / MINERS daily cycle low’ plays out to the very end – I have to say that it is Still Not Broken. Today we again saw Miners going up while Gold is at recent lows. I DO NOT recommend anyone who was stopped out to jump back in Friday, even if the GDX breaks above the 10sma. Wait for further confirmation to satisfy your own concerns (Above the 20sma breaks an overhead downtrend line) . Personally I see some Miners showing nice strength as mentioned above and today ….take a look at GORO , SAND , GFI ,and HMY .
Todays 1/2 day volume up in GDX / GDXJ matched yesterdays total full day volume down . Interesting.
Friday I will not be posting a report before the market because what I would say then can be found here, and then after Friday I can look back and do a weekend report. Many have the week off or at least the next 4 days off , maybe you can re-read some of the last few reports and see some reminders of what I am watching for on Miners and Metals. I DID think day 28 was the start of the 2nd daily cycle in Miners, That is still holding. GOLD does not appear to have put in its lows yet (Unless the lows from DEC 22 are those lows) . I know many are traveling , visiting family, etc over the holidays , so I please be safe and enjoy your family time – the most precious time you can spend is time with loved ones in my opinion, some of the best memories I have begin & end there. I will have a wkend report Sunday night or Monday morning.


ALEX, if gold has put the lows today it may be the case for a small day reversal for the swing low on friday. it is almost like the miners put the lows in last week and revisited it this week and if/when gold reverses, it will be ignition time for many pm stocks.
Marino
I am thinking along the same lines as you with one exception. I was actually looking for a small day today with a break to new lows to become the swing Friday. We needed new lows though, to put that swing in. At this point, we have to wait for a move above the Monday highs to get a swing in Gold, because Monday was the low. Or a new slight low Friday and a move above next Monday. I would have loved a small day with new lows yesterday or today.
As you know I am in the UK, I received the email trigger at 1935, we are 5 hours ahead of you. That is 2 hours after US markets close.
I am unconvinced that you seem to be looking for buy entry points in oil stocks. If you do a simple XLE:$WTIC chart (I would post it if I knew how to!) you will see that XLE is currently priced as though WTIC was at least $75 i.e. 40% ahead of current price. The trajectory of the comparative chart since mid October has truly been parabolic.
A lot of people think $WTIC is just waiting for OPEC to give in and cut production. This isn’t going to happen. Easy to see this if you put yourself in the position of an OPEC first minister. Why cut production and let the newcomer high cost producers scoop your pool? Better to hang on and solve the over supply problem by forcing them out of business.
So, I see current strength of oil stocks as a triumph of hope over experience – look at what happened to oil stocks from late Oct to mid Dec. The odds have to be in a normalisation primarily by oil stocks falling.
Sorry to say that I see gold stocks as behaving similarly. I cannot see how anybody can see the set up in gold as being bullish. But yesterday and today gold miners seemed to want to see it so. Yesterday, they rose 5% in the morning before thinking better of it. Today, not learning from experience, they did a reprise in the morning. They seem only to have been saved from the same fate in the afternoon by the early close. If anything, IMO, the short term outlook for gold has worsened in the last 2 days by 1) repeated failures at $1180 and 2) flat stock market, should have helped gold and did not
Again, as you know, I am looking for a new bull market in gold/miners but we all have to treat the market as it is, not how we wish it were.
Happy Christmas.
Hi Castelmere ( I know your real name, just keeping it private) ; )
I hope I wasn’t misunderstand – My report was started before Noon my time ( see the time stamp on the charts) , but to gather all the charts & draw them up and write & explain what interests me – takes a lot of time. My reports usually take at least 4 hrs of work. I didnt plan on releasing it before the markets closed, instead I meant to state that ” this is what I am looking for at the close today and the start of Friday.”
I actually dont know a lot of people who think OPEC will cut. What you wrote is what I have been observing. Its becoming a crowded supply zone, maybe they can beat the competition & put them out of business. They get their oil production at very low cost and they didnt cut production when others thought they would ( I thought they would in Nov). I think they made that clear. As for XLE:WTIC – yes, its a rally because OIL dropped so far so fast, XLE recovering while OIL is still at lows. but What if OIL isnt a bear f;ag? If OIL starts running back to $70 – $80 the way XLE ran up? The energy stocks can continue to recover too… The energy stocks look good – the set ups look fine at this point, so that is ONE thing that I will be watching Friday (Dont take position if you feel risk is higher than reward.)
As for GOLD/MINERS ….time will tell, but as a technical analyst, I shared a few charts that ARE BULLISH. Did you see HL, CDE, GFI, HMY , etc. not bearish. If you are contemplating a big sell off and are thinking of going short, I would NOT short until it breaks down clearly. You may be surprised $GDX : $GOLD looks like it may have double bottomed and divergence would have it possibly ready to break higher. Different eyes see different things : )
Wishing you the best !
Alex, good response, if you look at an even longer-term chart of GDX:$GOLD you can see this about as out of whack as this ratio has been meaning that if it were to ever snap back to normal correlation, it could be huge. If (instead of gold free falling to make ratio go up). Good advice on when to get back in from today – appreciate that. Afraid to jump in until it shows us something, but by then you could miss the move so this could be tough – you get confirmation when it’s too late sometimes. If you bought at the 50-day SMA for GDX in daily cycle1 you would have only owned it for a few minutes…
Merry Christmas and happy trading.
Hi
Alex,
And
thanks for your lengthy reply, especially considering the time at which you
sent it!
Re
XLE – my point is that the stocks have already discounted too much by way of an
increase in price of oil. Current relative level has increased by 40% in the
last two months and is double what it was two years ago when oil was $100.
Re
Gold stocks, I agree that there are some names with good looking charts,
including the ones you mention. I just think maybe they have run too far ahead
of their sector and that a reversal in gold is needed if they are to keep
running.
Though
gold is looking a lot better this morning – the way it has cleared $1180
without a backward glance and on good volume is bullish.
To CARLNETSCOUTS
The end of year tax loss selling does go to DEC 31’st , HOWEVER YOU CANNOT REPURCHASE WHAT YOU SOLD until after 1 month or they do not allow you to claim the loss.
Alex,
has gold formed a swing low? miners are responding ok, even though i was hoping for more strength. Decision moment if we can get over resistance at 19sh
Hi Marinnho
Close, but not technically. Gold has broken the trendline above, which usually indicates a Daily cycle has been born, but because that Long candle on Dec 22 was the low, Gold has to travel above that candle to put in an actual swing. I think that was $1203.60 high that day. If it does that on Monday, That would indicate that the low was DEC 22 and put Gold on day 4 Monday.
It “feels” like Miners hit resistance at the 20sma, and light volume couldnt push it through. They could close the gaps into the close today or Monday & try to break higher next week. Tough call right now.
thanks Alex,
i decided to put in money at GDX 17.30 a couple of days ago since the stop is very close at 16.95-17, I will wait for developments next week but in terms of elliott waves, this could be a minor 3 of 5 after the 2 days of wave 1 and the other 3 days of wave 2 bringing it to wednesday beginning of wave 3?
Thanks for all Alex, best wishes into new year.
I regularly smile when you suggest you can get such reports out in 4 hrs., as these presentations look like 24/7 to me and can absorb up to a full hour of mine just ‘to assimilate’ !
You’re right Beek, they’re like snowflakes….they accumulate over time ; ) Thx & best to you too!