You are here: Home1 / Exclusive Strategies
Thursday - 2 trading days left in the week. Again we have had another great week of trading, but how long will this last? Should I sell my positions? Lets do a quick market review and then discuss positions.
.
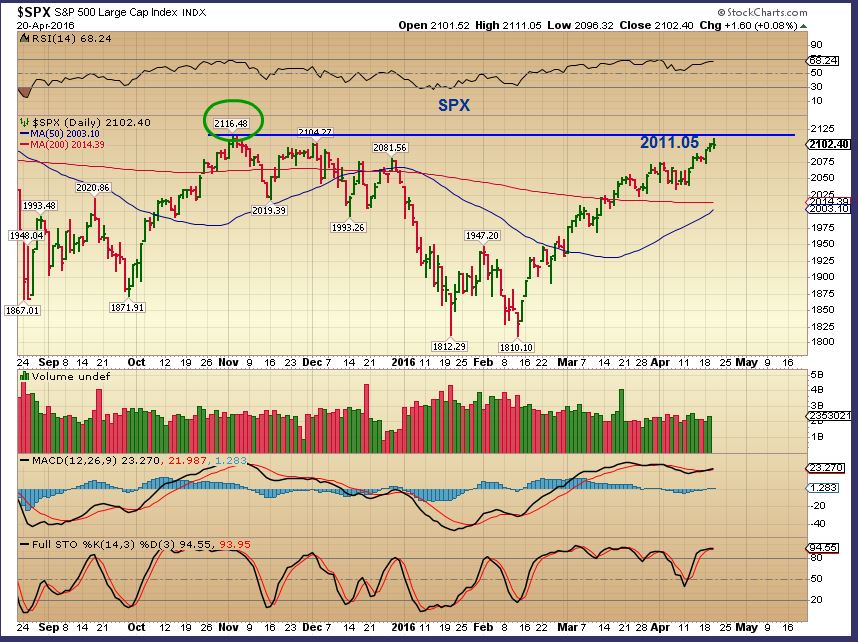
SPX - April 18 had the markets Bullishly moving higher.
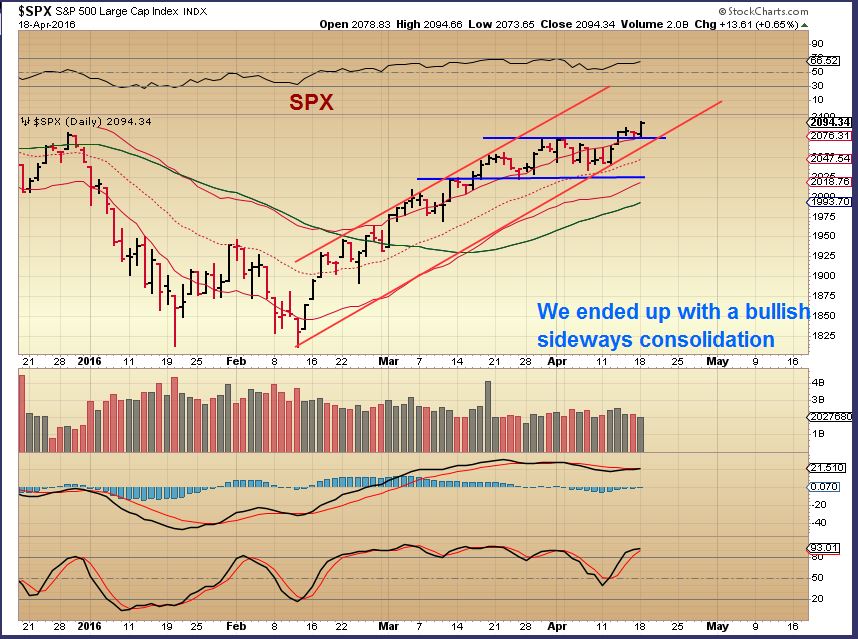
SPX April 20 - The SPX is almost at the November highs and remains bullishly aligned. This may be an area that gives resistance, or the shorts may pile in and be forced to cover if it breaks to new highs.
 Read More
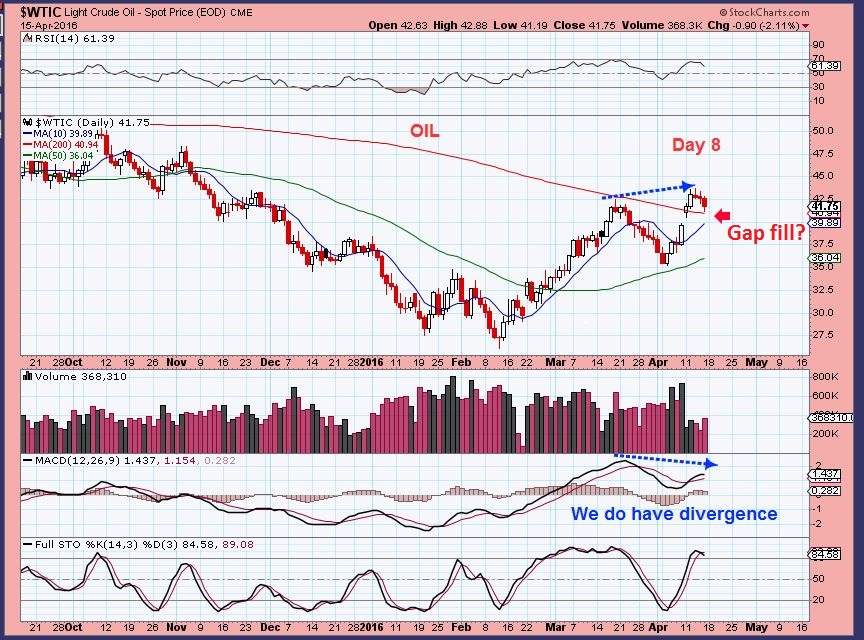
It's all a matter of perspective. If you fell asleep Sunday night and didn't wake up until after the market closed on Monday, you may have thought that not a lot had happened. If, however, you read my report Monday morning , you saw that Oil had dropped 4% overnight. CNBC and many other sources of information where lit up. Was 'Oil dropping to the 20's again'? Was it 'a great time to go short'? No, Cycle timing and the charts were pointing to possibly just a small pull back. We are invested in Oil & Energy, so this was important. This was our Oil chart in the report.
.
WTIC - Oil was early in the 2nd daily cycle, and the first one was R.T., so I expected more than just a day 6th high in this run. Maybe we would get a gap fill?
WTIC MONDAY - Many ( Not here at Chartfreak) likely jumped in on the short side pre-market, but the shorts got overwhelmed. This reversal did fill the gap and it did something else too...
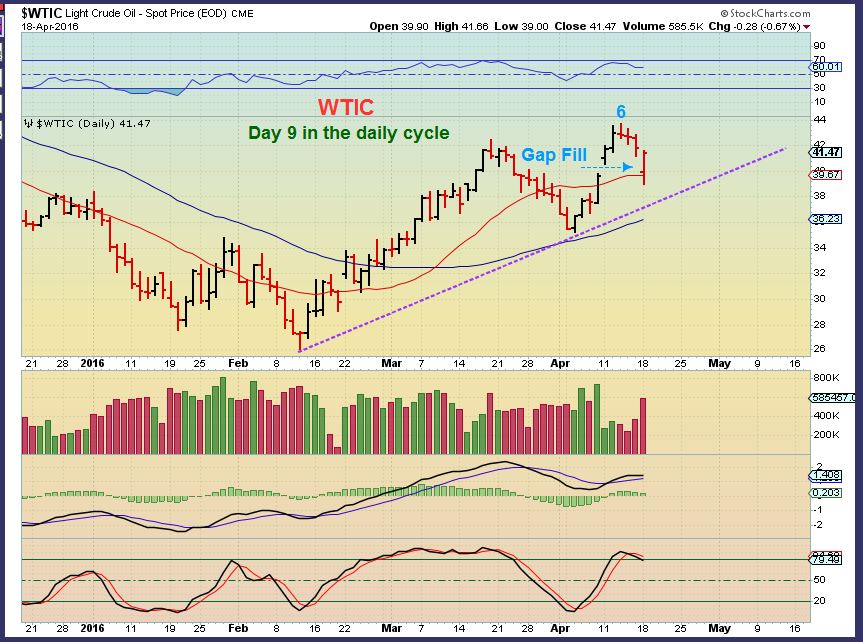
Notice this important observation
Read More
Scroll to top

 Read More