You are here: Home1 / Exclusive Strategies
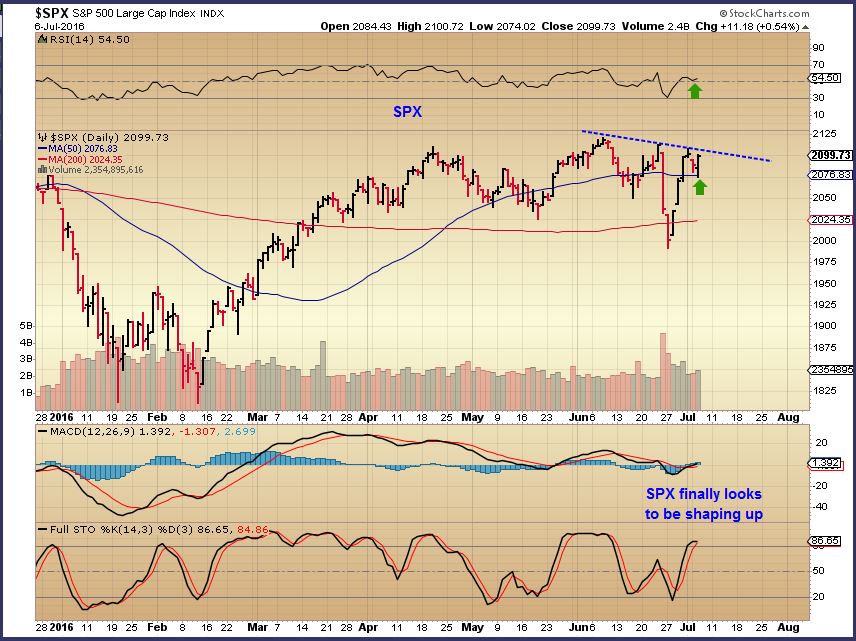
The general markets ( And even $BKX) showed improvement after opening lower Wednesday. The release of Fed Minutes today was a non-event for the most part.
 Read More
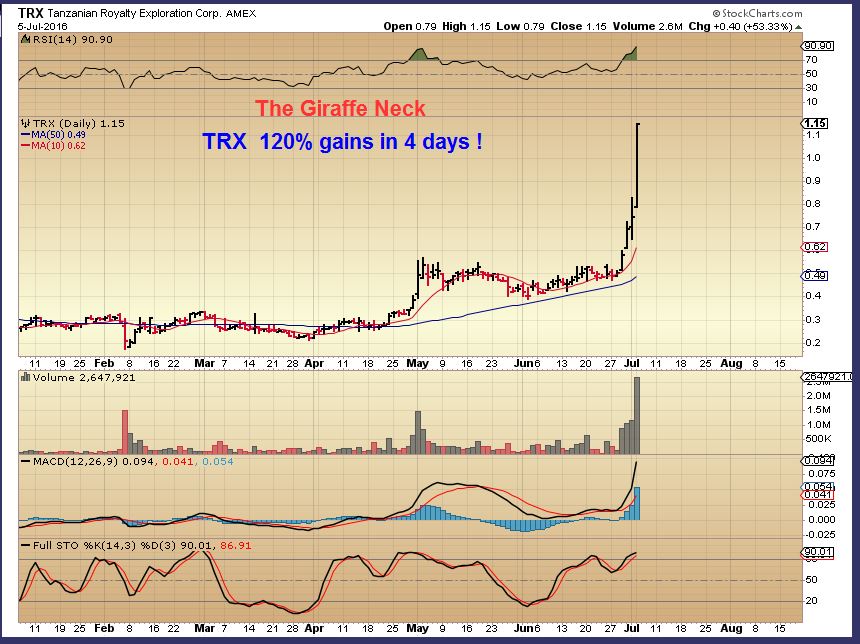
 We do! 120% in 4 days.

And though they are rarely seen on a regular basis in the markets, we have been spotting them left and right , even before the raise their heads to look around.
Read MoreThe past few weeks have seen huge gains %-wise in the Chartfreak Gold & Silver Miner picks. I've been reading that other letters have avoided the sector due to the C.O.T. What a shame, we discussed the C.O.T. here too, but didn't accept it as utterly bearish. I'll discuss that again this week. Lets start with a look at a couple of the recent explosive moves in Miners for example.
.
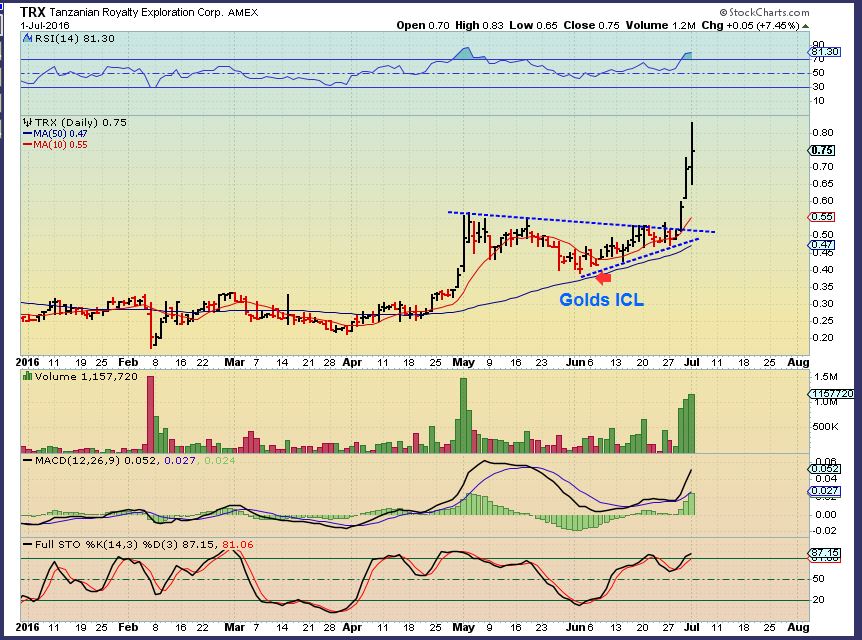
TRX- I bought and have been discussing the bullishness in TRX for weeks. I will discuss it further later in the report, since it has broken out with a bullish surge higher.

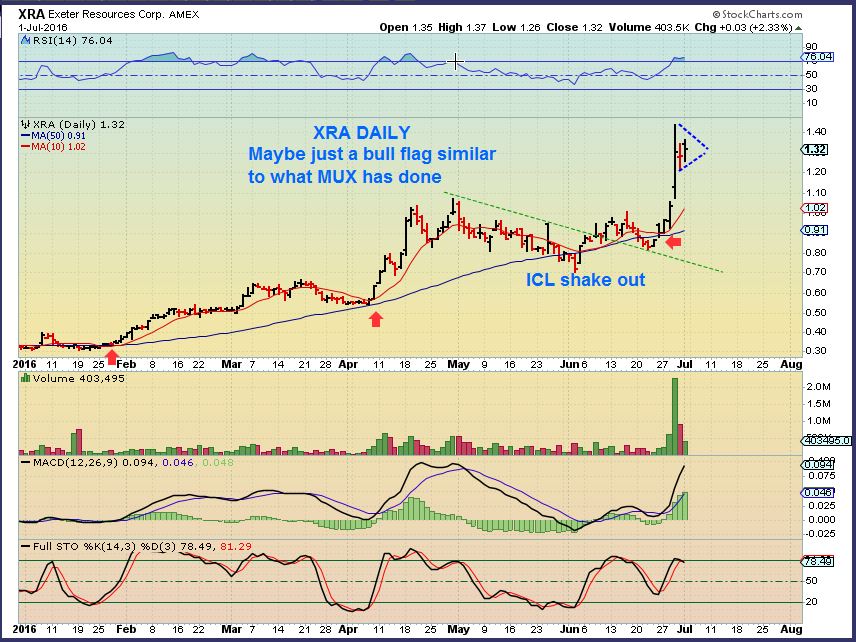
XRA - This also burst higher after a 2+ month consolidation of prior gains.

AUMN, VGZ, MUX, TGD, and many others mentioned in the reports over the past few weeks are surging higher. AUMN gained 50+ %last week alone.
After a market review, I'll discuss what I think will be the next opportunities in this sector, and what to look for in Gold, Silver , and Miners going forward.
Read More
Scroll to top
 Read More


