You are here: Home1 / Exclusive Strategies
I hope everyone is enjoying a nice relaxing weekend, lets review the markets and discuss our expectations for the coming week.
.
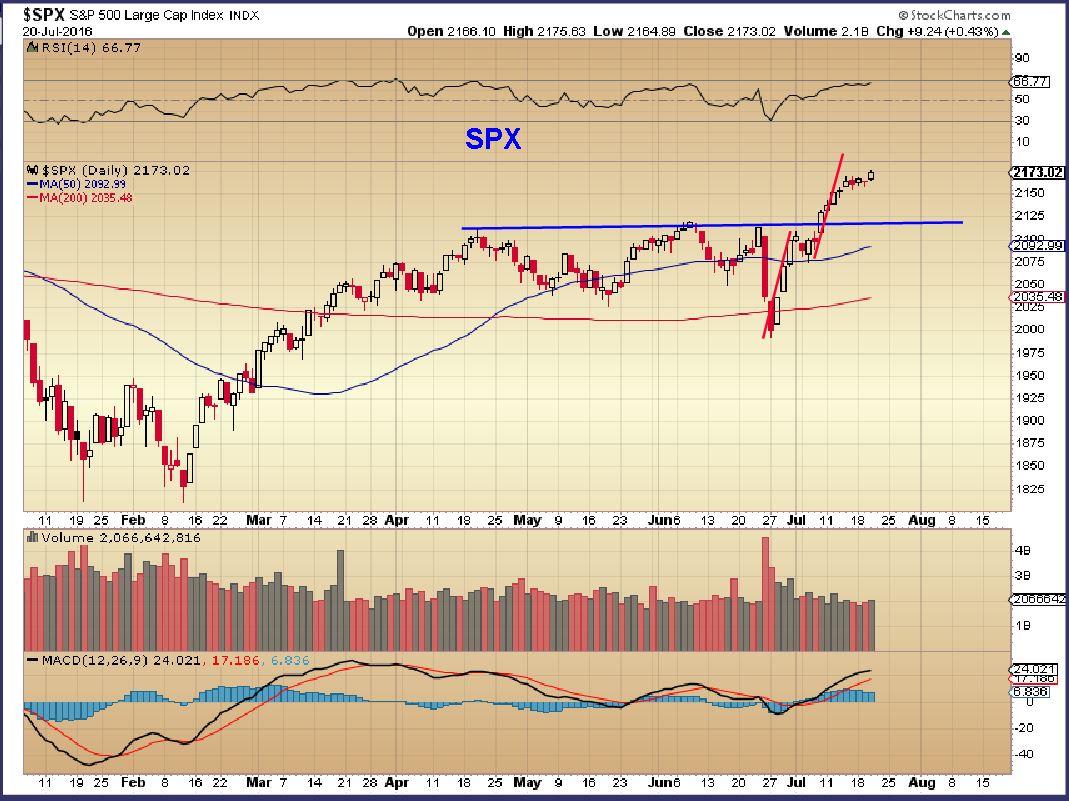
SPX - The break out that I expected after seeing the 3 white soldiers pattern is in play. Breaking to new all time highs get price above resistance, so a small sideways consolidation may be all that is needed before price continued higher. I expected a back test of the break out based on the VIX being below 12, so that still may happen.
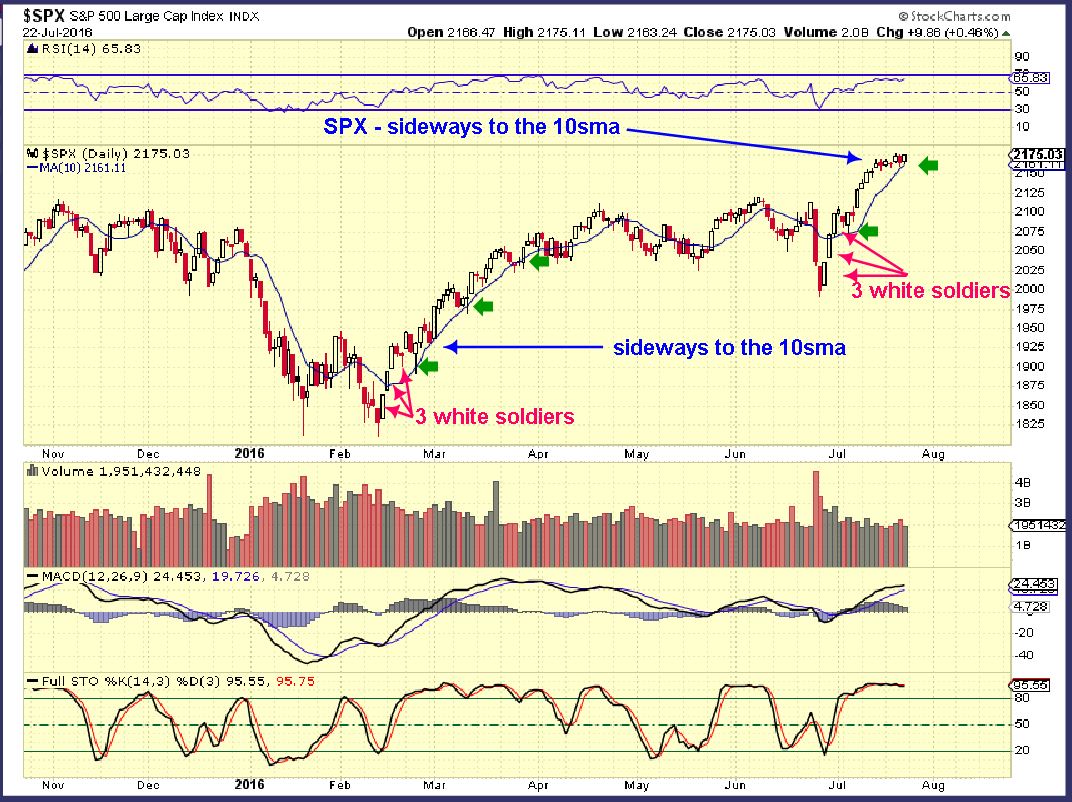
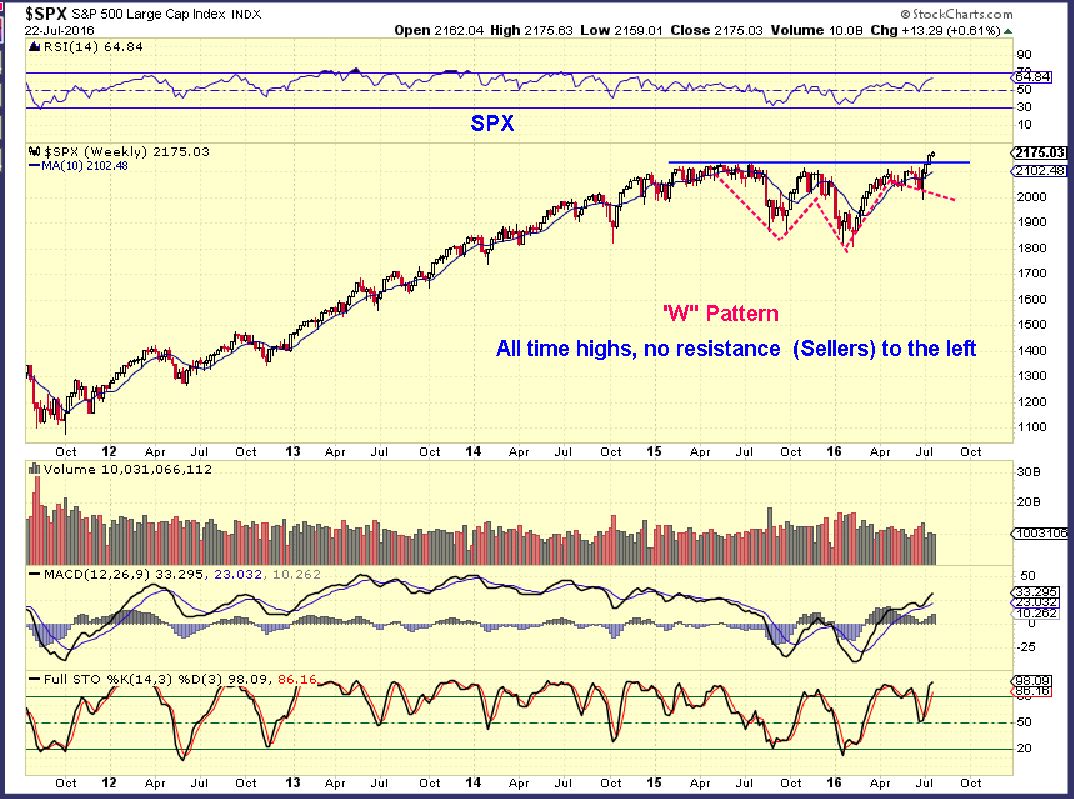
SPX WEEKLY - I know someone that is trading ( holding) UPRO and TQQQ as a result of me pointing out the 3 white soldiers, and they are doing very well. Congrats! I didn't take that trade. The VIX is quite low at 12, leverage at this point may be a bit too much. Use caution.
Lets look at the NASDAQ...
Read MoreTonights report is going to be a great lesson on how we can view things as the markets ebb and flow , breathing in and out. We're at the end of the week and we saw a little selling in Precious metals Wednesday followed by an immediate reversal Thursday. Does that reversal mean that the selling is over? We will look at a number of things that help to give us confirmation as to whether a short term low is either in, or may not be in place yet. Also buying the dips tips.
.
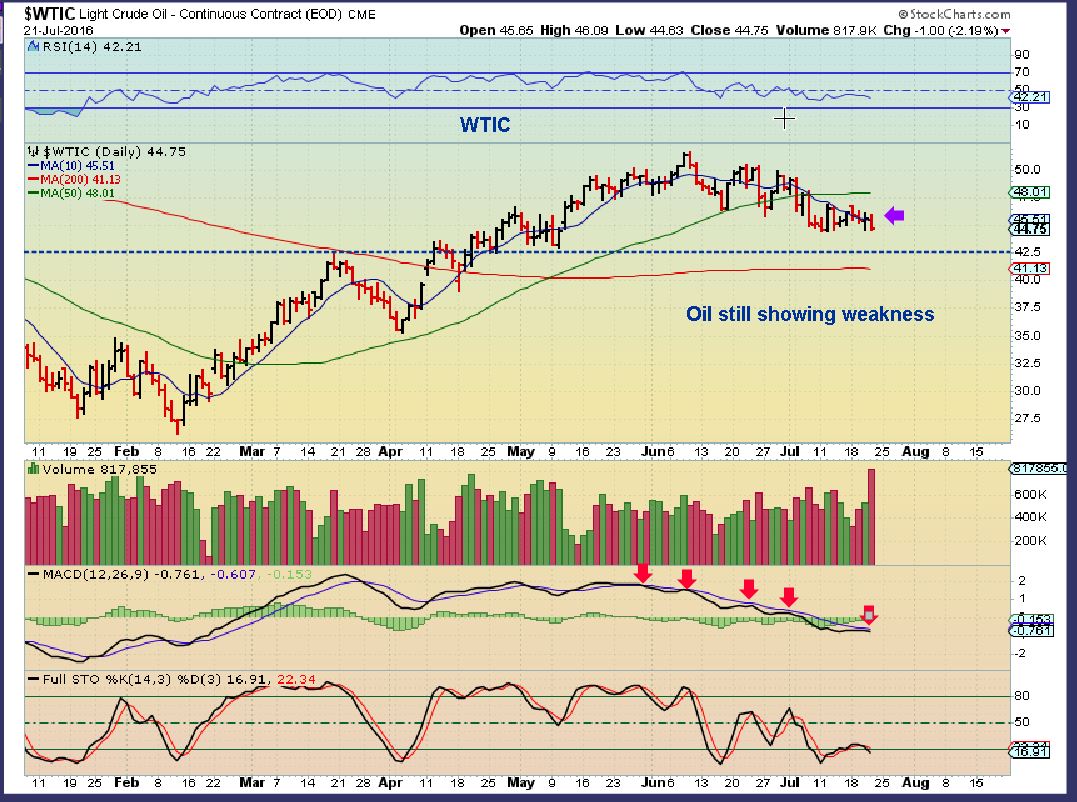
WTIC - First a chart of oil, since many do ask about the energy sector that we were trading over a month ago. We had a reversal Wednesday, but I pointed out that I still see weakness going forward. Patience is needed here.
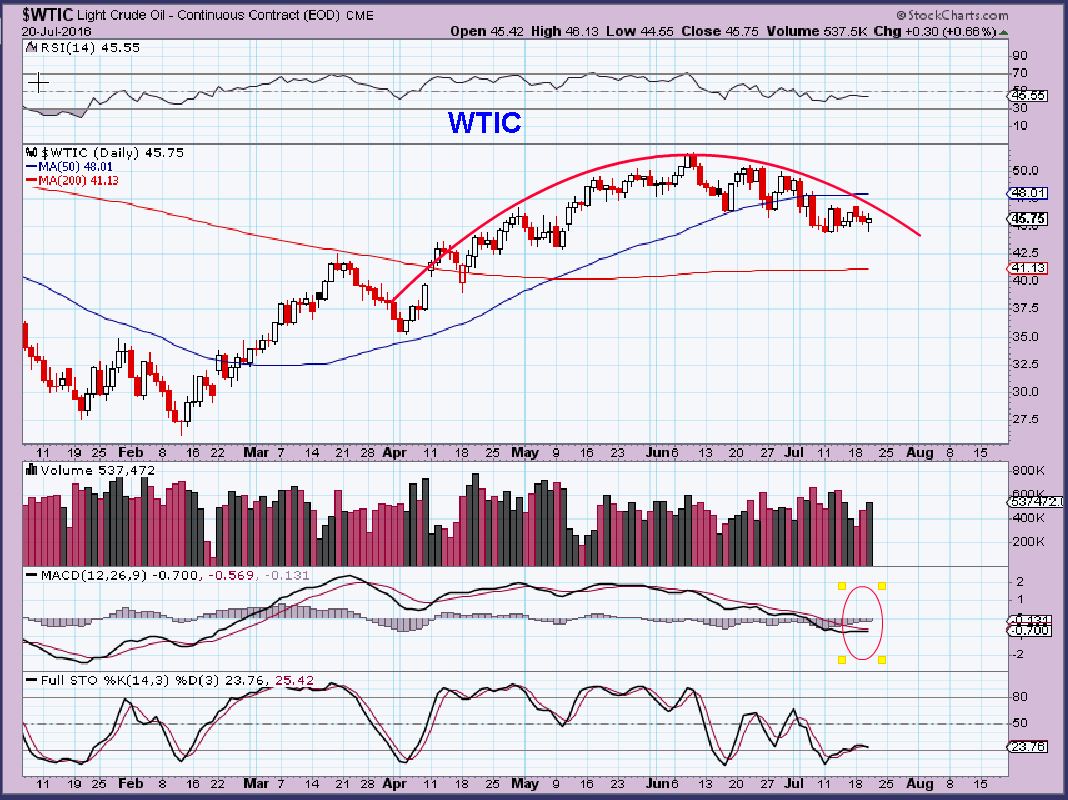
WTIC - That reversal vanished on Thursday. This needs to prove itself, and it is still proving to be weak.
Now on to Precious Metals...
Read MoreWednesday we saw the Miners (GDX, GDXJ) gap down and close near the lows on fairly high volume. What can we expect going forward? We'll discuss that after a quick market review.
.
SPX- The general markets broke to new highs and since there is no resistance here, they have just continued higher. I do expect a dip soon, maybe this measured move will be close enough?
3 reasons that I am expecting a dip...
Read More
Scroll to top


