You are here: Home1 / Exclusive Strategies
There is not going to be much new to discuss here until after the Fed on Thursday. We are in the middle or late in various daily cycles, but we can review how things are playing out so far.
.
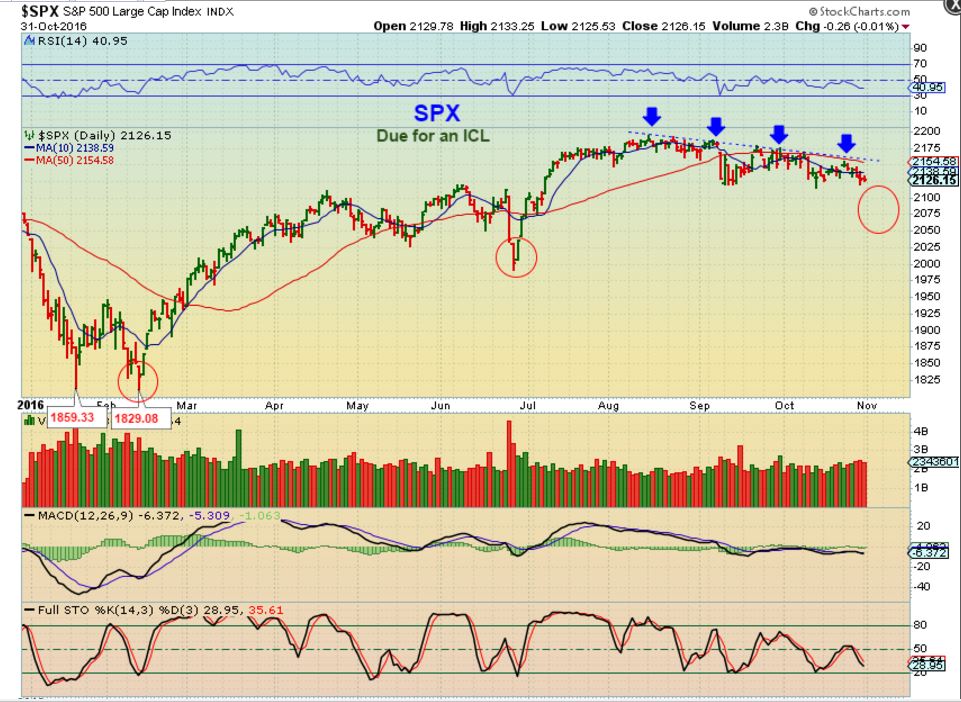
SPX Tuesdays report - I was pointing out that I an expecting a drop

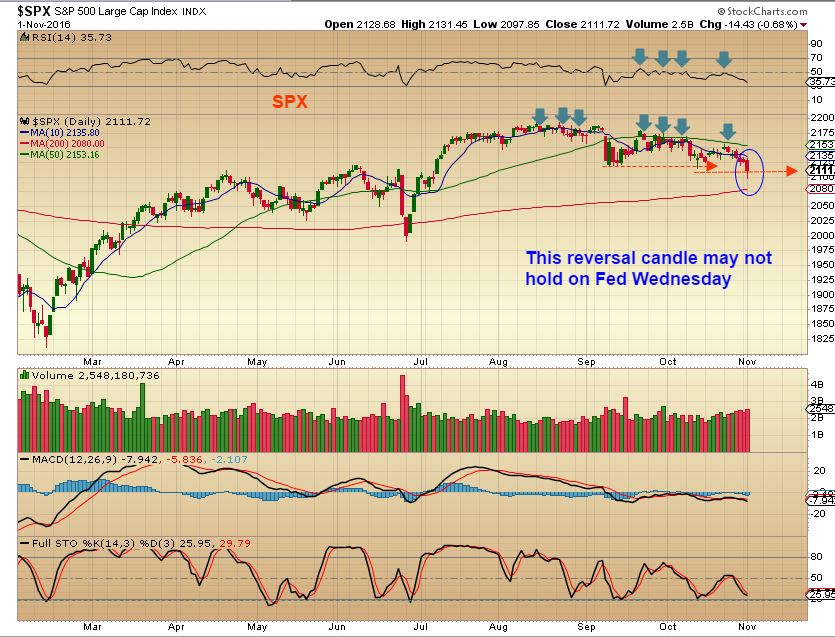
SPX - We got the market drop, but then it reversed going into the close, so we have a reversal candle. With a Fed day Wednesday I wouldn't put my trust in it yet. I did expect a deeper drop.

.
Read MoreWe had a huge weekend report, and so what possibly could be said only 1 day later? Well, I have 14 charts in this report to help us to take a closer look at things, because this is a Fed Week. To the charts...
.
SPX - I want to say that there is no change from my expectations over the past several weeks. We didn't go long or short, because these sideways markets can just waste time and chop up funds. We are due for a dcl ( possible ICL) , so I do expect a bit more of a drop to a new low, not a move higher yet. We have Fed Wednesday ahead.
 Read More
Another week that started off a little unclear in some areas, but I think we're starting to see some clarity now. Lets review the current condition of the markets and then focus on Precious Metals sector.
.
I have been pointing out the potential resistance in the General markets. With the exception of the Nasdaq , which has done a little better, Markets have been rather stagnant. Lets look at the progress over the Month of October.
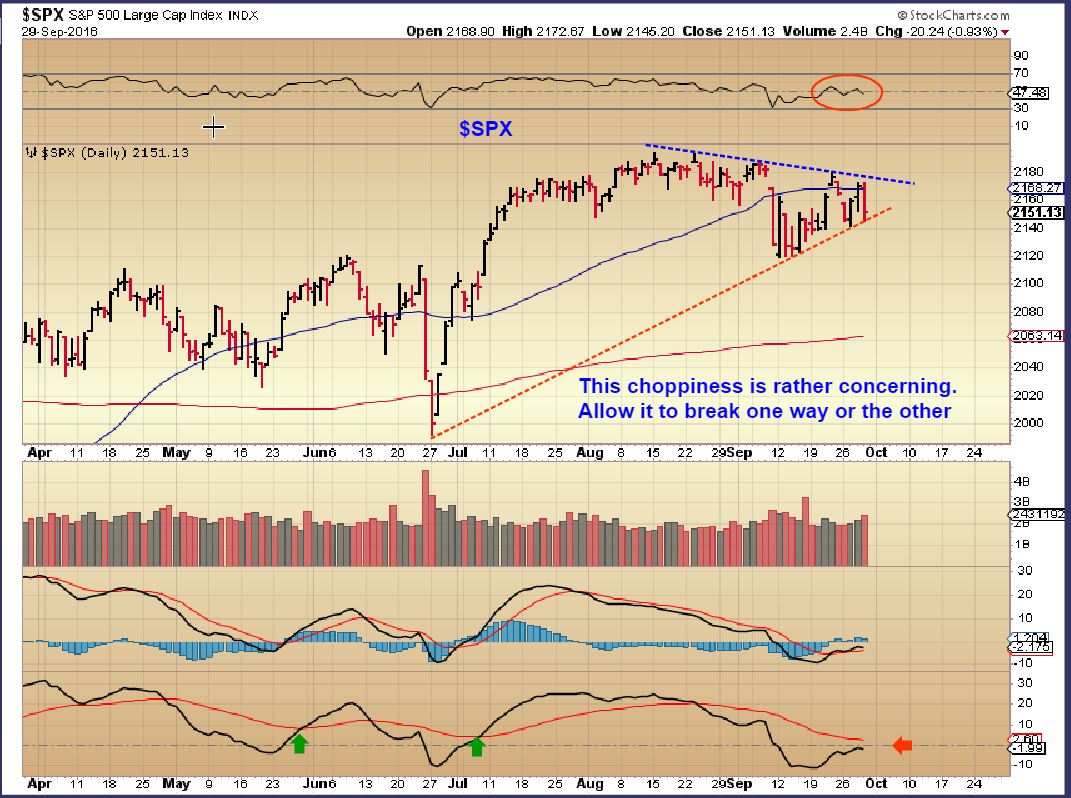
SPX -This was SEPTEMBER 30th, and the choppiness was making it unpredictable and untradeable.

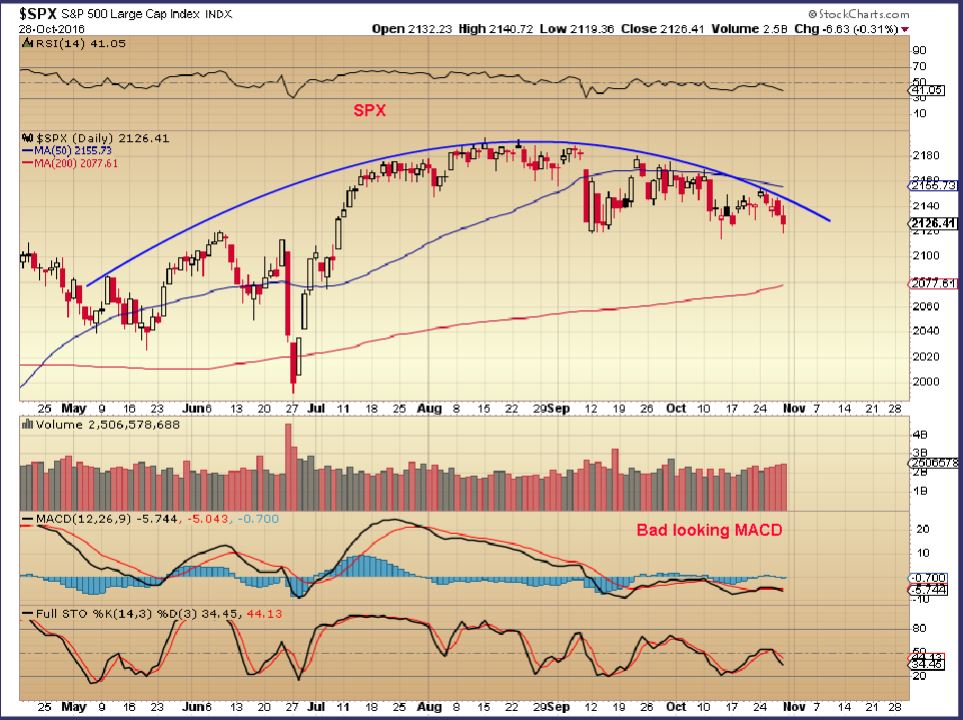
SPX NOW - 1 Month later and it is a tad lower with a big rounding top. On Oct 13th it broke to a new low and I warned that it now looked like it would NOT go upside until it first breaks to new lows again ( Failed daily cycle). 2077 is currently the 200sma and a possible support.

Lets look at the weekly chart
Read More
Scroll to top

 .
Read More
 Read More


