You are here: Home1 / Exclusive Strategies
In my opinion, the year 2016 ushered in a traders paradise. Let's take a look at where 2016 left off , and where 2017 begins.
.
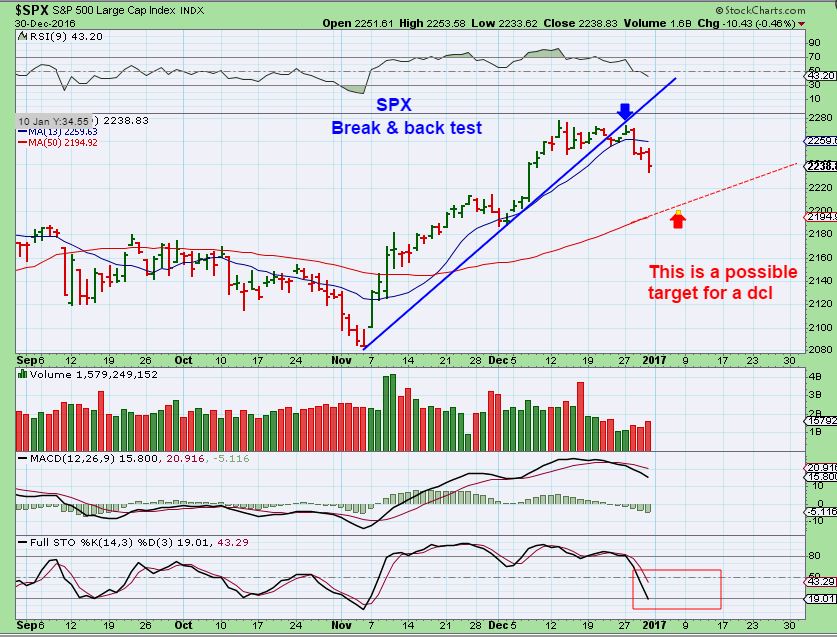
SPX - As expected, the S&P 500 is selling down at this time, possible target shown.
 Read More
This is a BONUS report, but please know in advance that this report is not being written to encourage all of my readers to invest in this area. It involves what could be considered higher risk trading, so while I welcome everyone to read it through, please know who you are as a trader / investor and do not take unnecessary risk. Look at that Theme picture again. If that is not you, then please proceed with caution. 🙂
Read MoreWhat is lining up? Let's take a look.
.
DJIA - I do believe that DOW 20,000 will have to wait for 2017. This is dipping into a daily cycle low.
 Read More
Scroll to top
 Read More
 Read More


