You are here: Home1 / Exclusive Strategies
I believe that Fed Chairman Janet Yellen is meeting with congress on Tuesday to discuss monetary policy. This could affect the USD and Precious metals if she mentions inflation and interest rate hike expectations, so let's take a look at what the charts are telling us.
.
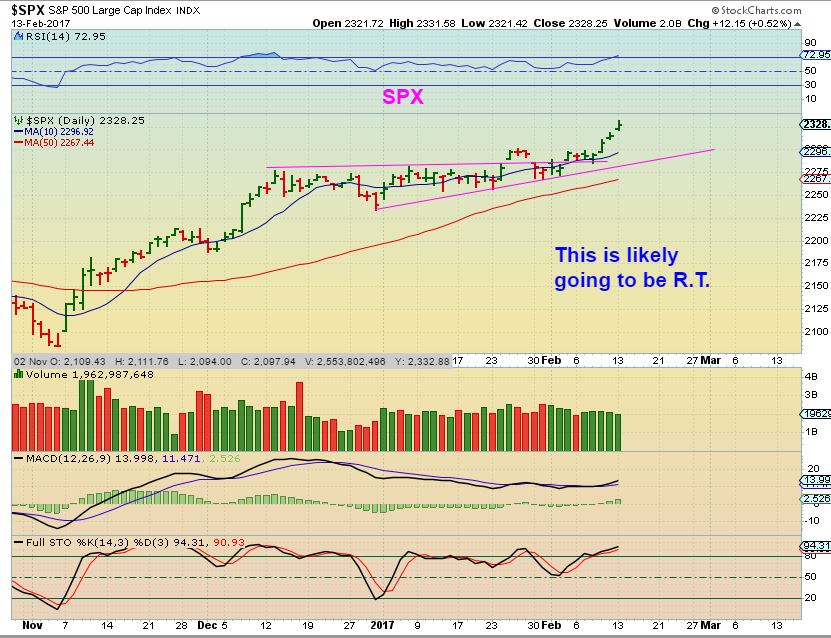
The SPX continued higher, and this makes this likely a right translated daily cycle. The bullishness of the general markets is holding on.
 Read More
ALONG WITH THE WEEKEND REPORT, I WANTED TO ADD A REPORT SIMPLY DISCUSSING SOME RECENT TRADE SET UPS. A PULLBACK TODAY COULD OFFER OPPORTUNITIES IF THE DIP IS NOT SEVERE.
.
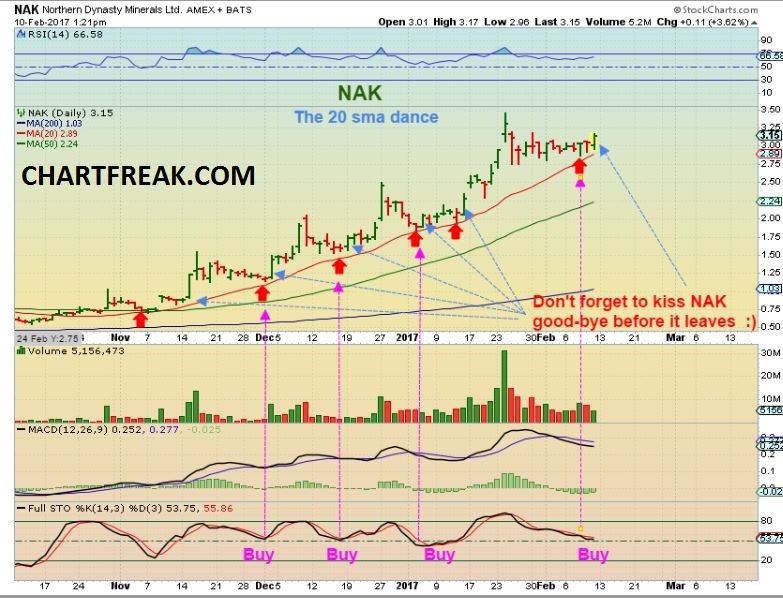
NAK was a buy all last week, and I pointed it out as a consolidation in an uptrend.

WRN - I also pointed out WRN as a nice weekly and daily set up earlier last week. It has popped to $1.62 since I posted this weekly chart, so what can we expect if you took this trade? The following charts can help...
 Read More
The weekend is upon us, let's review what the last week brought our way and what we should expect going forward.
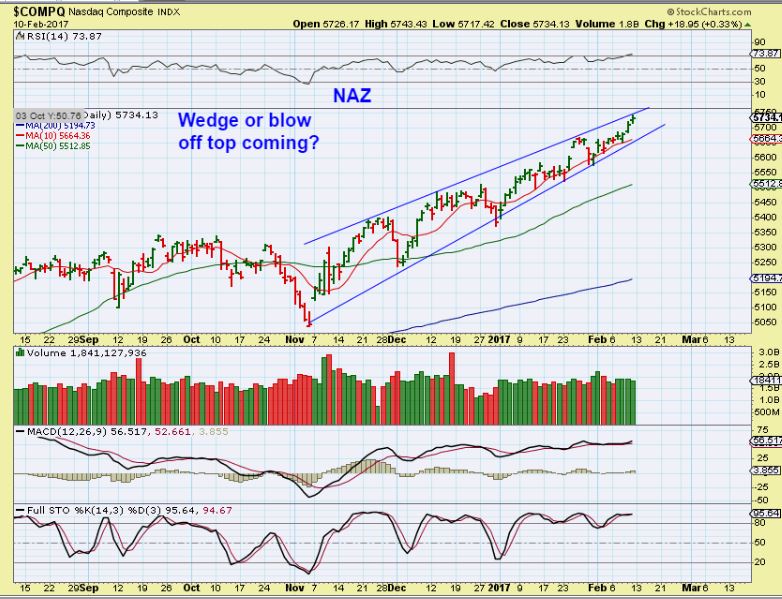
The NASDAQ continues to climb upward and it is hard to tell if this is forming a wedge or is it rallying into a blow off top? I want to look at the SPX and discuss a thing or two there .

SPX - I had drawn this wedge inside of a long term channel for last weekends report. I said that the markets do have the potetnial to keep climbing, but eventually they would reach the top at what looks like $2400 ish. Here it was at 2280.85.
 Read More
Scroll to top
 Read More
 Read More
 Read More


