You are here: Home1 / Exclusive Strategies
After the 1st round of the French Elections Sunday, we saw price break through many of the trend lines that we were watching.
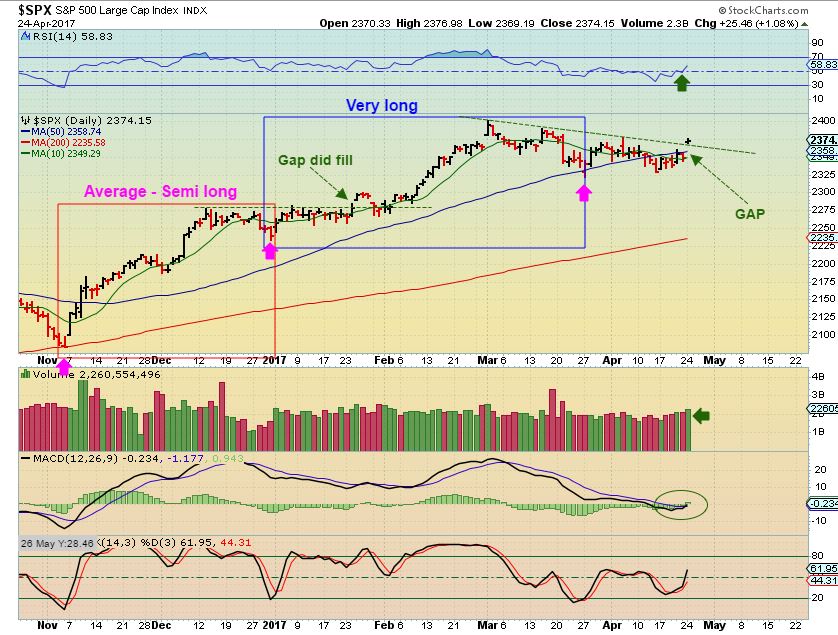
SPX - This chart was from the weekend report showing that trend line resistance for the SPX.

And we had a break out on Monday, even if I use the peak of the spike on April 5ths reversal. We've seen daily cycles run various lengths, see the 2 boxes drawn below, and so this does have the ability to run a bit higher.

Lat's look at the NASDAQ...
Read More The 1st round of the French Elections are being held on Sunday April 23, and that may temporarily shake up the markets, but so far, things do seem to be lining up as expected in various sectors. Let's review ...
.
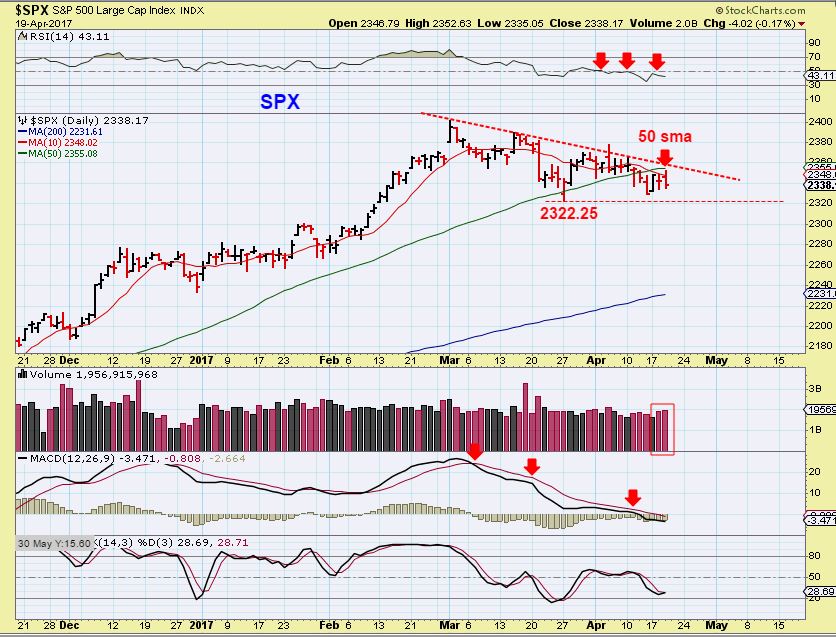
SPX - On April 19th we saw the SPX continue to be rejected at the 50sma. I mentioned watching that 2322.25, because a break out higher or lower is important.

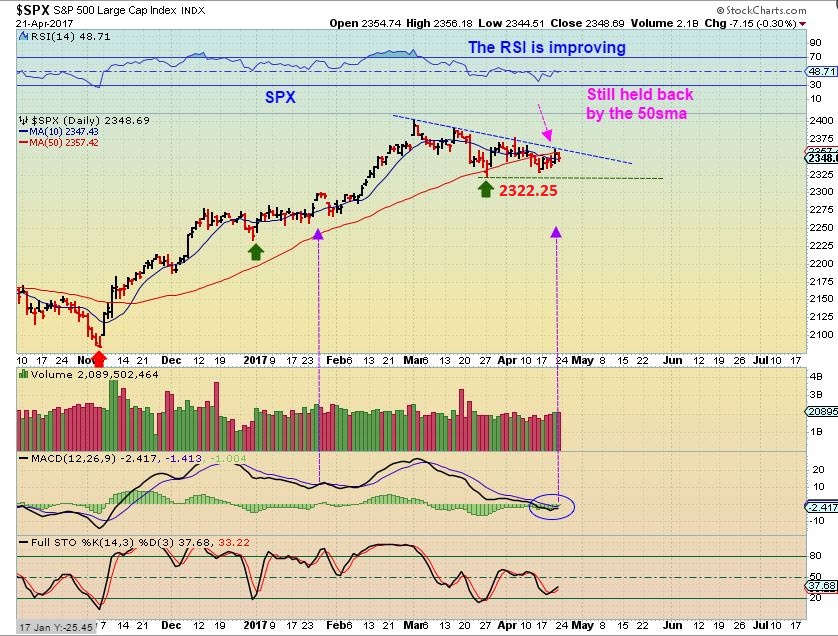
SPX April 21 - No change yet. The RSI & MACD are improving, but no break out yet.
 Read More
If you were reading the 'comments' or the chat area yesterday, there was a lot of talk about STEEL and the STEEL STOCKS, so Fridays report will discuss that area and some probable trade set ups in that area and other areas.
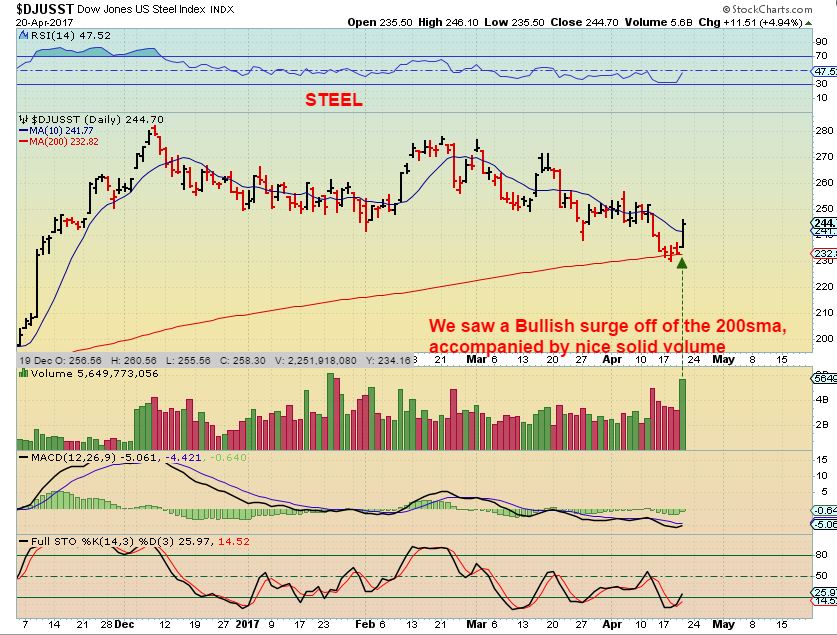
STEEL - We'll start with STEEL itself. We have a weekly reversal and a swing low has formed on the daily chart. After the long multi-month consolidation, the weekly RSI is again above 50% and the Stochastics has reached an oversold level. This all looks good.

STEEL DAILY - The daily chart had a nice bullish push higher too, and right off of the 200sma.
 Read More
Scroll to top


 Read More
 Read More


