You are here: Home1 / Exclusive Strategies
Every now and then I like to step back for the weekend report and take a look at the Big Picture. I have been reporting for months that I see big picture changes in many sectors starting to take shape. Lets see if they are advancing or falling apart.
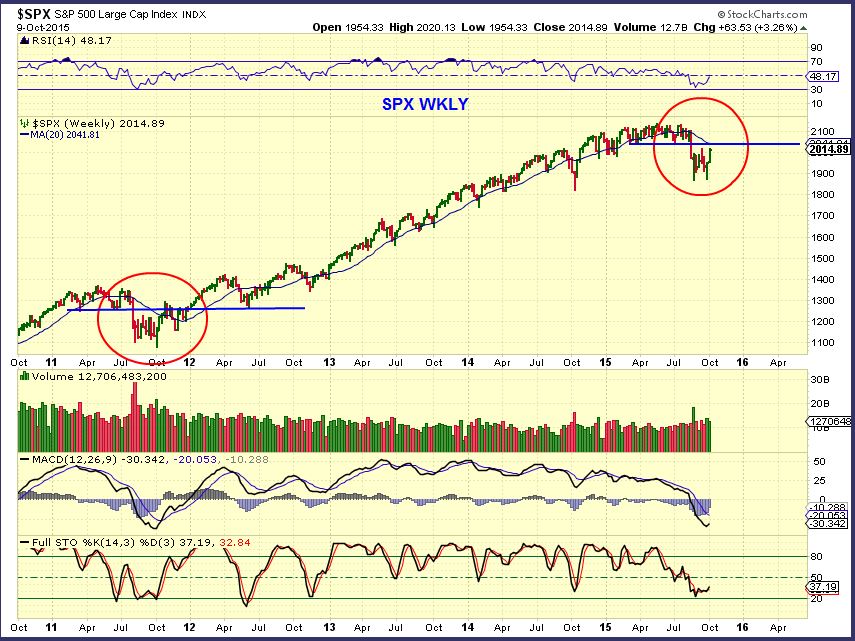
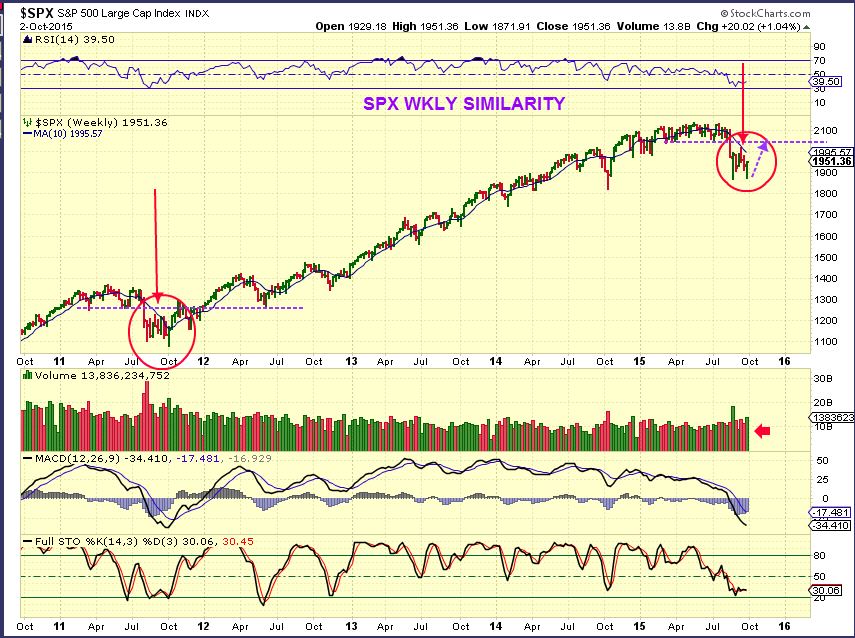
The SPX is approaching resistance. Will it halt the rise, or possibly just give it a pause like we saw in 2011?
Lets look for some clues...
Read MoreThe saying , "What goes up must come down" is true within Bull and Bear markets. Lets take a look at what is going up and what is likely to come back down, keeping in mind that the FED MINUTES are to be released later today.
.
I drew this last week to show that I expected the SPX to move up to the purple line
 Read More
Scroll to top