You are here: Home1 / Exclusive Strategies
It is the final trading day of the week, so this report will just be a quick summary and will also include a few trade ideas
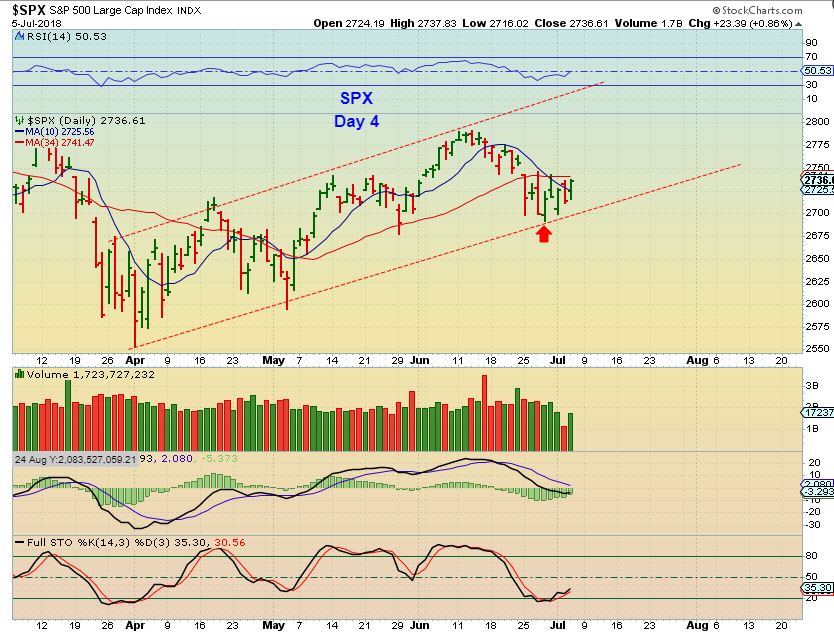
SPX - I think that we have a dcl. In tech analysis, you would expect a possible run to the upper trend line, but...
 Read More
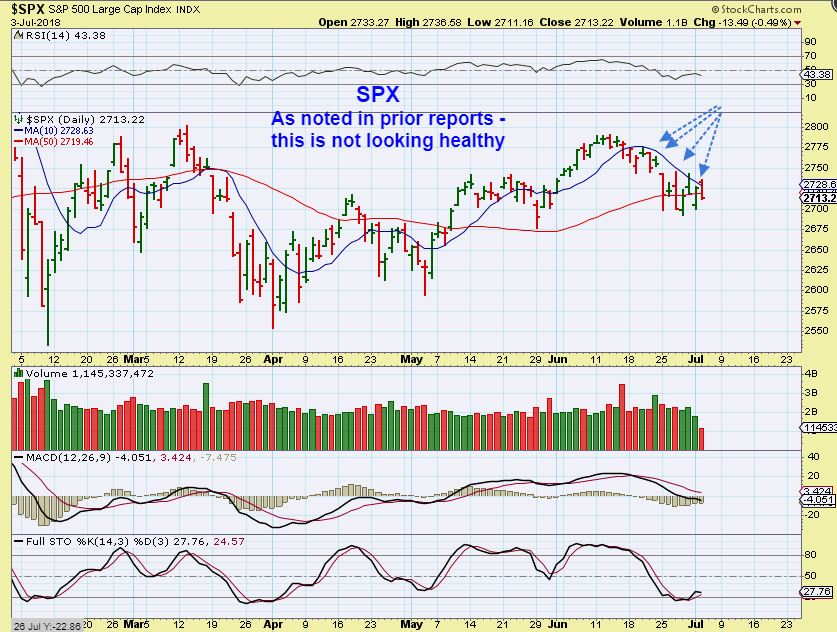
SPX - The General Markets gapped higher on Tuesday and the rolled over again. The 10sma is rejecting price, so we still do not have a confirmed DCL, but we are due for one and we do have a swing low unconfirmed.
 Read More
 As I sat on the plane returning from my trip yesterday, I thought of the Chartfreak Readers while having a beverage & some Crackers 🙂 I noticed that Gold was selling off, but Miners seemed to be holding up fairly well, and I wondered if that would continue through out the rest of the day.
.
We'll discuss Precious Metals after a quick review of the markets and a friendly reminder that TODAYS TRADING CLOSES AT 1 P.M. IN THE U.S.
.
Read More
Scroll to top
 Read More
 Read More


