You are here: Home1 / Exclusive Strategies
In the weekend reports, we take a step back and try to look at the big picture. It looks like we are VERY CLOSE to some changes. Let's take a look...
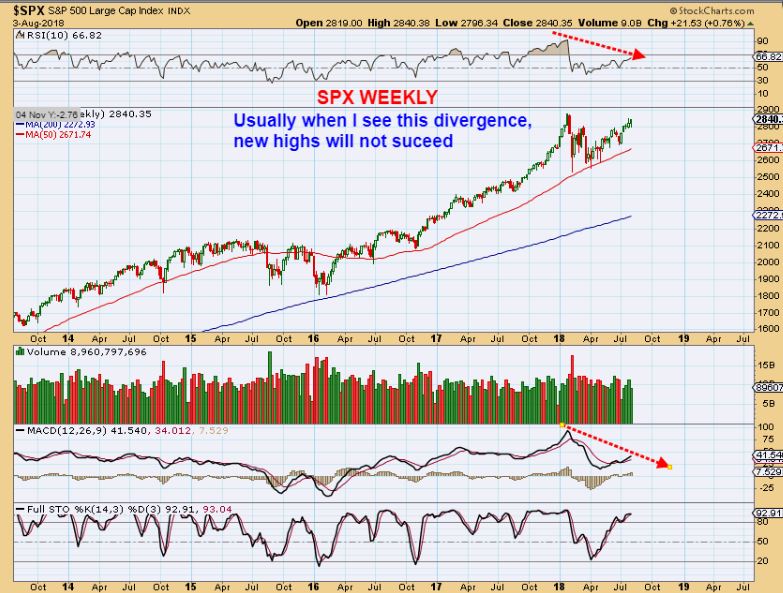
SPX WEEKLY #1 - I have been discussing this divergence. It is not a sign of strength at the highs, though the big picture is obviously a bull run. Bull runs can & do pause and falter as the consolidate recent gains, see 2015 into 2016. This can take months. Read the chart.
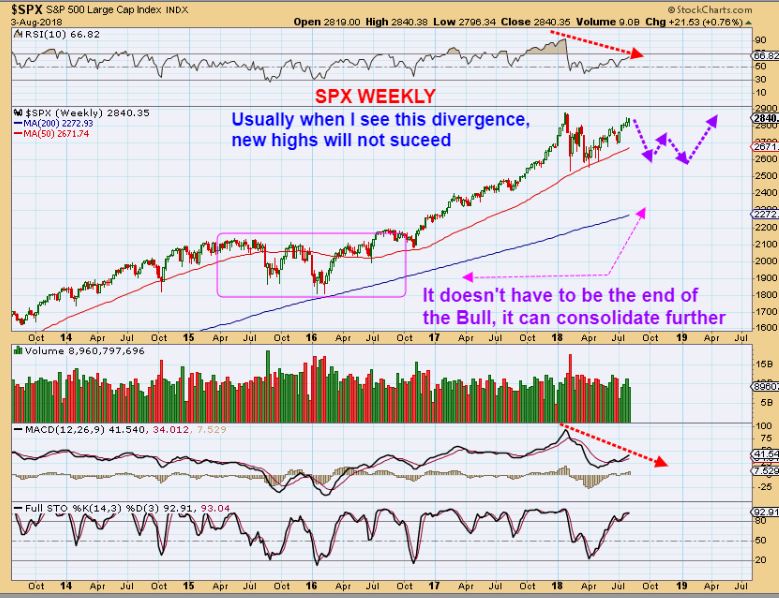
SPX WEEKLY #2 - Again, Bull runs can go choppy and difficult for weeks, months, even years, as seen here. Read the chart.
 Read More
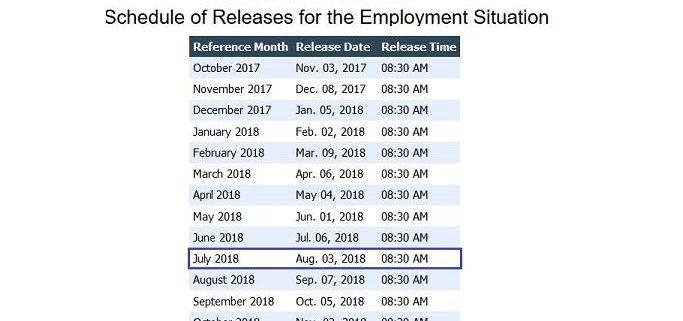
I don't expect any big surprises with the July Employment report , scheduled to be released at 8:30 a.m. Eastern Time. It shouldn't really affect things, but since that is the next event on deck, we'll just have to wait and see if it does or doesn't affect our markets. Let's take a look at Thursdays action, shall we? We have A LOT to discuss...
IWM From July 24 - I have been looking for a dip into a dcl, and so we would expect a top of some sort to form. The IWM started us off looking weak . Notice how the Weak MACD & High volume drop makes the IWM, a former leader, look weak That 50sma did NOT look like it would act as support and it didn't. Price broke below the 50sma...
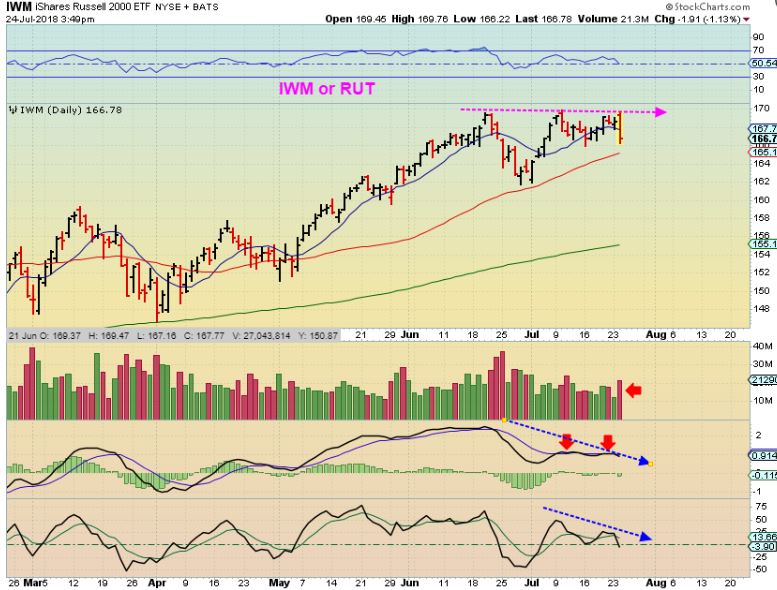
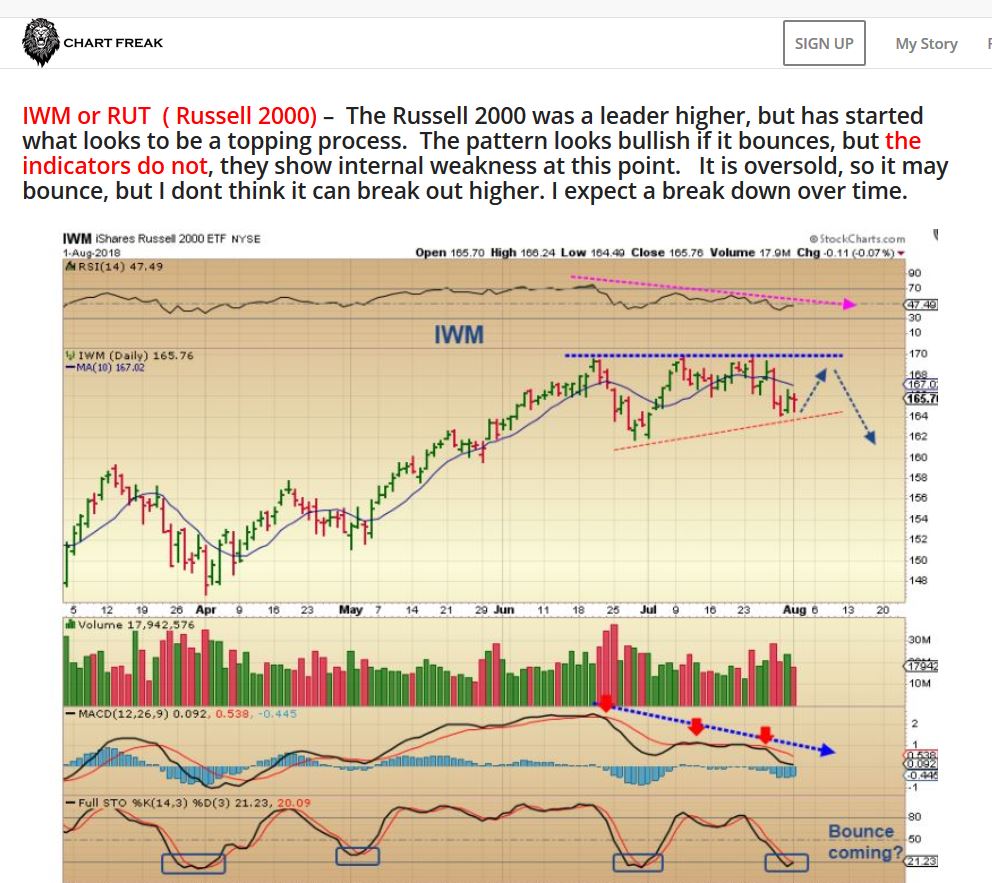
IWM COPY/PASTE FROM YESTERDAYS REPORT - I thought that the 'pattern was bullish, but indicators remained weak". It looked like it could bounce though, as the markets have become oversold. You can read my thoughts from yesterday.
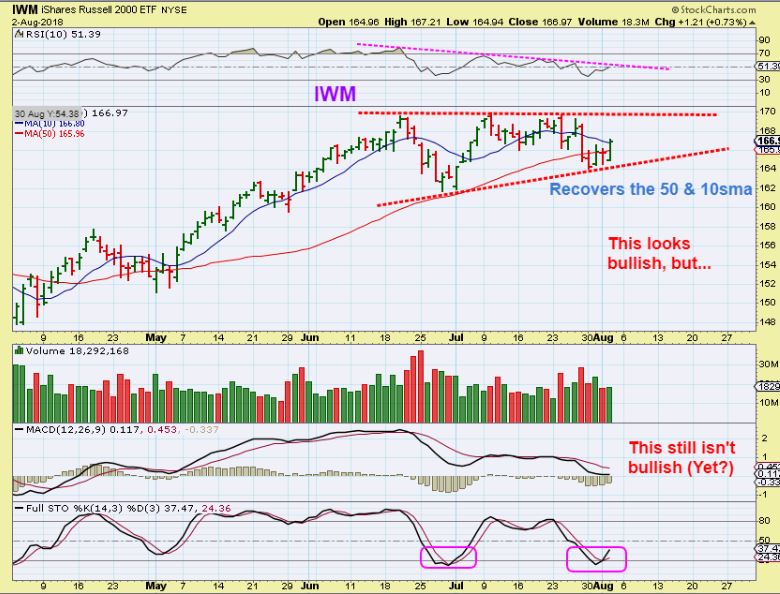
IWM CURRENTLY- The 50sma did not hold, but the bounce did come Thursday and Price did regain the 50 sma. The bounce actually looks bullish, but indicators still do not. That makes this "Iffy". Any reversal like this ( regaining support) can be bought with a tight stop, just in case these markets break out higher.
So timing-wise, We are coming due for a dcl, but that could be a 1/2 cycle low, as mentioned on the NASDAQ yesterday, and we may go a bit higher. These markets are surprising both to the upside & downside lately during earnings season, and that makes it a bit trickier as things become choppy. It is a stock pickers market when things get choppy like this. Lets continue...
Read MoreIt is time for my favorite lesson again, and I call it ...
Read More
Scroll to top