You are here: Home1 / Premium
I dont know about you, but trading on Tuesday had me feeling like my basket had some dogs in it. Is that truly the case? Lets take a look…
.
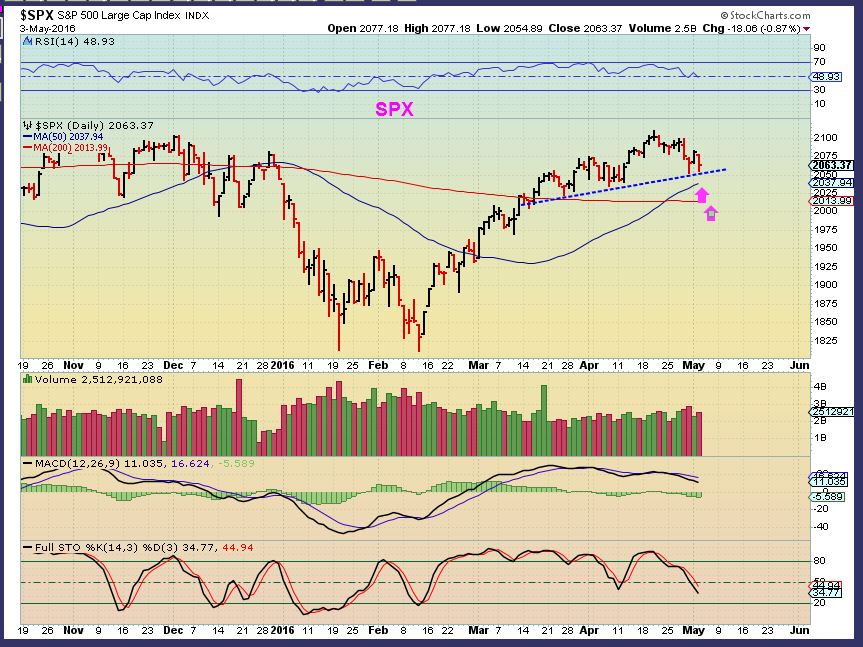
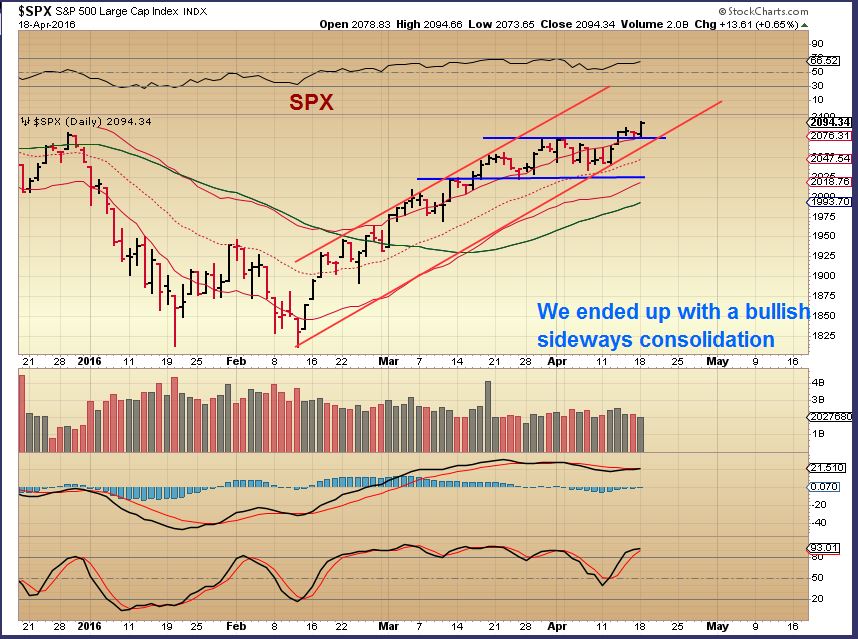
SPX– CNBC was very concerned about the markets selling down today, but this chart is not bearish at this point.It keeps selling down and then being bought back, and that leads to a sideways move so far.
Read more
Not a whole lot has changed from the weekend report, but we can still review our information and update our outlook if needed.
.
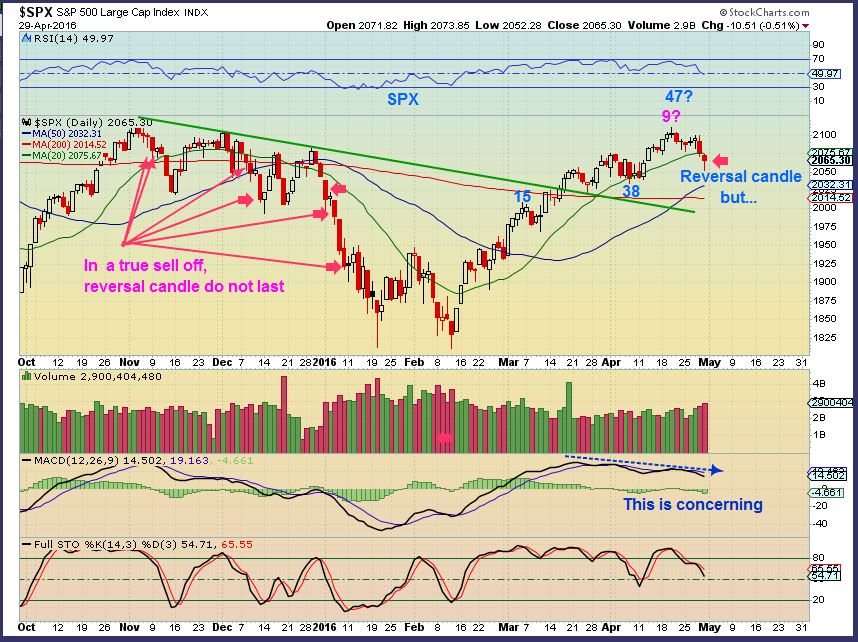
SPX – This was from the weekend report. Notice that either cycle count that I had in place showed that it was late in the 1st daily cycle. We are due for a DCL and the start of the 2nd daily cycle may have already occurred on day 38 or Friday with that reversal.
So here is the SPX from Monday …
Read more
Week after week we are seeing very good action and even fairly clear predictability in the various sectors. We have experienced some great gains in Miners, Energy, and Commodities for all of 2016. I have to keep reminding myself, and so I want to remind the readers here too, that pull backs and corrections are expected and keep a market healthy. Lets review our markets and discuss that idea further.
.
I’ll start with the NASDAQ WKLY – The NASDAQ hasn’t been as robust in its recovery as the SPX. It almost looks to be rolling over, so lets keep an eye on it.
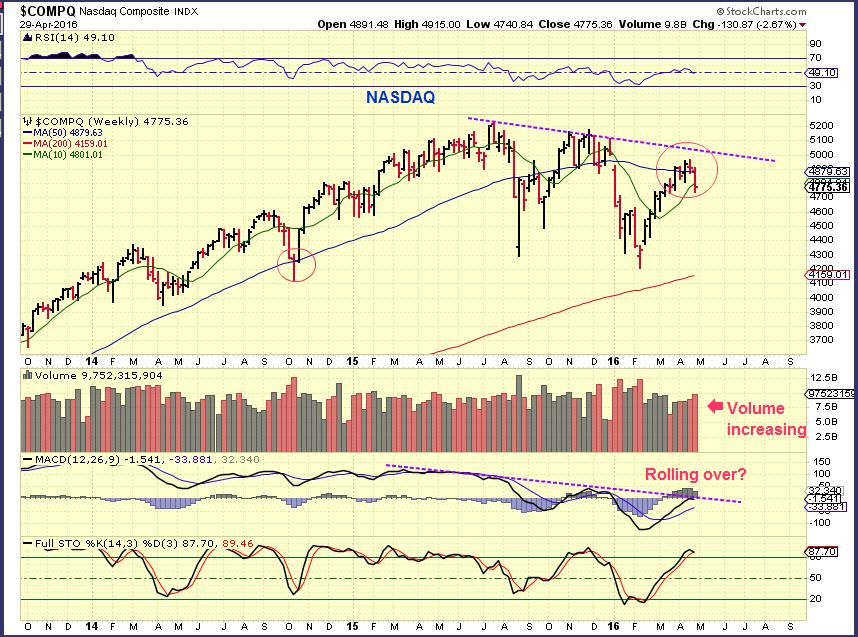
The SPX Daily began rolling over, but I see bullish signs too. Remember that corrections and pull backs can be healthy. Is this a healthy pull back?
.
Read more
We have goals and we want to reach are targets, but often there are obstacles that can pop up along the way. Can we still reach are targets along the way. Yes. Lets do a quick market review and discuss our current trading.
.
SPX – I noticed a couple of days ago that the NASDAQ was selling off, but the SPX & DOW were holding up. Now the SPX started to sell off. The stochastics shows that it can fall for a while. I’m watching a few support areas. We’ll discuss this more in the weekend report.
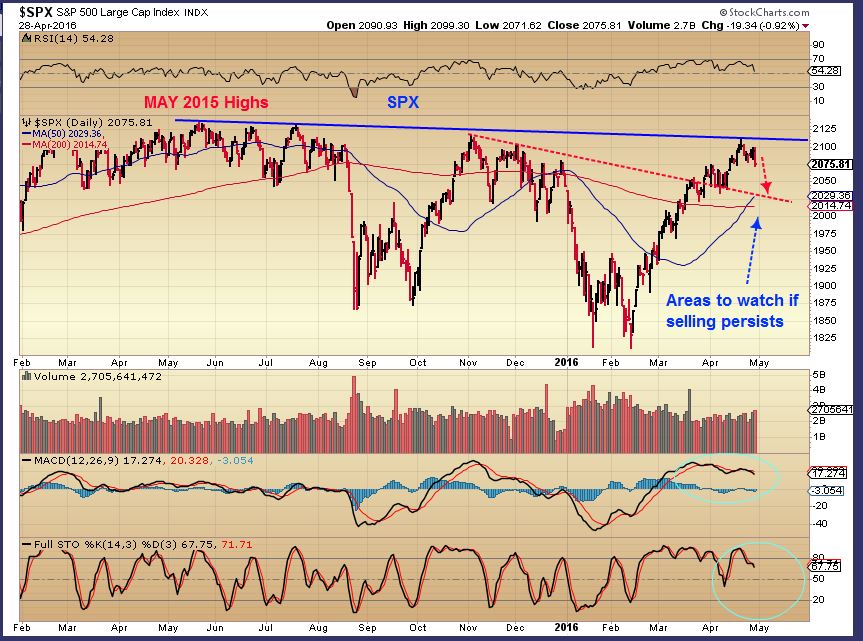
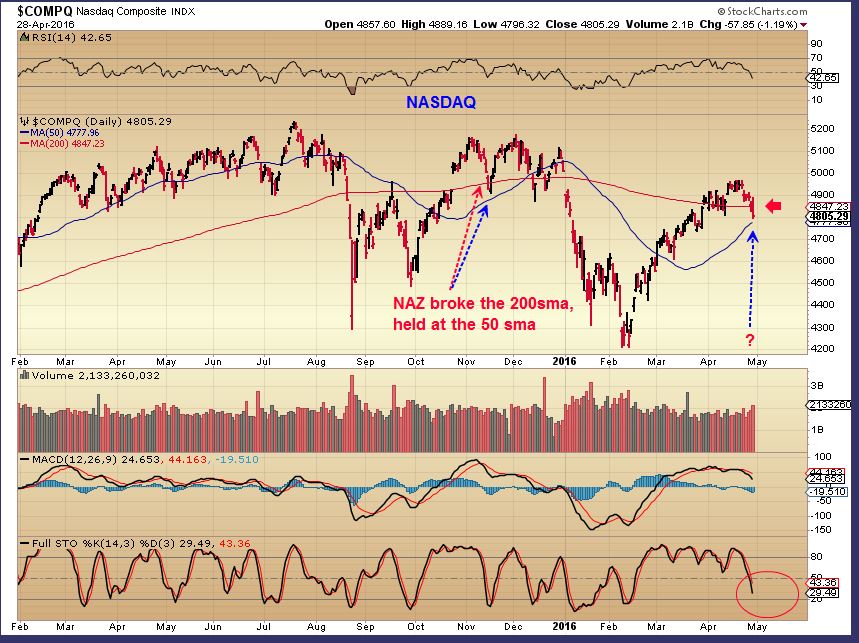
NASDAQ – The downtrend from the MAY 2015 highs is still in place. Lower lows and lower highs so far. On this chart I am pointing out that when the NAZ broke down last fall, it broke through the 200sma, but the 50sma was not violated.
Read more
A farmer has to take advantage of the opportunity to make hay when the sun shines. If he has other things to do, they’ll have to wait for a rainy day. He cannot make hay on a rainy day. A trader or investor has to invest when the ‘set ups’ are ready. If the low risk set ups have presented themselves, and he or she decided to pursue something else for a while, by the time they return, the opportunity may be gone.
.
With that in mind, lets make some Hay today.
.
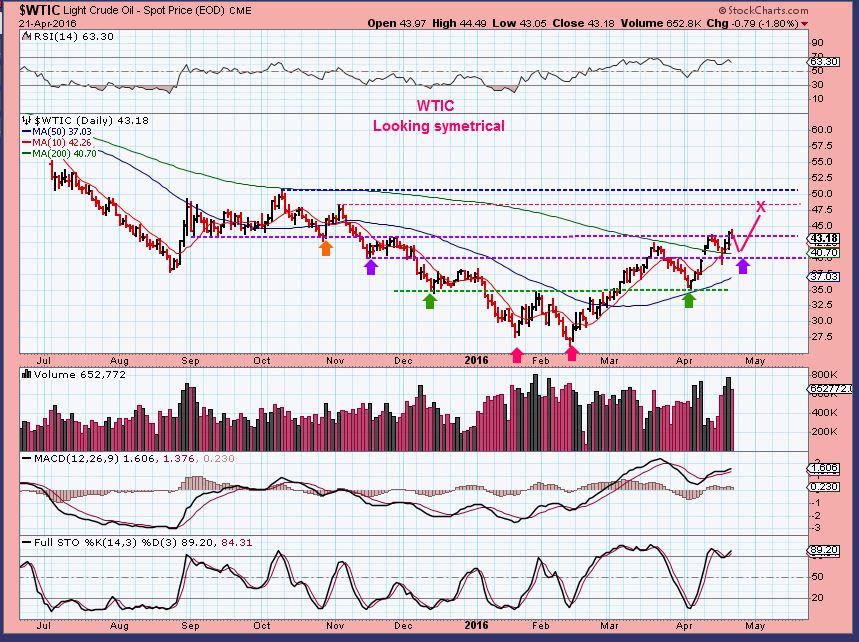
WTIC – Think about this. Last week I pointed out that OIL would move higher, but it is in a resistance area. It could struggle a bit. There is good news with this…
Read more
Ready for what? For one thing, we are at another Fed Wednesday. Yes, that’s right, the latest Fed Decision on interest rates is released today, and usually we have to get ready for any possible volatility. This time I dont expect much in the way of a surprise there, but we may want to start getting ready for the trades that the charts are setting up for.
.
On April 20th I posted this chart of Oil. I’ve been bullish on Oil since the Feb Lows, and it still wanted to go higher. There is a resistance area in blue, but Oil looks like it wants to move to at least the top of that area for now. I listed many Energy / Oil companies that were set up bullishly.
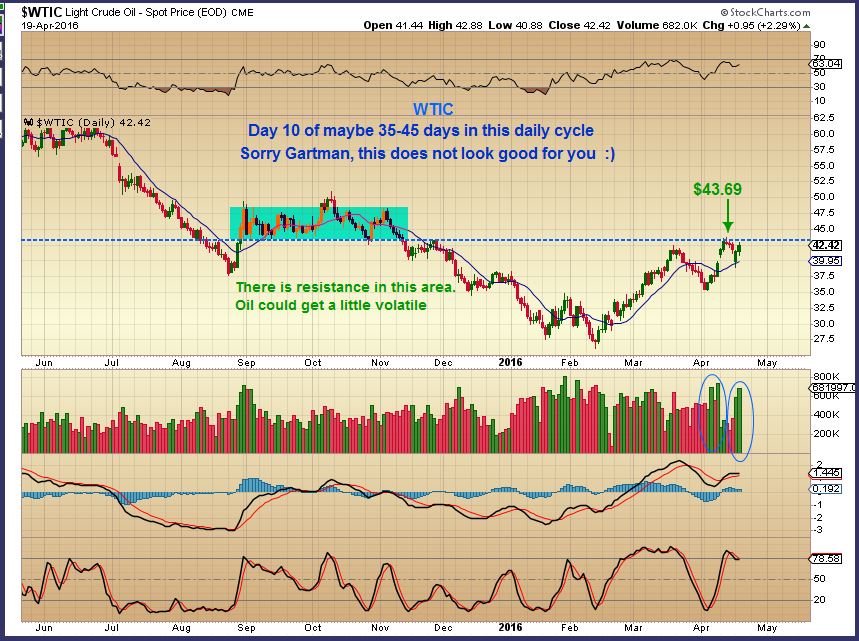
Last Thursday I showed how Oil would have to work its way through resistance, but was still going higher. You can see last Fridays report for a list of Oil/ Energy stocks that were setting up bullishly.
Read more
Whenever we as traders get really really comfortable with our trades and trading, I think it is always a good idea to go back and shake things up a bit, just to keep us on our toes. Since not a lot has changed on the charts from the weekend report through Mondays trading day – I wanted to focus on trading and ‘trade set ups’.
Read more
It was another excellent week of trading. I received more than a couple of emails expressing joy over the past couple of months of activity. I’m really happy to see these results. Since we know that these runs dont last forever without consolidation phases, lets get right to the trading and our expectations going forward.
.
LGCY- This was the trade of the week if you ask me. I showed this base as having huge potential back on April 9th.
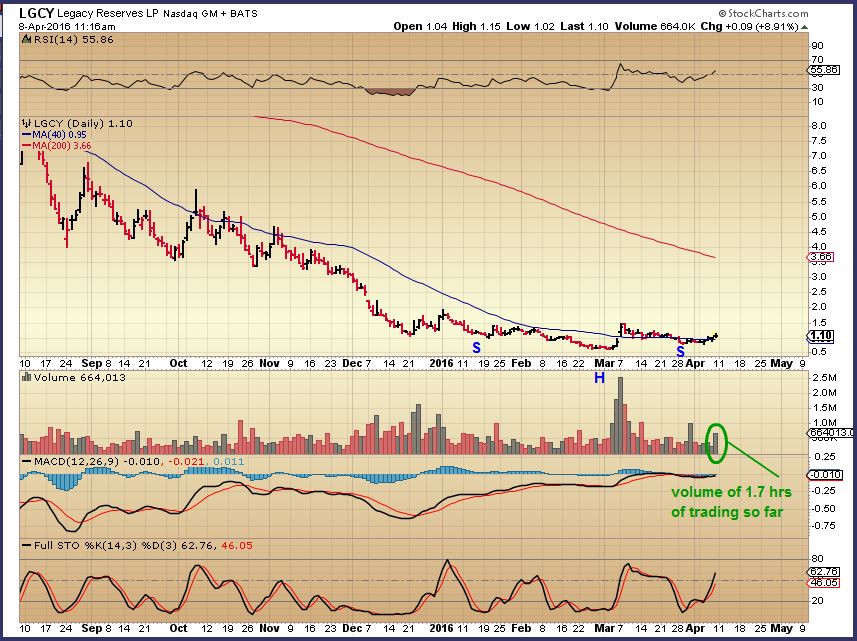
This was Last Monday – It was a buy when it bounced right off of the 50sma near $1.00. These types of bases are explosive.
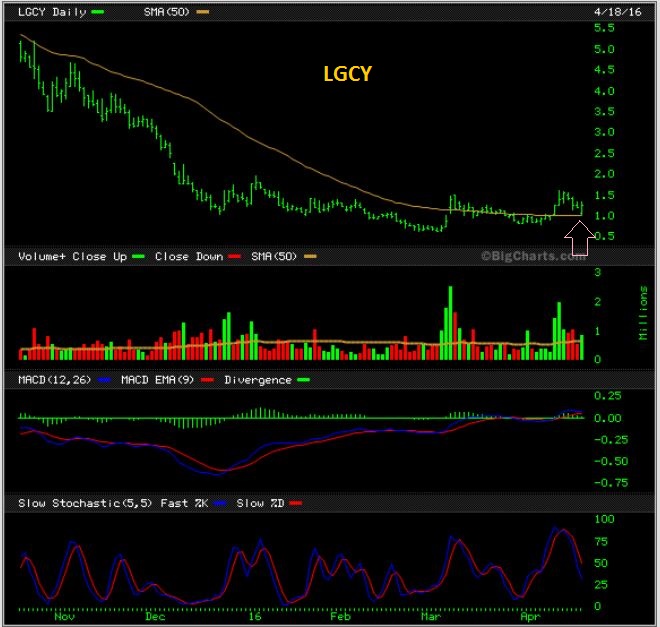
Last Wednesday – Still could be bought, inside of that long running base.
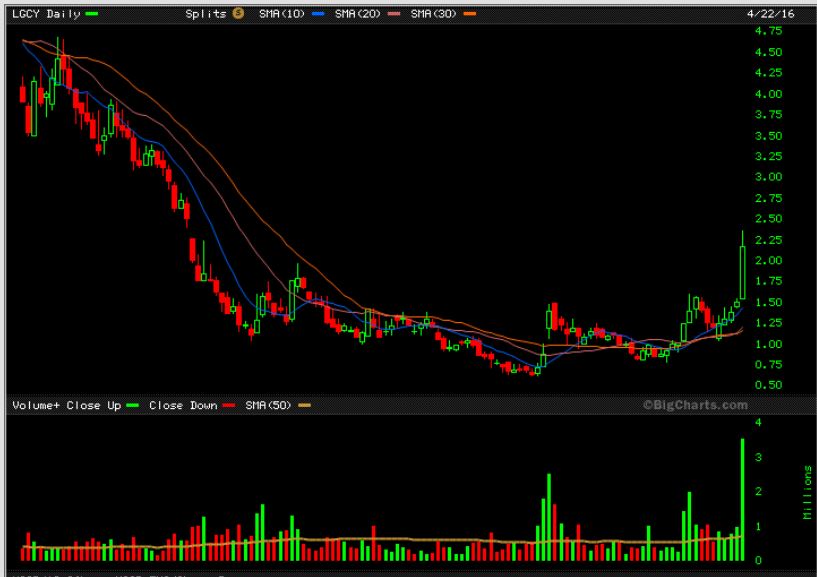
APRIL 22 LGCY – It surged to $2.35 Friday! Well over 100% in 5 days, 46% Friday alone.
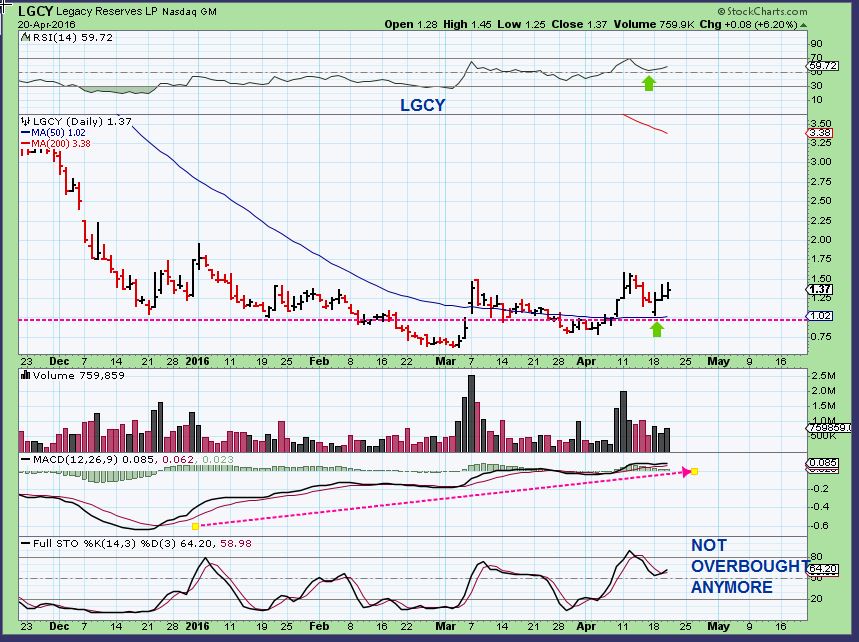
I am going to discuss what to expect from LGCY and a few other trades of ours that have done well later in this report. Is this just the start of a break out from the base, or has it exhausted itself? Stay tuned.
Read more
I just wanted to post this Friday report to mention a couple of things about our trades.
CRB – This was my Tuesday chart of the CRB. Notice the area where it was expected to run to , and then it might hit resistance.
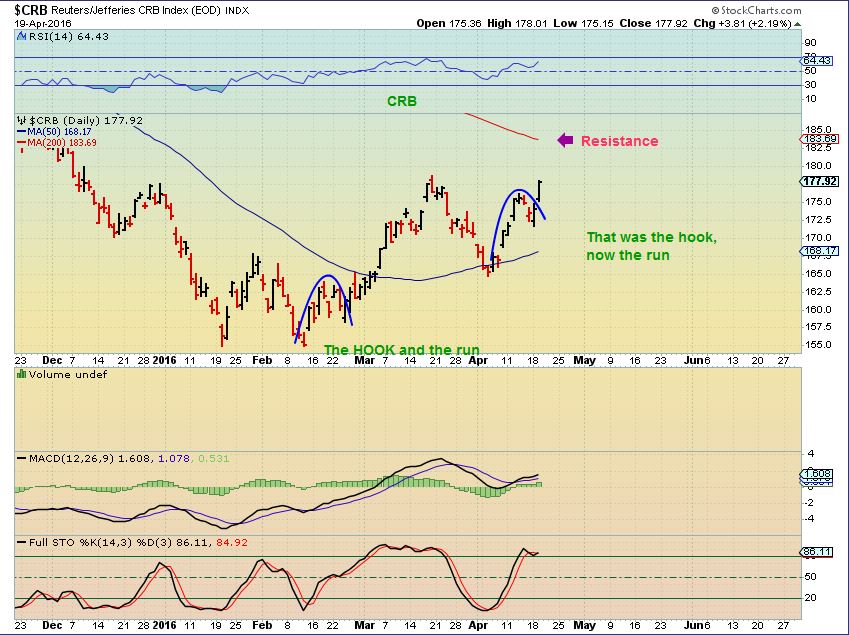
Today the CRB hit the 200sma and turned down. Is the Run complete?
Read more
Thursday – 2 trading days left in the week. Again we have had another great week of trading, but how long will this last? Should I sell my positions? Lets do a quick market review and then discuss positions.
.
SPX – April 18 had the markets Bullishly moving higher.
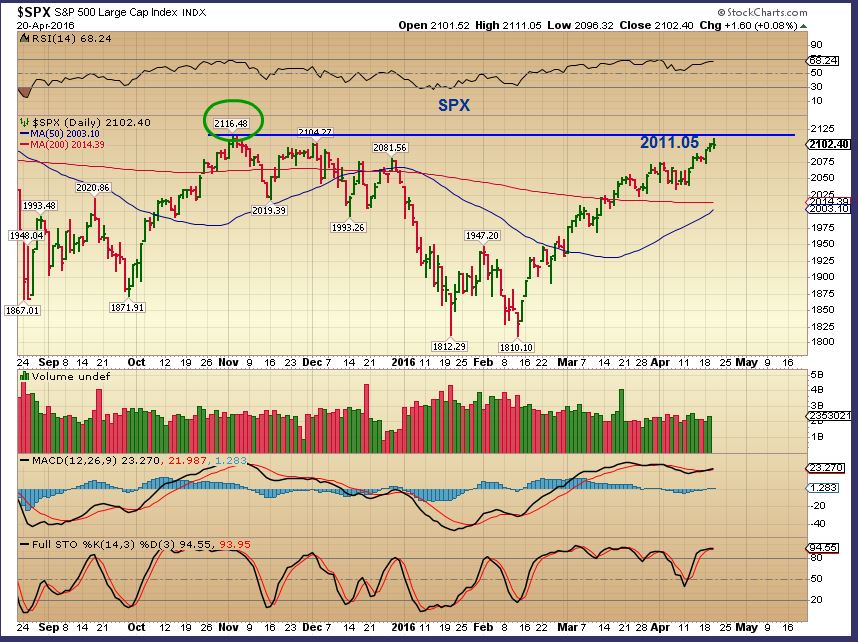
SPX April 20 – The SPX is almost at the November highs and remains bullishly aligned. This may be an area that gives resistance, or the shorts may pile in and be forced to cover if it breaks to new highs.
Read more
Scroll to top