You are here: Home1 / Premium
It is NOT easy when you have a stock up 10%, and the other 4 or 5 are up 20% 34% and so on , but we'll just have to deal with it 🙂 . Yes, I'm kidding, but seriously that is the way it has been lately. Dont get used to it, it can be short lived reward for the patience that we have put in. Lets discuss selling and rocket ships after a quick review.
.
SPX April 4th chart - I pointed out this bearish rising wedge and called for the markets to stop rising as a result. I said that I then would expect another run higher.
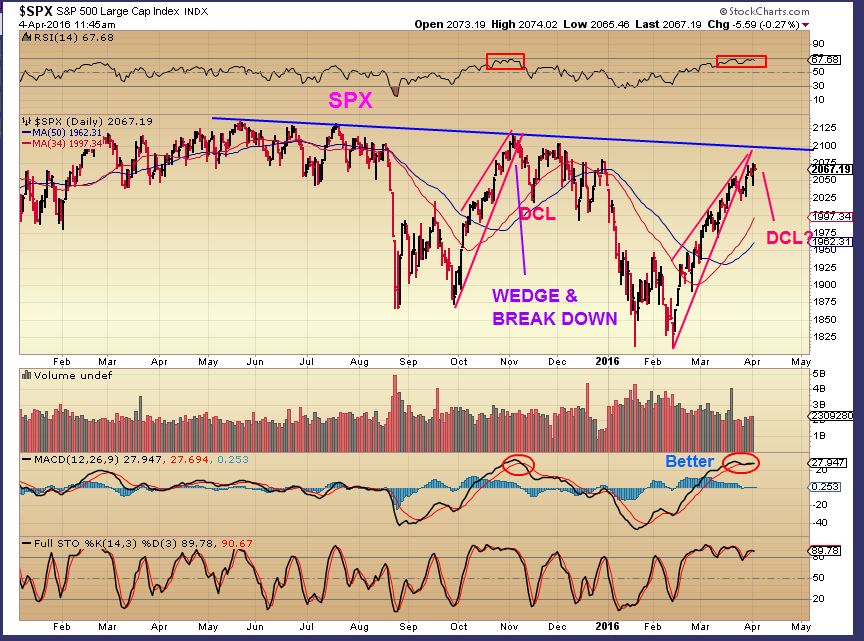
SPX - Those wedges can cause a drop or a sideways move that can correct the wedge, and so far we now have a channel . That wedge has fixed itself.
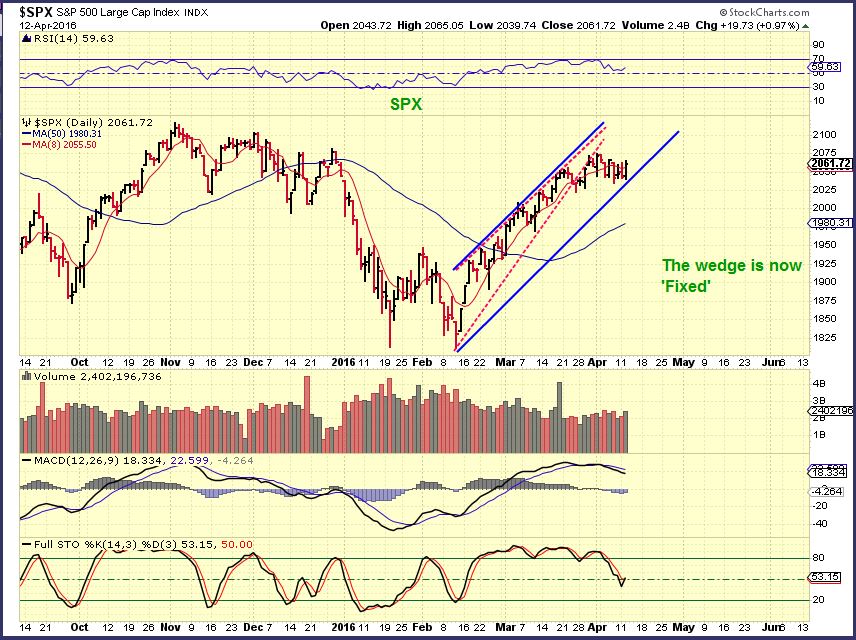 Read More
Using the April 8th (Fridays Chart), we see the markets consolidating sideways. This usually prepares it for a directional move , up or down. In this case, it can also take that bearish wedge and allow it to become a channel.
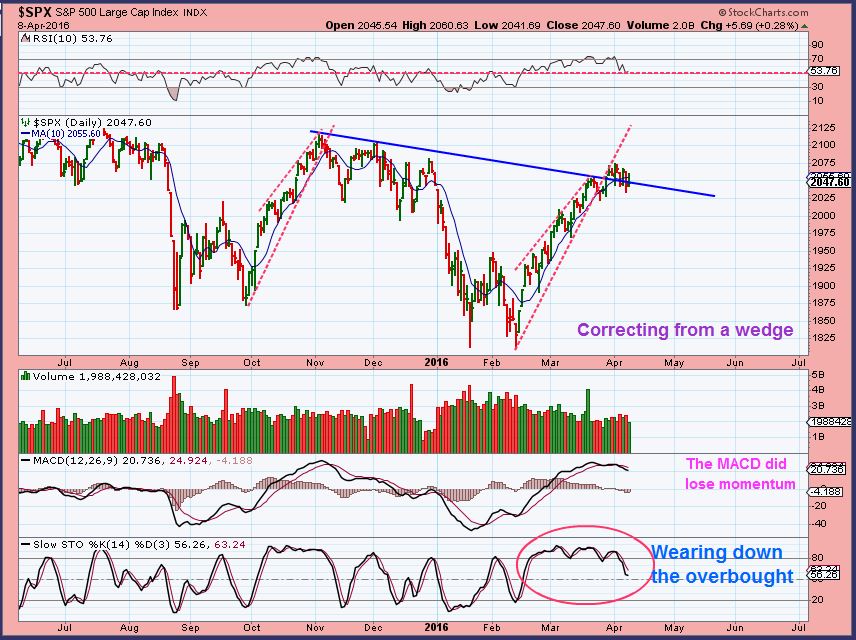
The Markets continued that sideways move on Monday...
Read MoreThe environment for trading in 2016 has been excellent for traders and investors that knew where to look. If you have been a subscriber since January, then you have seen so many trade ideas blossom and grow. We have been finding various sectors that had bullish set ups that many were actually afraid to trade in. Coming out of their lows, the potential has been tremendous if you know what to look for.
.
For example, just look at this one stock.
MUX - Whether you traded it, or bought and held when it was recommended, it is up over 100% from its lows.
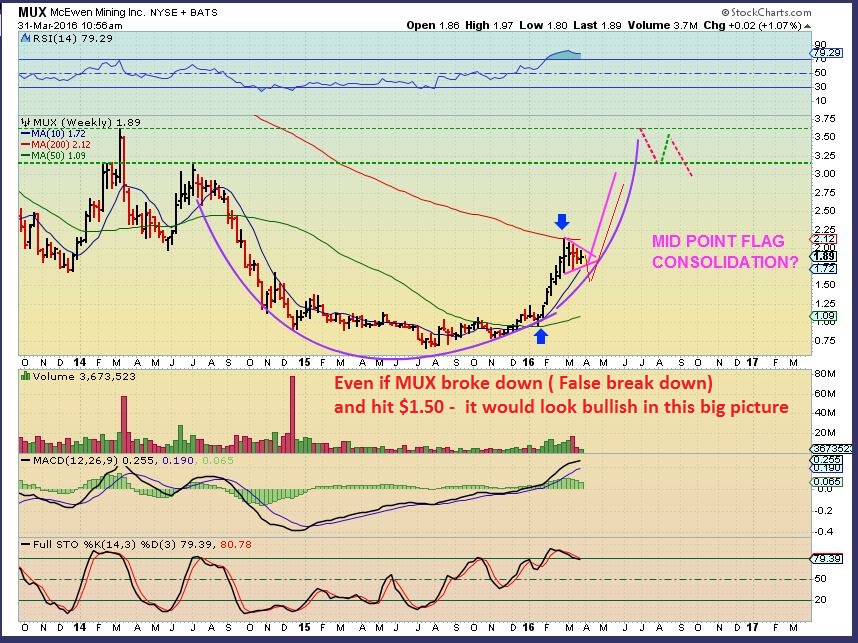
Lets look at a number of current trade set ups with conditions that favor the upside...
Read MoreThis weekend report will be slightly different from past weekend reports. I usually like to cover "Everything" in my weekend reports. I want this report to focus more on what I think could be important at this moment, and less on everything else. We will discuss the meaning of the Starting Gun too, but if you've been here for a while, I would imagine that you know exactly what I am talking about.
.
SPX - Less important right now to my current trading. See Fridays report for thoughts on the SPX.
 Read More
Lets review a few things on this final day of the trading week
.
Read MoreSigns of strength are popping up everywhere...
.
April 4th - I've been expecting a dip down to a dcl.

We had the Fed Minutes released today and the SPX ( or markets in general ) is NOT breaking down. These markets are not breaking down at the 13 sma, and they look like they still want higher prices. Is this just going to go sideways as a consolidation?
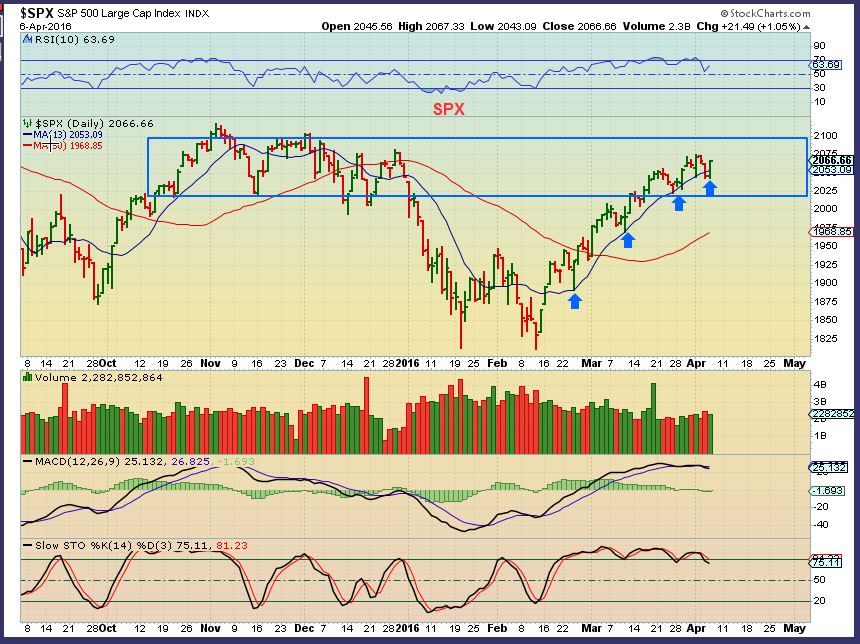
Consider this too...
Read MoreBy the end of the day, we'll all be well Fed. The Fed minutes are released today. Will the markets react? We shall soon see.
.
SPX - April 1 - Expecting a pull back
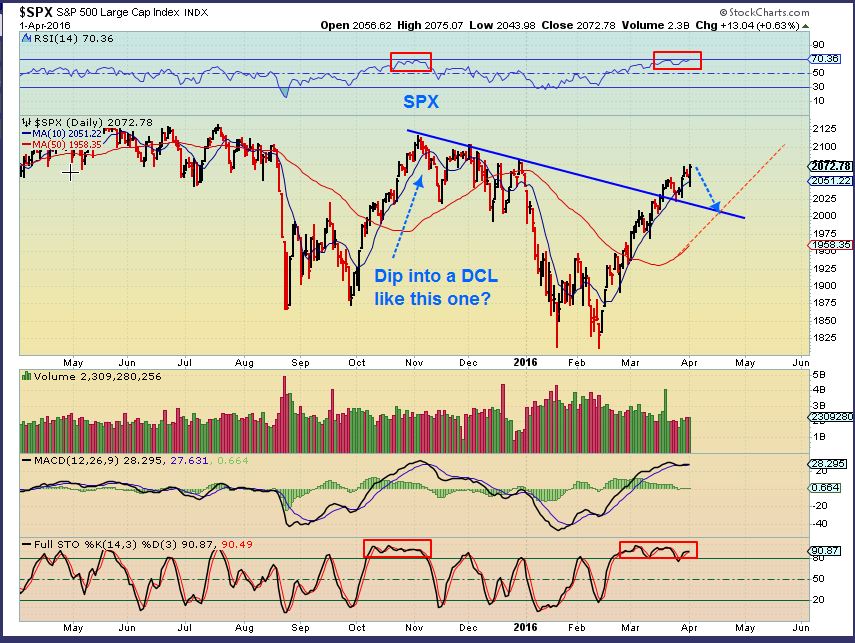
SPX April 5- We are getting a pull back and finally breaking below the 13 sma that I have been watching.
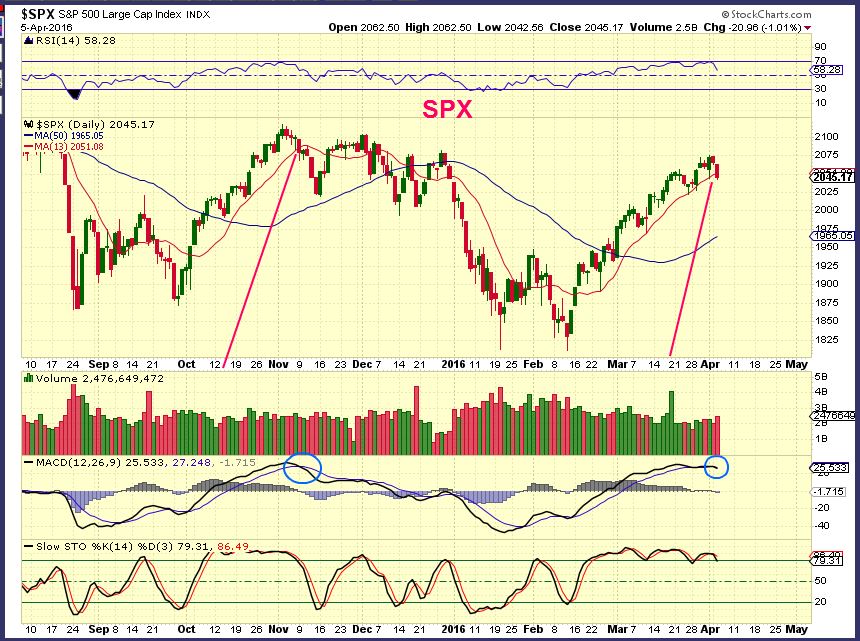
Even that MACD that was holding tight is breaking down, lets see what the Fed can do.
.
Read MoreThe various sectors of the markets continue to chug along and stretch out, ahead of the FED this week. The Fed Minutes are released Wednesday. Obviously since the weekend report was posted, not a whole lot has happened, but lets review our expectations anyway.
.
SPX- An idea from the weekend report. A pullback similar to the OCT -Nov run higher.

I captured this chart of the SPX Midday today. Notice...
Read MoreHere at Chartfreak, we have always discussed the day to day market movements, trade set ups, and the bigger picture where things seem to be heading as time goes by. So in this weekend report, lets discuss the various sectors of the markets again, short term and the Big Picture scenarios.
.
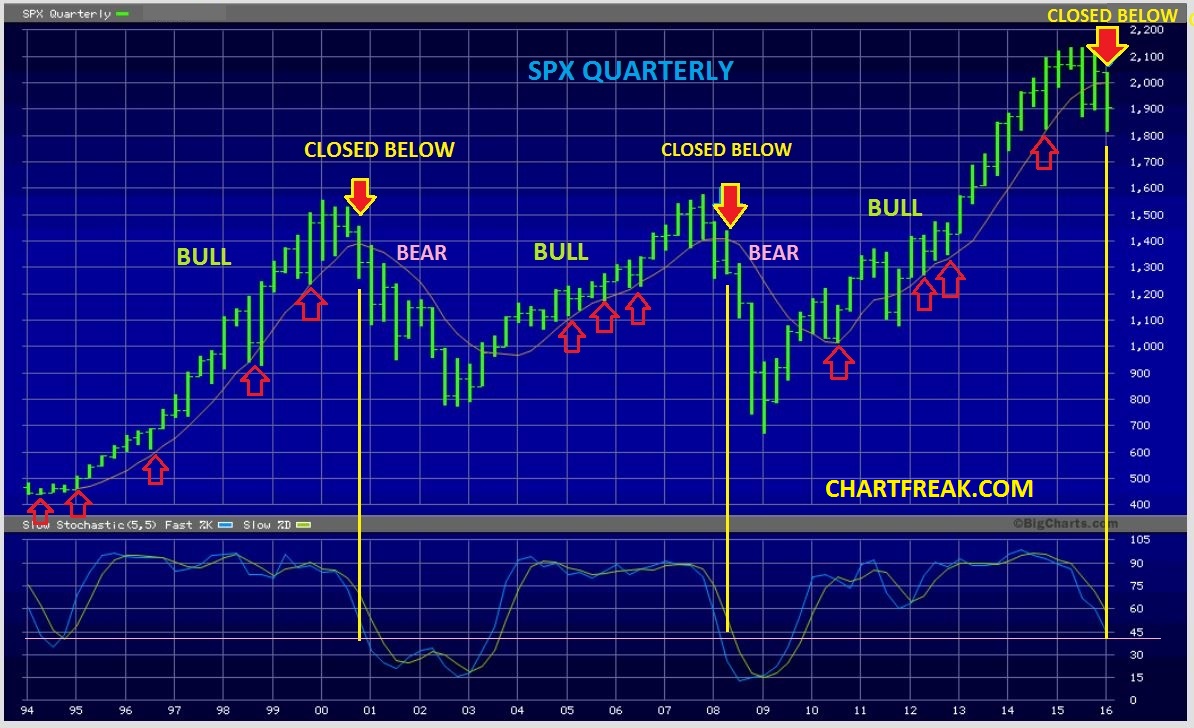
SPX QUARTERLY - If you were subscribing back in January, you may recall this chart. I was pointing out the break below certain critical areas at prior tops never recovered, and I said we would watch these Quarterly, Monthly and Weekly.
 Read More
The Jobs report was released and I dont really see anything that I didn't expect at this point. Since it is the last trading day of the week, I'm just here to do a quick review.
.
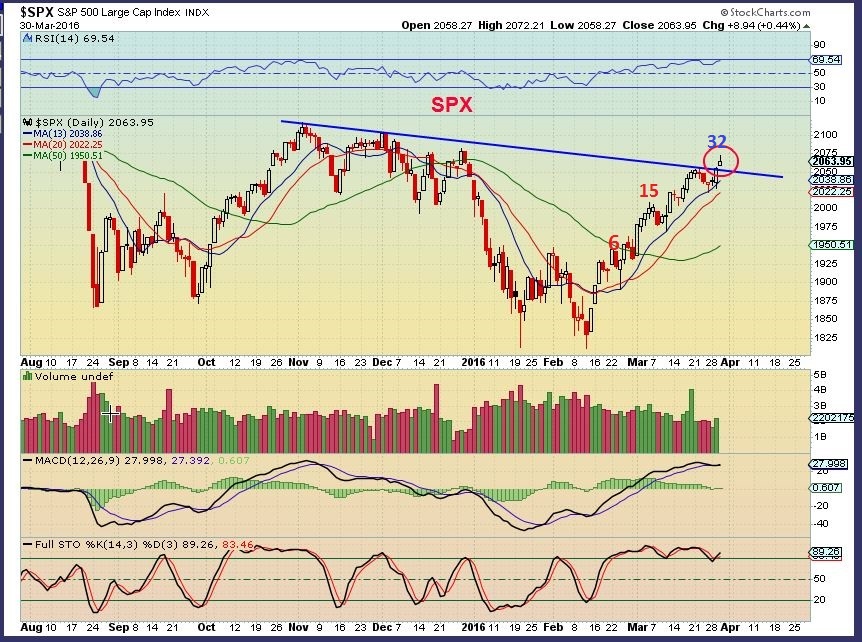
SPX - This was the chart in the Thursday report. I expected a pullback with that toppy candle Wednesday. It may not be a huge pullback, I do expect another run higher in the next daily cycle.
 Read More
Scroll to top

 Read More


