You are here: Home1 / Premium
The past few weeks of trading have been very good. Active traders have been able to find set up after set up, especially in Miners and now Energy. Some that Bought Miners in late May and Early June are still reaping rewards, and we have been looking at Energy trades for the past 2 weeks too. I am just a little torn about what I am seeing in some areas. For example, The General Markets broke to new highs and consolidated, but the VIX is very low. Also I’ve mentioned the lack of follow through in Golds Pop at the open for the last 3 days, etc. Lets go through our weekend update and review our weeks activity.
.
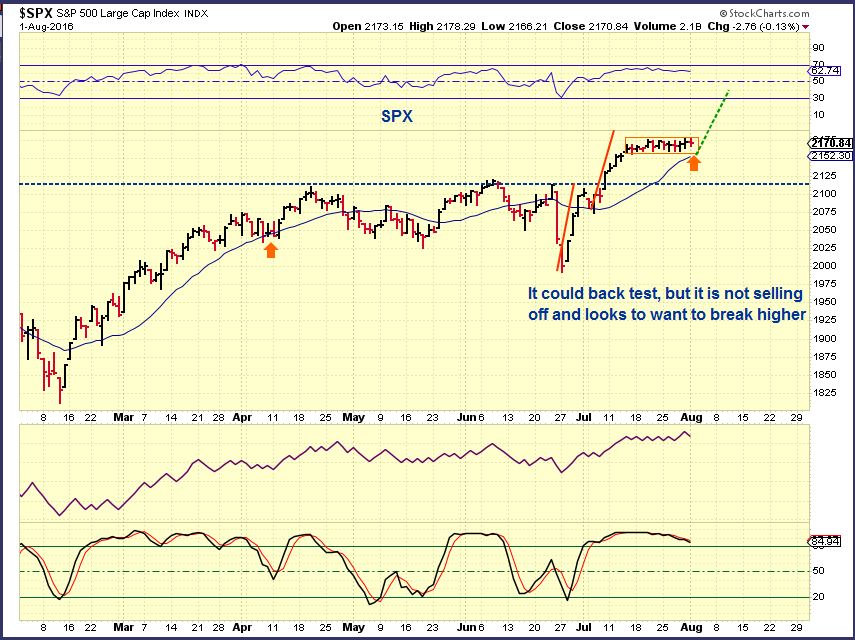
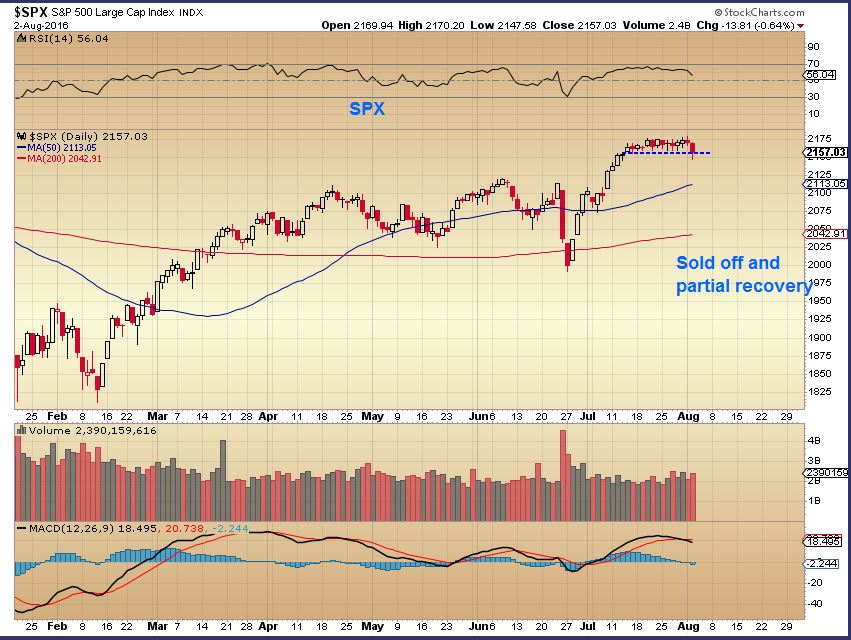
SPX – After a long sideways consolidation, we had a pop and basically more consolidation.
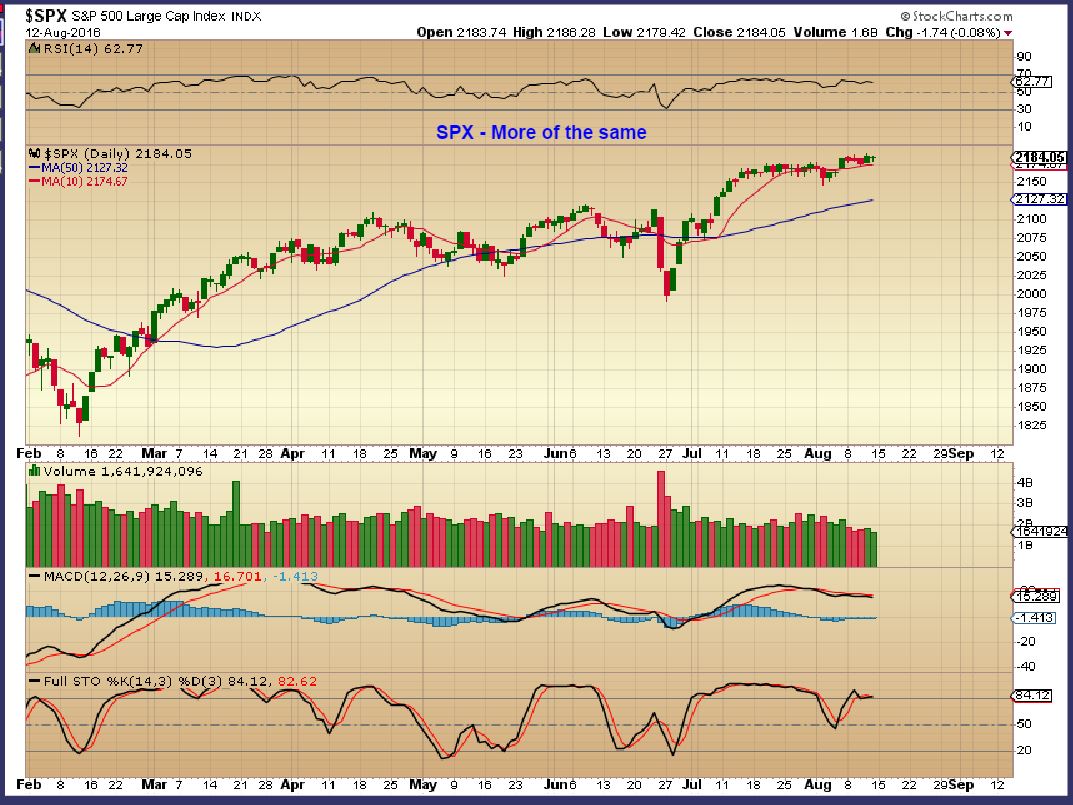
The Markets should have a strong move after such a long consolidation, but so far they are just continuing sideways and the VIX is at a point that usually ushers in a temporary top. Cycle-wise, we are due for a DCL soon, so I’d expect that we get a drop soon.
.
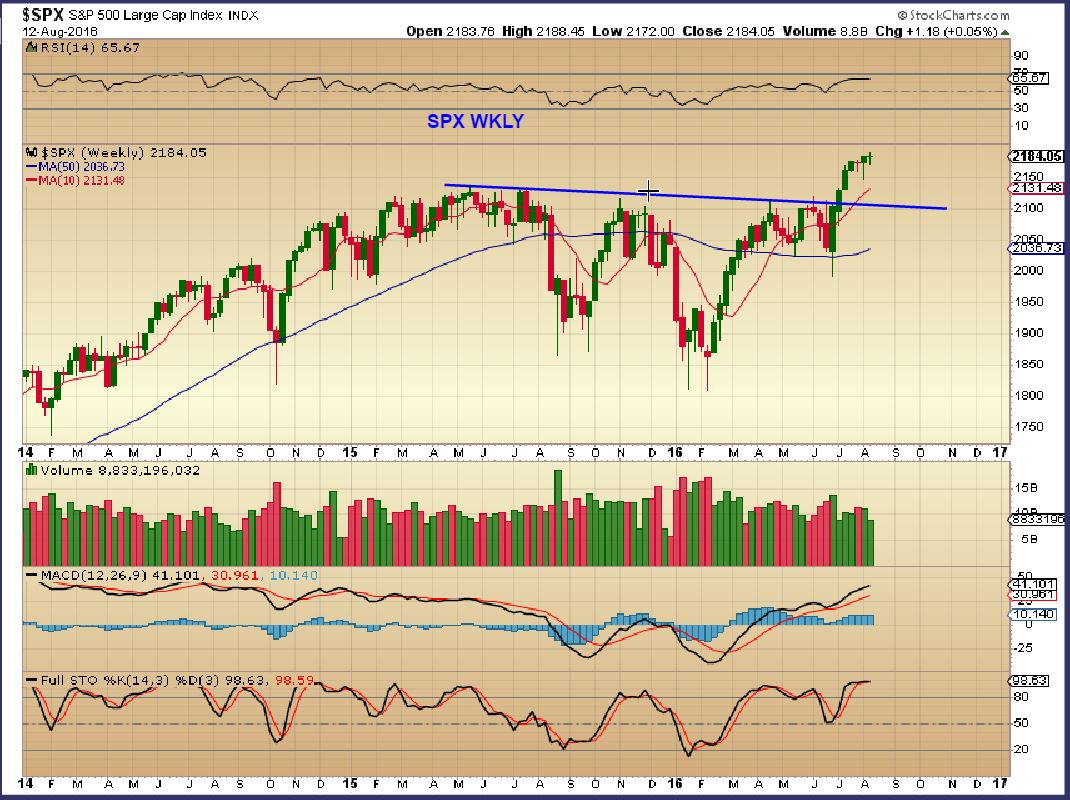
SPX WKLY – That drop could back test the break out or the 10ma.
Read more
I wanted to share a thought on Gold, Miners, and Oil
.
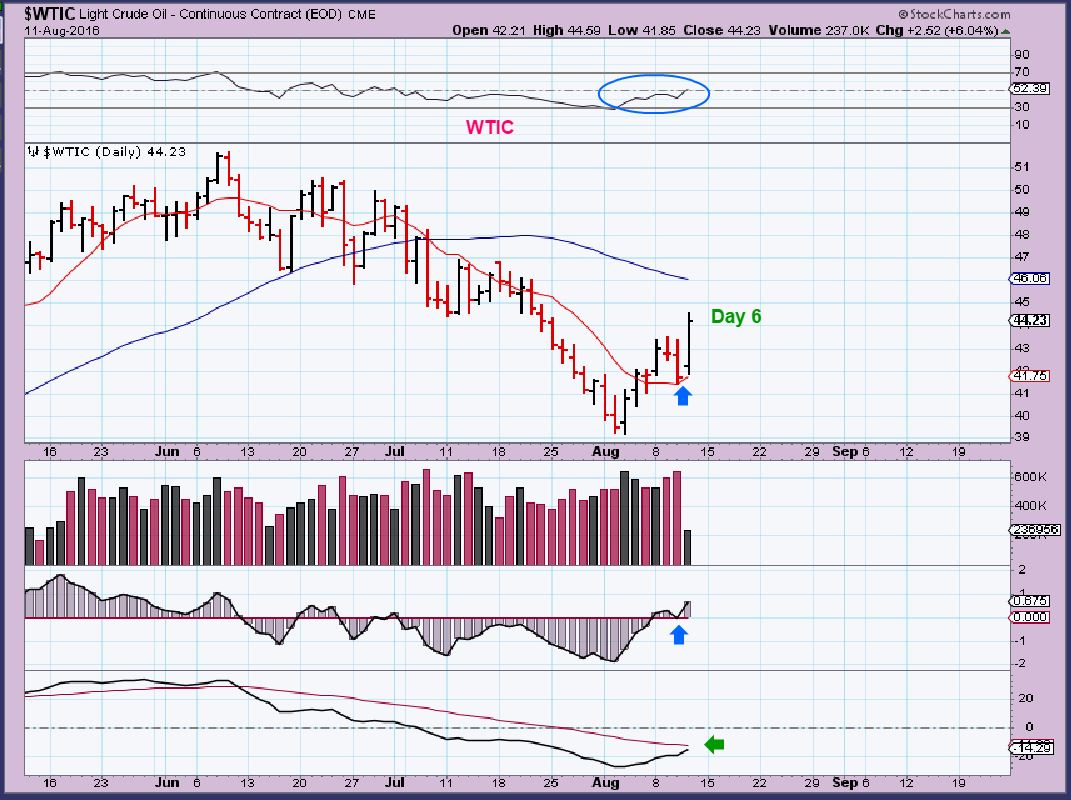
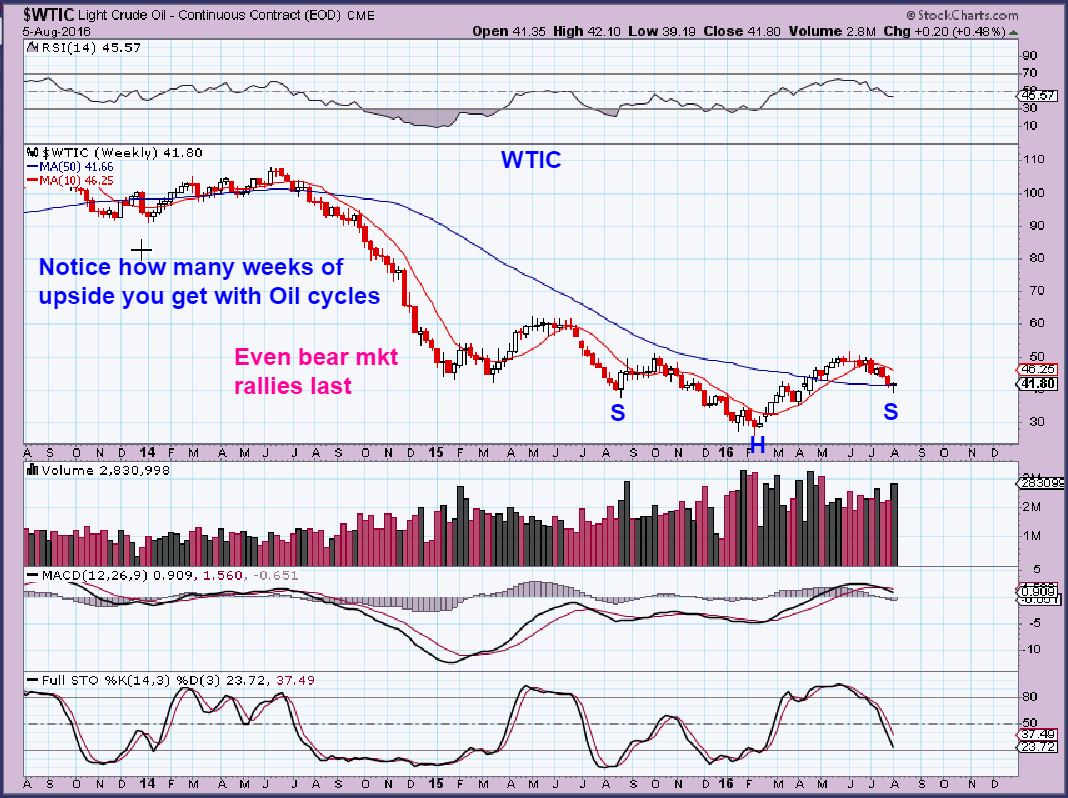
WTIC – Oil remained bullish with the bullish follow through on Day 6. There may be resistance at the 50sma, but so far this looks good.
Read more
We were expecting the start of a pull back, so I posted this NASDAQ chart along with the Vix and a few other charts
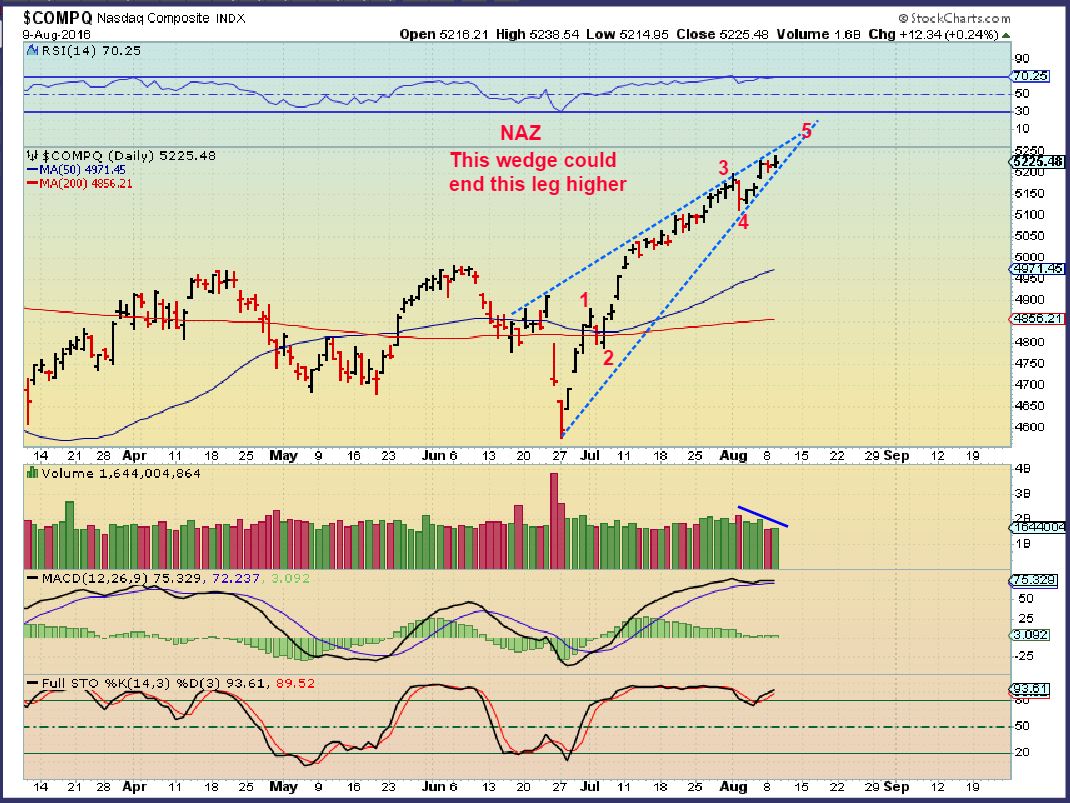
Now lets look at the latest developments...
Read more
Along with our market review, I want to discuss some of the selling we saw in Oil and Energy stocks Tuesday. What are we looking for in the pull back that we see? Should we be scooping them up, or not? Lets review our markets…
Read more
I am seeing step by step progress in the areas that we discussed in the weekend report, so I am going to go right there.
.
This was my weekly Oil chart
Read more
And the good news is, I see quite a few bears falling asleep again. Our trading has been fantastic in 2016, especially in the beaten down Precious Metals sector, Commodities like Steel and Aluminum stocks did well, and Oil and Energy. The bears had attacked these sectors for quite a while, but now it seems that when one sector runs strongly and then gets a little tired, another one that was selling off begins perking up. That seemingly bearish selling fades and the baby bear goes to sleep, allowing us to do some sector rotation in our trading.
This weekend we’ll discuss which bears look to be calling it a day, and also review Gold, Silver, and Miners. We should discuss what happened Friday and whether it is the start of something big, or just a little noise. lets review…
.
SPX – We’ve been watching this constructive consolidation for a while. This was the Aug 1st chart.
SPX – The Jobs report gave it the needed boost to put any thoughts of a bearish drop to sleep for a while. The dip 3 days ago was likely a 1/2 cycle low of this daily cycle.
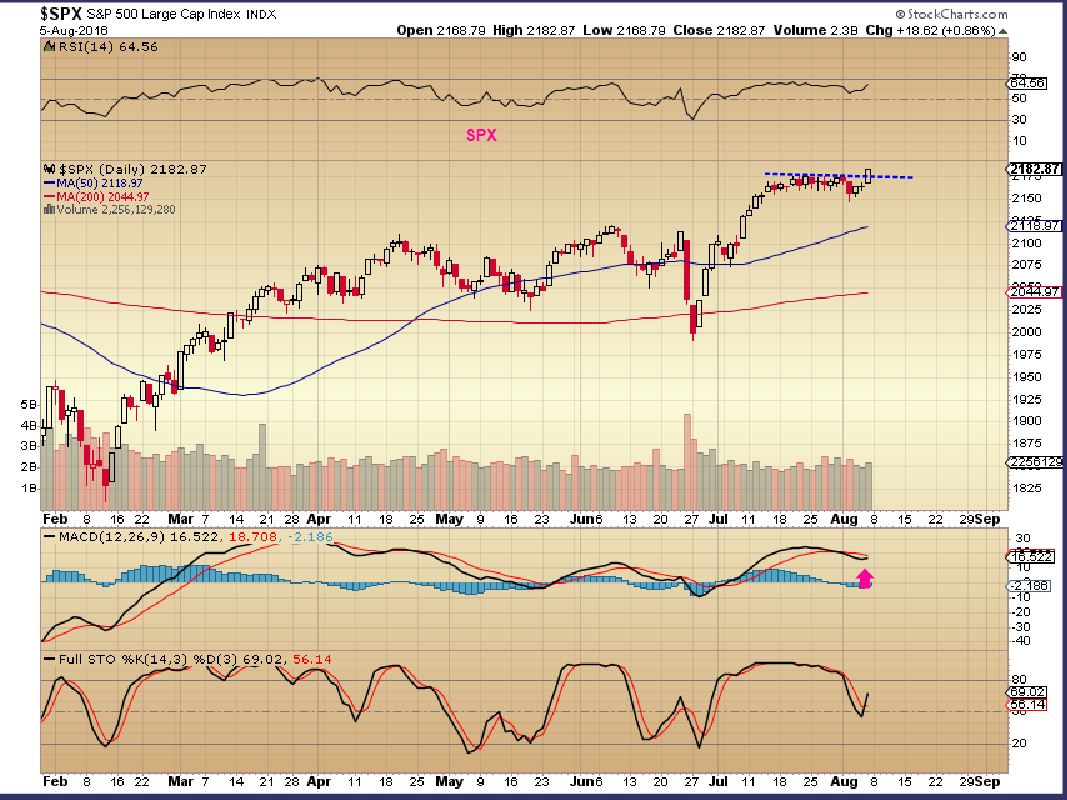
Lets look at the weekly chart …
Read more
The May and June Jobs report numbers came in very low, and it was given an ‘F’ by many reviewing it. If we get another low number this morning, it will likely be graded an ‘F’ too. What if the numbers suddenly come in strong? It’s probably worth an ‘F’ too, for ‘fudging the numbers’. 🙂
.
Today we’ll take a look at Oil, Gold, Silver, Miners and some energy stocks that seem to be setting up bullishly.
Read more
Things still seem to be progressing along in the various sectors of the market that we have been following. Lets take a look.
.
SPX – This sideways move is really a bullish consolidation. As time goes by, we get deeper into the daily cycle, but this is holding up rather bullishly. On a wkly chart, it is forming a very bullish pattern.
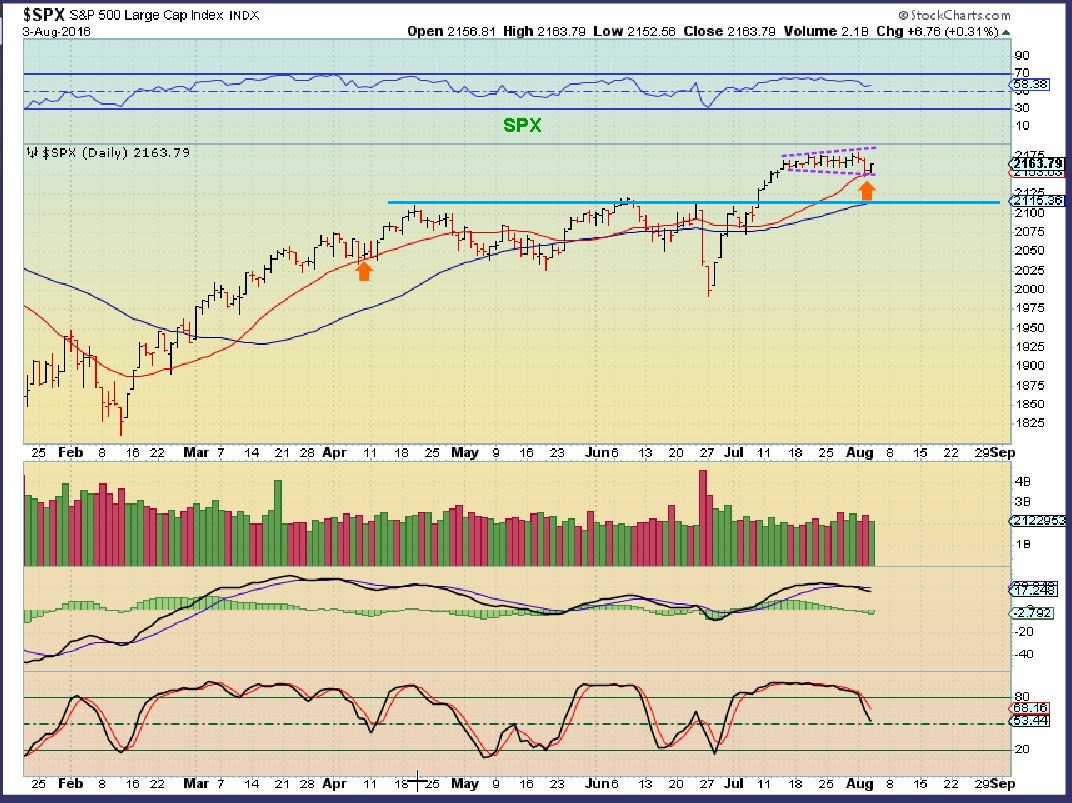
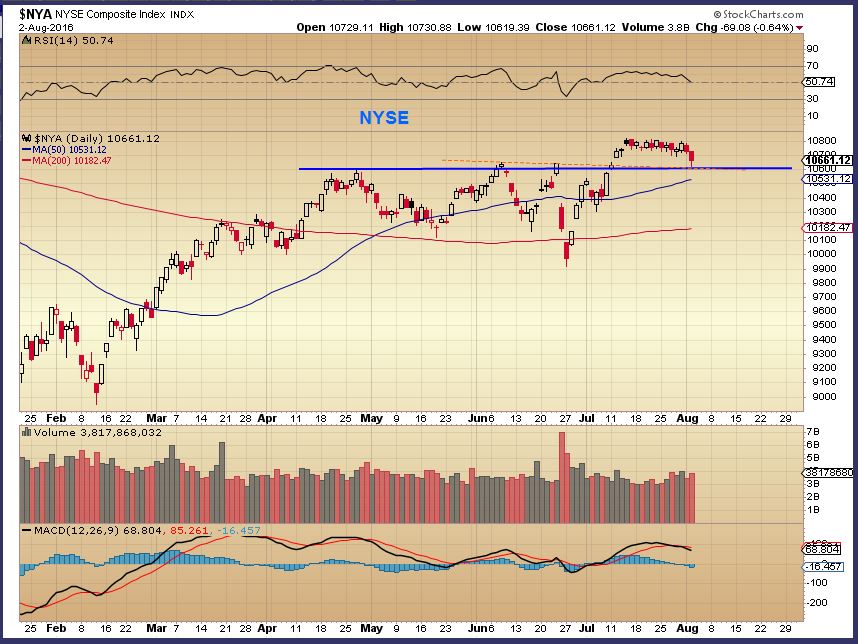
Tuesday we saw this back test on the NYSE, and it held and reversed higher Wednesday.
Read more
SPX – The SPX has been consolidating sideways and Tuesday it started to sell off a bit more. I mentioned that we could get a back test, but it recovered a good amount into the close. So not a whole lot has changed here (again).
A bit of a different look for the DOW and the NYSE 🙂
Read more
SPX – Not much has changed over the past several days, but consolidations often lead to strong moves.
Read more
Scroll to top