You are here: Home1 / Premium
Yesterdays reports called ‘Baby Steps’ discussed how the markets have been moving slowly along, and how that can eventually lead to a particular outcome. Well, most areas of the markets continued that slow crawl yesterday. If you read yesterdays report, nothing has really changed in many areas, except for Natgas. Today we will briefly review and discuss a few of these areas again.
.
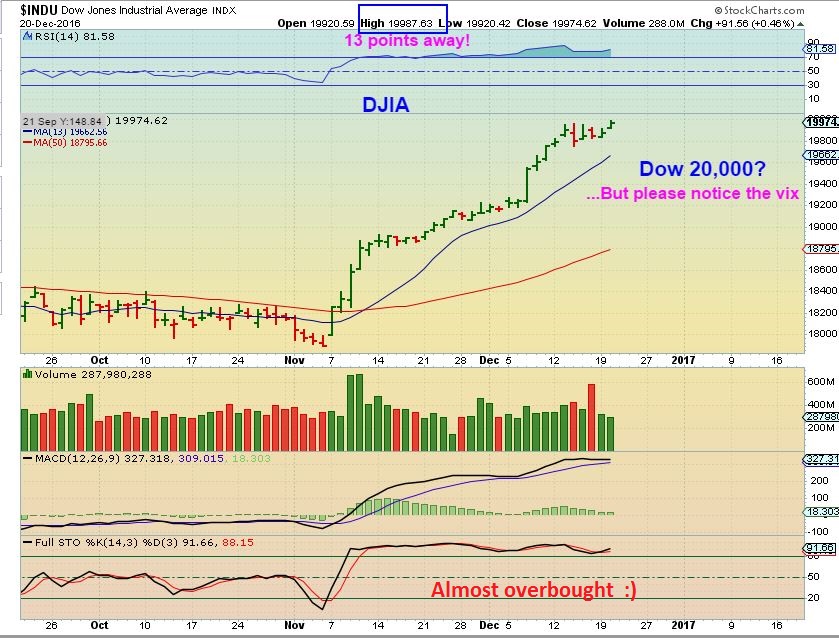
Did the Dow hit 20,000 yet? It was only 13 points away when I pointed out this chart
Read more
On Tuesday, the markets continued to take some baby steps. Not only did we see The DJIA take more baby steps toward Dow 20,000, but the VIX took baby steps toward the lows of the year. Add to that Oil, Gold, and the Miners taking baby steps of their own. Lets take a look and see what direction things seem to be heading in.
DJIA – The Dow was only 13 points away from tagging the big round number 20,000. Since the VIX is below 12, we would usually expect a top to be forming, so the big party may be short lived once the Dow achieves that goal.
Nothing has really changed since the long weekend report, so lets just review what has happened on Monday.
.
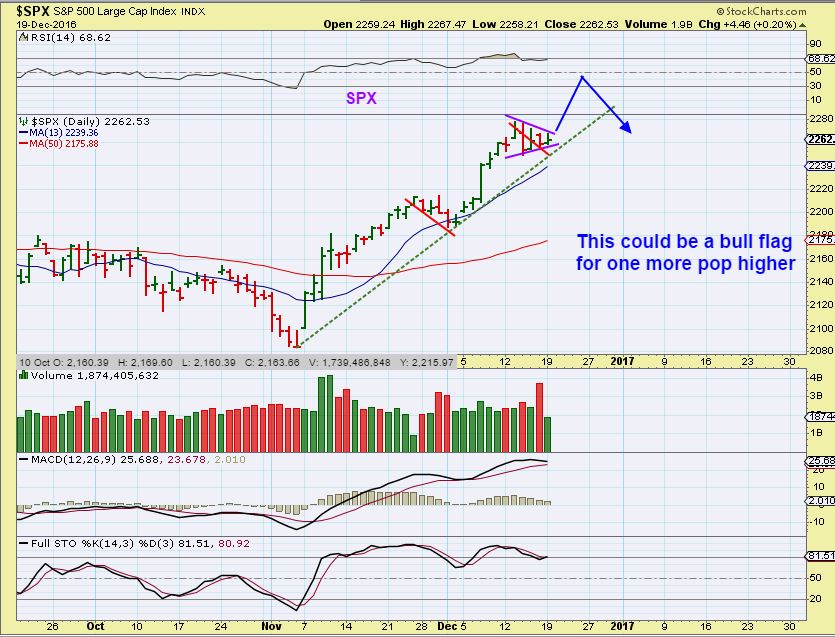
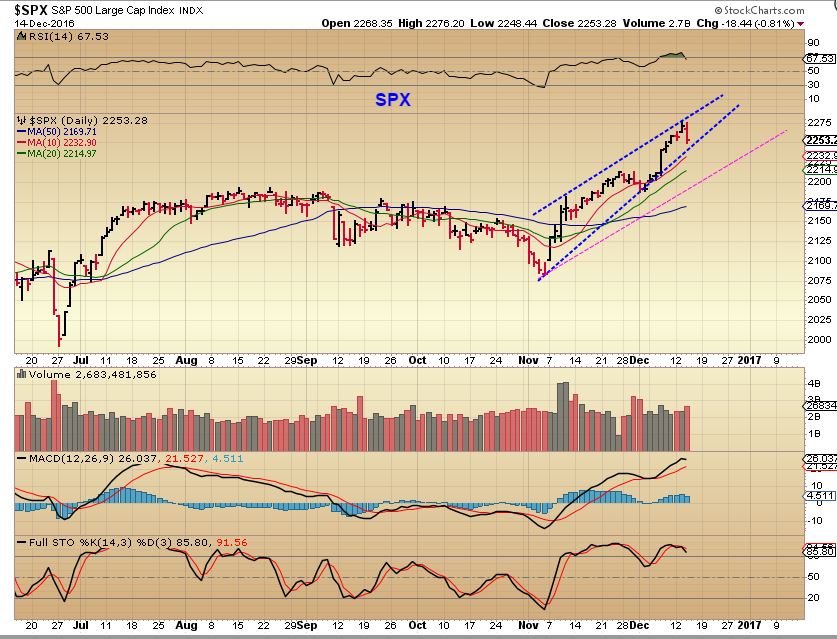
SPX – We are due for a pullback into a dcl soon, but this looks like a bull flag forming, so one more pop higher could be in order first. A pop now could help the DJIA to reach 20,000 ( And then a drop would be expected).
Read more
I wanted to share a couple of trade ideas that would be considered low risk , since a stop can be placed just below the purchase price.
We have seen some unusually deep selling in the precious metals sector, so I do want to discuss whether or not there is any past ‘precedence’ in this area later in the report. First let’s discuss what has happened in just the past week. To the charts…
.
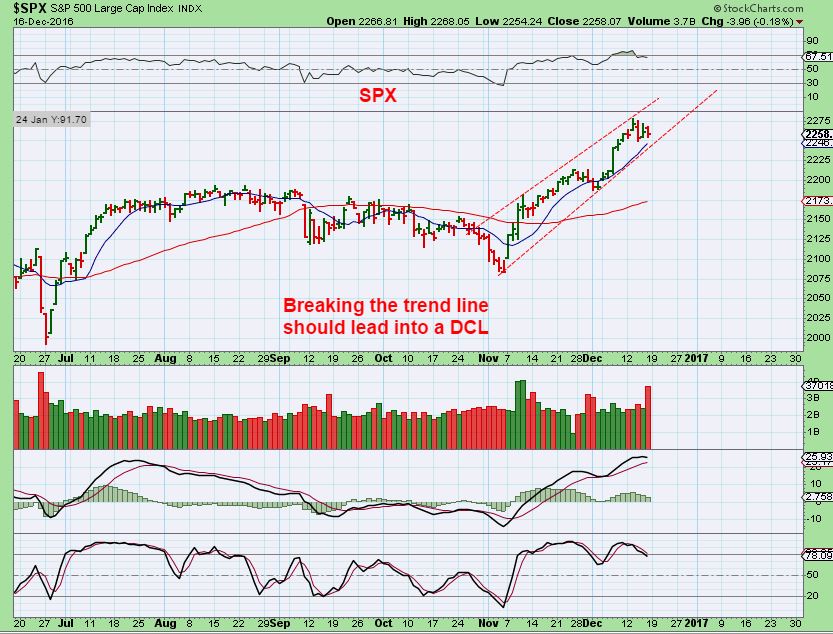
SPX – Dec 12th, I was looking for the run to stall, and we should see a pullback.
SPX – We have stalled and pulled back a little. A break of this trend line could bring a little more selling, but this will likely be a right translated daily cycle and we can expect higher highs on the next one too. The red line is the 50sma.
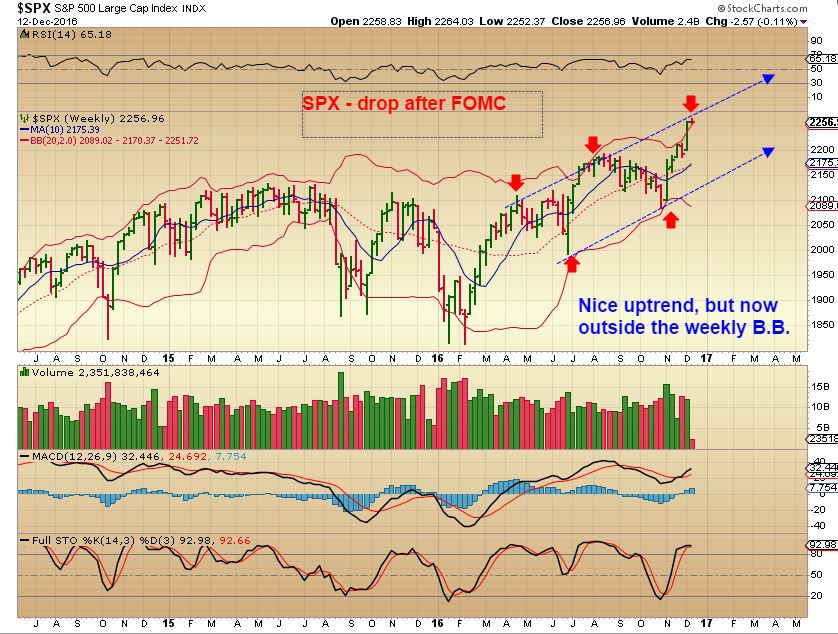
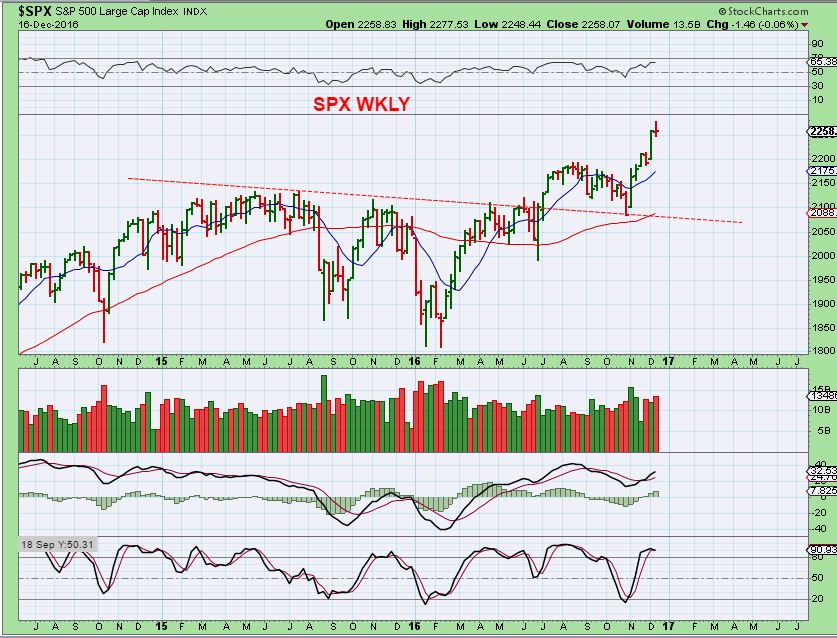
SPX WKLY – And we do see a form of topping candle on the weekly. Falling to the blue line at 2200 would also back test the break out.
Read more
Many sectors began to sell off with the interest rate hike Wednesday. Some were sectors we expected to sell off, others were expected to snap back. Will we get the snap back on Thursday and Friday? Let’s discuss what we should be looking for.
SPX – From Monday, the markets were outside the B.B. on a weekly basis, so I would have expected a dip by the end of the week.

Read more
I’ve been wanting to answer a frequently asked question and that question is,
” What will happen when the Fed raises interest rates?” Let’s take a look at what has happened in the past, and then maybe we have some historical precedence to go by.
Read more
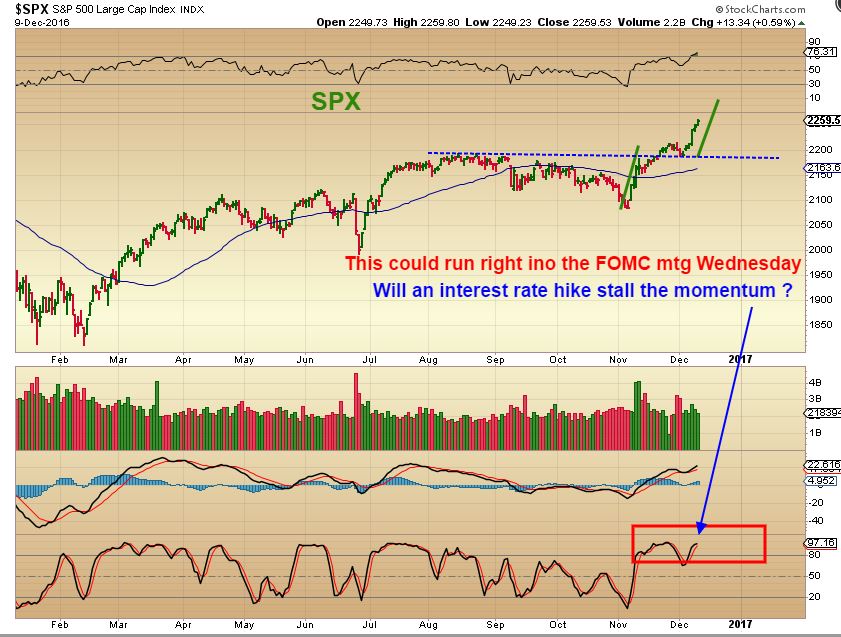
We are one day away from the FOMC meeting that is expected to result in the first rate hike of 2016. After a quick review of the markets, we’ll discuss some action in the markets Monday that may be of interest to many of us.
Read more
The general markets are flying high, but the Precious Metals are still flying low. Let’s take a look at last weeks market action.
.
SPX – Please read the chart
Read more
Scroll to top