You are here: Home1 / Premium
Is what Peeking or peaking? Let’s start with the USD-
.
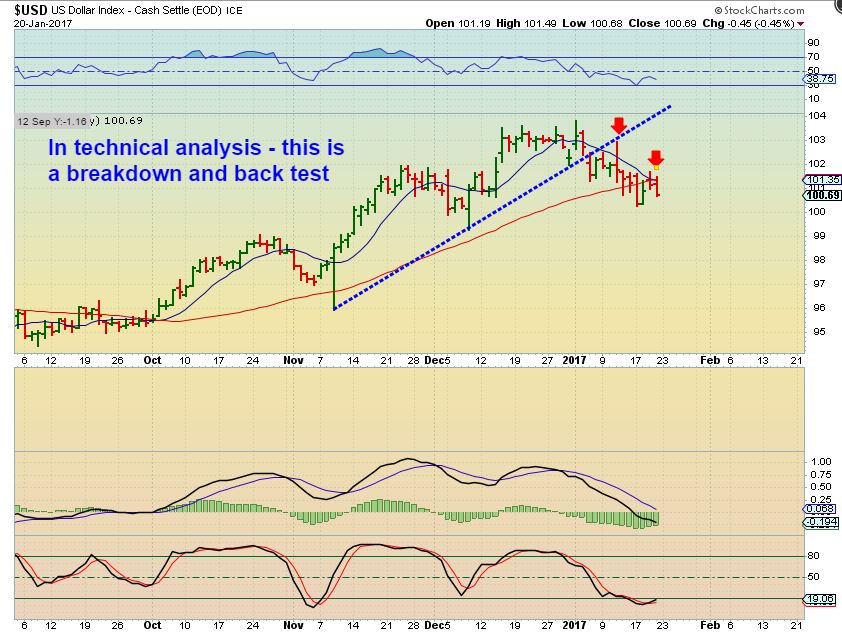
The USD was rejected at the 10 & 50 sma last week, but it is in the timing area for a bounce.
Read more
The weekend report discusses the current set ups in various sectors, with a bit more focus on the precious metals sector.
.
SPX WKLY – I’m not saying that the General markets cannot go higher, this riding along the upper wedge can continue, but this wedge does tell me that I should expect a pull back sooner or later. We’ll continue to monitor that as it plays out.
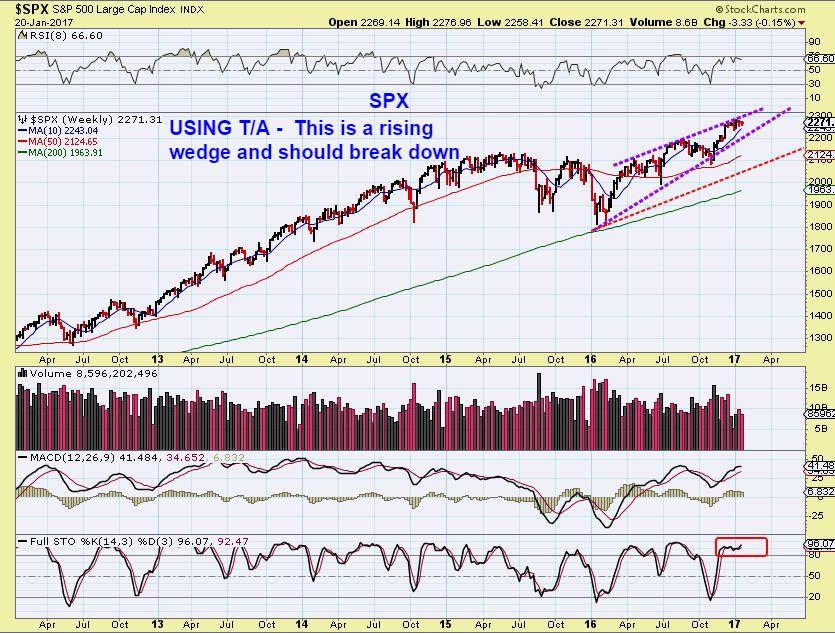
Remember that I mentioned this last week too…
Read more
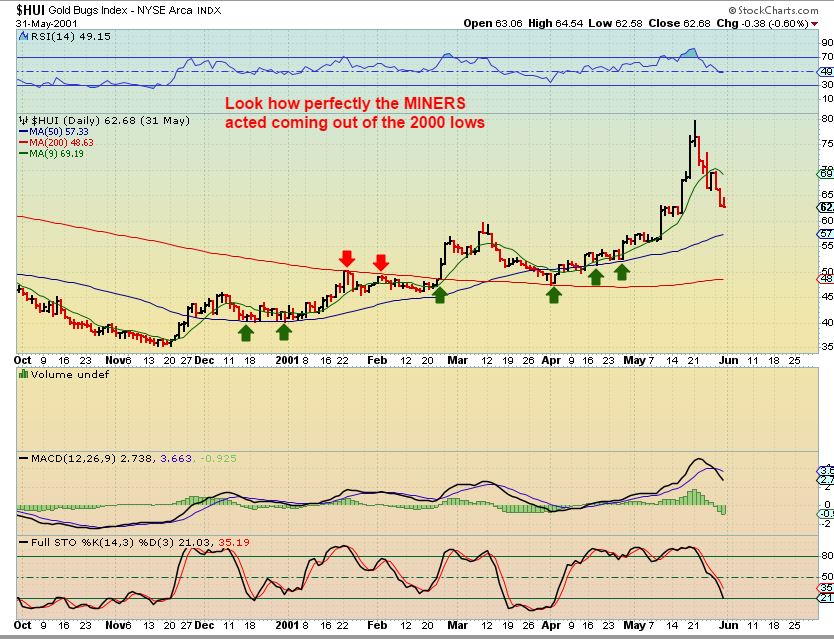
I wanted to start the Friday report by looking at the HUI in the year 2000, as it began to rise out of the bear market lows. We will also discuss a few other things pertaining to the Mining sector, including GDX and its current run higher.
HUI 2000 – This run higher was so smooth and predictable. Notice how it found support and resistance repeatedly around the 50 & 200sma. This was a very smooth run.
Now I want to direct your attention to Gold at that time…
Read more
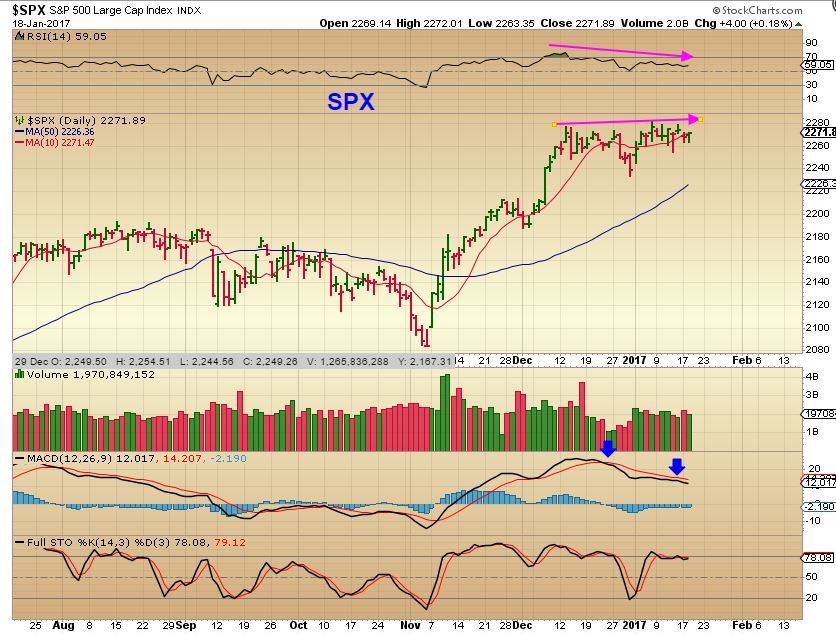
I’m looking at the General markets and I’m rather neutral going into the U.S. inauguration. The Markets rallied very strongly when Trump was announced the winner of the U.S. elections in November, so they could break higher and rally again, but let me point out a couple of bearish signs now.
Read more
We’ll discuss the theme after a quick review
.
There was no real change in the General Markets from the weekend report, however the USD did move as expected. In the weekend report I mentioned that I see weakness in the USD chart. It broke below the 50sma Monday. We can get a bounce in time, but I expect the USD to continue to roll over, as noted in the weekend report.

Read more
It has been a great start to 2017, with various sectors bullishly marching higher and plenty of trade ideas to profit from. For now it is time to relax on a 3 day weekend and just review where we find ourselves after last weeks trading.
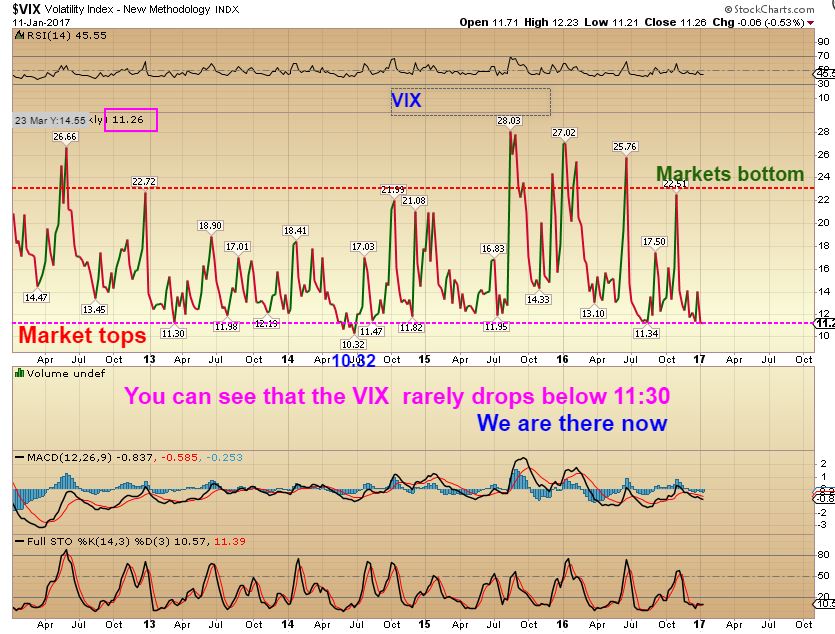
VIX – I do like certain things about the set up of the General Markets, but the VIX is about as low as it gets before the General Markets form temporary tops. I don’t use the VIX to time a market top or bottom exactly, but it does often warn of volatility to come. When the VIX hits the 11 area, we are alert to a possible top forming soon.

So let’s look at the SPX ..
Read more
There are times when we need to take note of a few cautionary signs within the markets that we are trading in. Let’s take a look at a few of those signs that are popping up now.
I posted this chart of the vix as a warning sign. This is a 5 year chart and we are in an area where temporary market tops have taken place or years, so we want to be mindful of that. In the next few weeks, the markets could experience increased market volatility and toppy action.
So with that in mind…
Read more
We are back in a Traders Paradise, as many of our stock picks are lifting off and some are just plain old blasting off. Let’s do a market review and look at a few more bullish set ups.
.
SPX – Wednesdays reversal looks bullish, and after this long consolidation, we may have a mini inverse H&S followed by a break out higher. The HUGE fly in the ointment is that we have the VIX near 11.
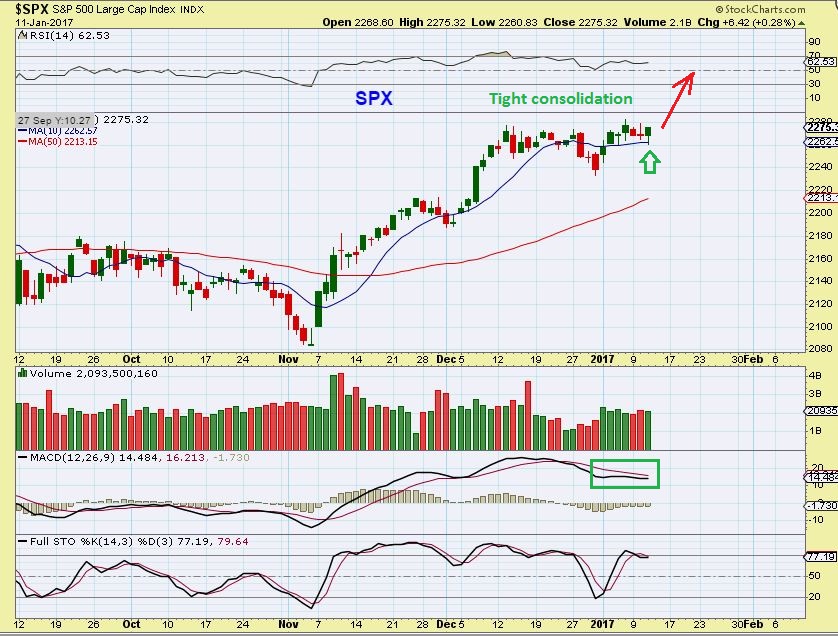
What does the VIX at 11.30 mean? I’ll show you …
Read more
As I was gathering charts for the report, I realized that many of the charts for Tuesday looked just like Mondays. That means there really isn’t a whole lot new to say in some sectors, so let’s do our review and then discuss some stock picks.
.
From Monday – no Dow 20,000
No big change – Copy / Past

Read more
After our normal market review, I wanted to share some additional thoughts about the Uranium Sector, since it has also been perking up and showing signs of life after a bear market sell off. I don’t want this to distract anyone from our current focus and trades, but my pointing out a few things here today allows the readers some time to do a little additional research of their own if they are interested. By the end of this report, you will see why I think this could be worth bringing up.
.
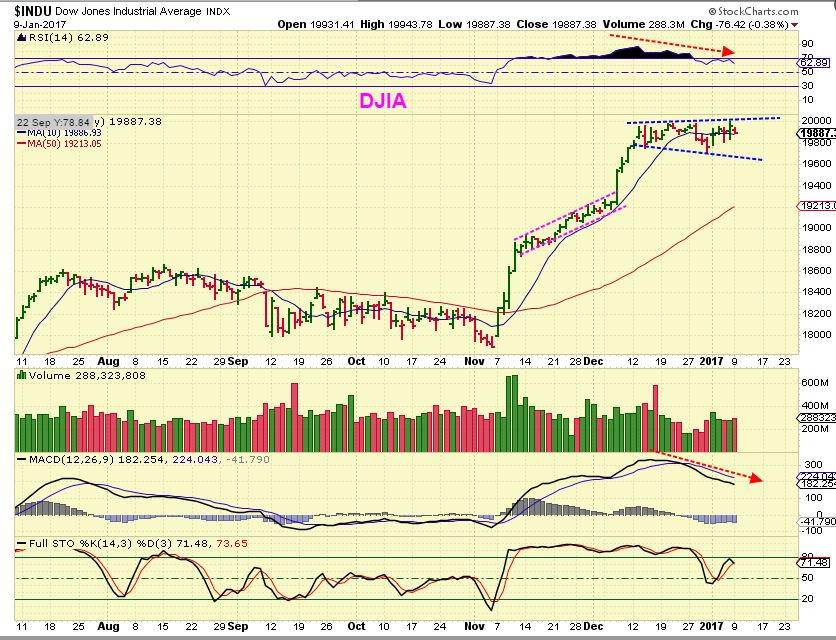
DJIA – No Dow 20,000 yet. This really doesn’t seem to be a true magaphone topping pattern, but it is close. A flat top pattern would be bullish, so I’m watching for a break of either blue line.
Read more
Scroll to top