You are here: Home1 / Premium
If you want to look good while you’re performing tricks on the slopes, you definitely need to stick that landing. Let’s see if we had that in Thursdays trading…
GOLD – We were looking for a higher high to give us a peak that could make this a right translated daily cycle. Gold stuck the landing with this break out, and the volume was encouraging.
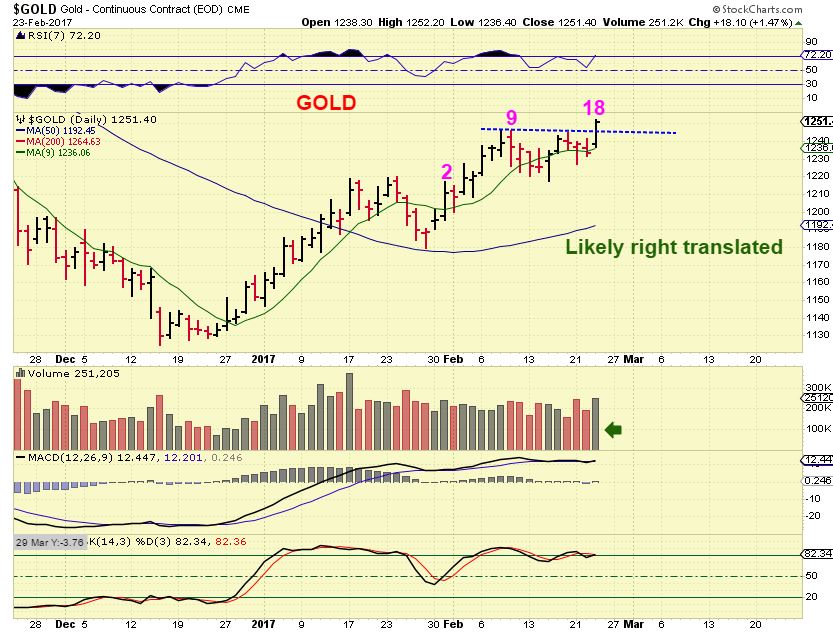
If Gold continues to stick the landing, it should make it to this target area.

Read more
The Fed Minutes were released on Wednesday at 2 P.M.. Was there any change?
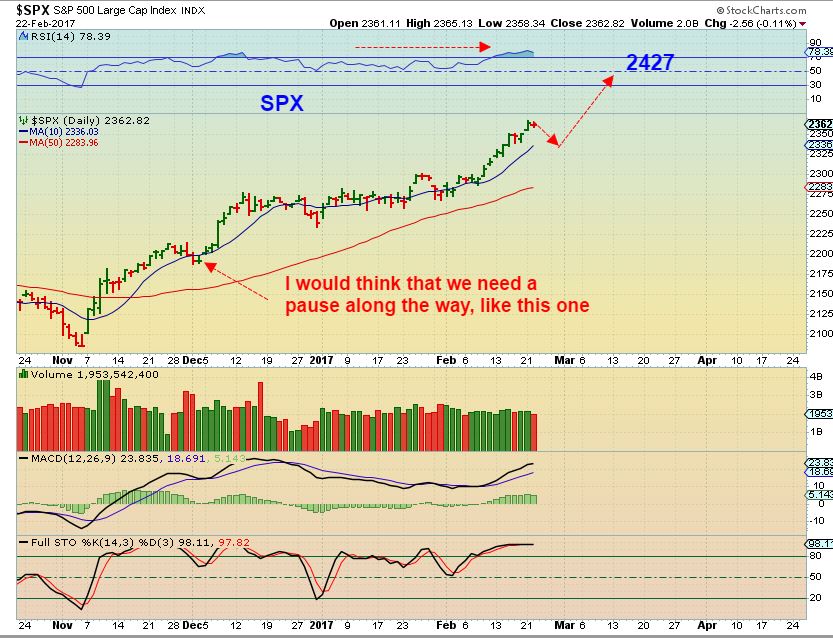
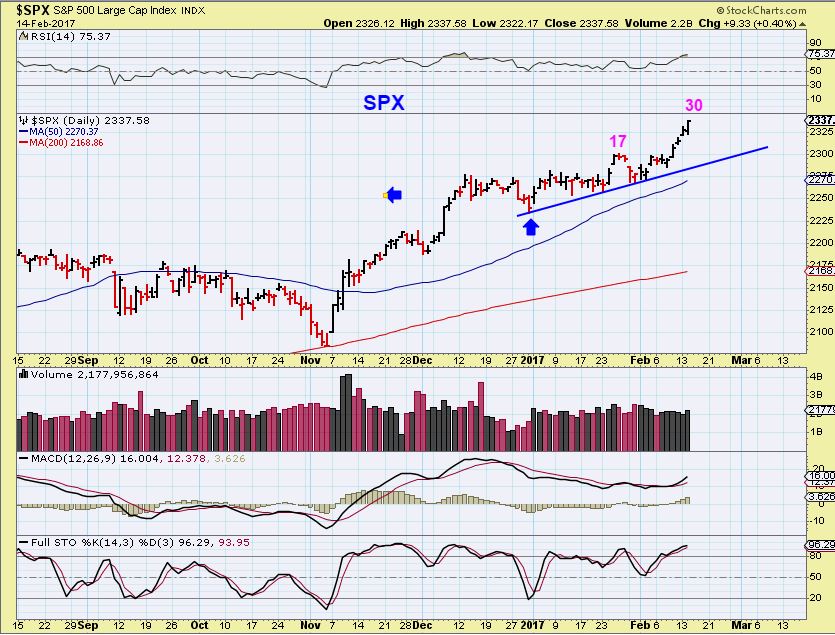
SPX – No change here. We could use a pause if we are going to reach a target of 2400+.
Read more
We’ve only seen one day of trading after a 3 day weekend in the U.S., so this report will just be a brief review of the markets and a few of the trade ideas discussed recently.
.
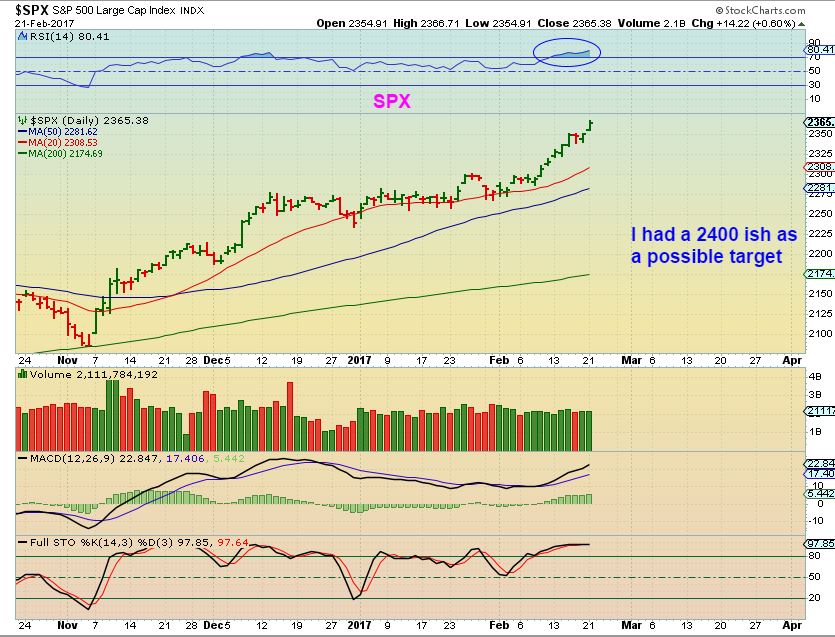
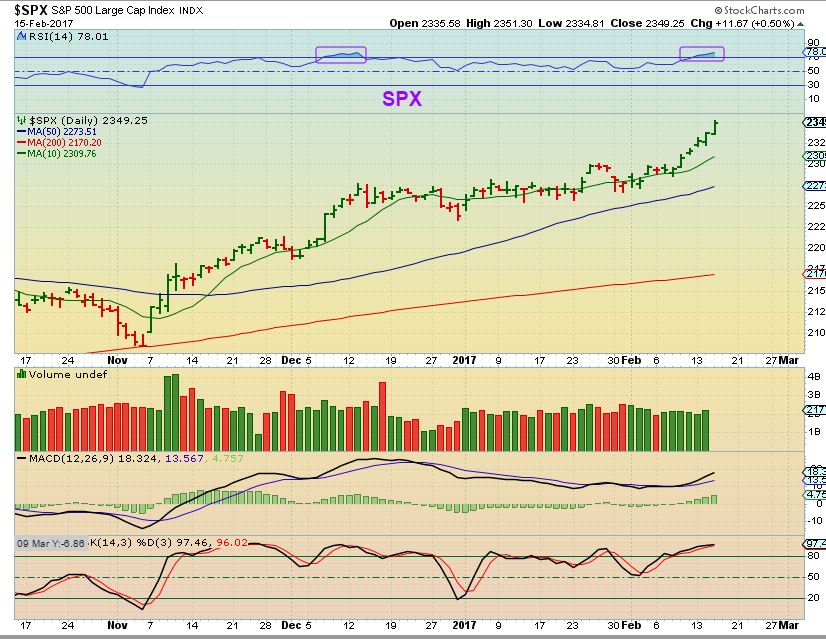
SPX – Nothing has changed here, we are seeing a strong move into new highs with no real resistance, I have targeted 2400 since the break out. It is getting quite over bougt and over heated.
Read more
I wanted to put out a bonus report on Tuesday morning. Realistically we probably have enough on our plate, so if you are happy with your current positions, please just view this as a possible heads up for possible future trade set ups or a watch list going forward. In the past few months we have been trading Energy, industrial Metals like CLF, VALE, WRN, NAK, X, etc. We have been trading in the Precious metals sector ( I also encouraged readers to buy & just hold on to some positions from the December lows forward ).
You may also recall my special report in December on another sector that turned very bullish. We will discuss that a bit further here today, as well as what could be some more low lying fruit in another sector that may be sending out some bullish shoots. These are just extra trade ideas for the active traders. Let’s take a look…
Read more
For the weekend report, I often feel the need to review the Bigger Picture to gain perspective. I am going to do that this weekend too. To open this report, I’m going to start with a scare tactic. Yes, that’s odd, but I see it all the time in the markets, and I believe that there is no better way to face your fears than to, well… Face Your Fears.
.
This Chart is an actual Real Bull Market that I have clipped for us to look at. I am calling it Gold ( though it wasn’t) and it has a similar movement to what we just saw when the Miners ran higher in 2016 and peaked in July/ August, and then sold off. The Fear tactic is that we always hear “Gold is in a bear market and must drop below $1000 to re-set.” Well, now I have heard that this was just a bounce and is an A-B-C-D down to $1000 in Gold & will put the Miners into single digits. Please read the chart.
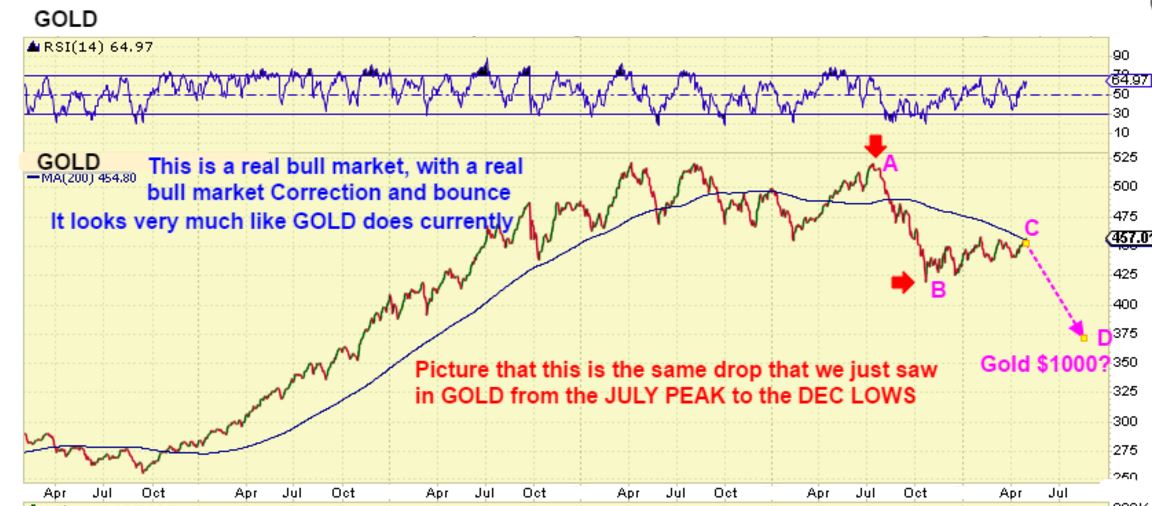
Compare it to GDX currently – We see the big run up in 2016, The peak in July/ August, followed by a strong sell off. All very similar to the above chart. Are we in for a massive sell off? That is what I’m starting to hear again. “GDX has hit resistance and is just too weak to push through.”
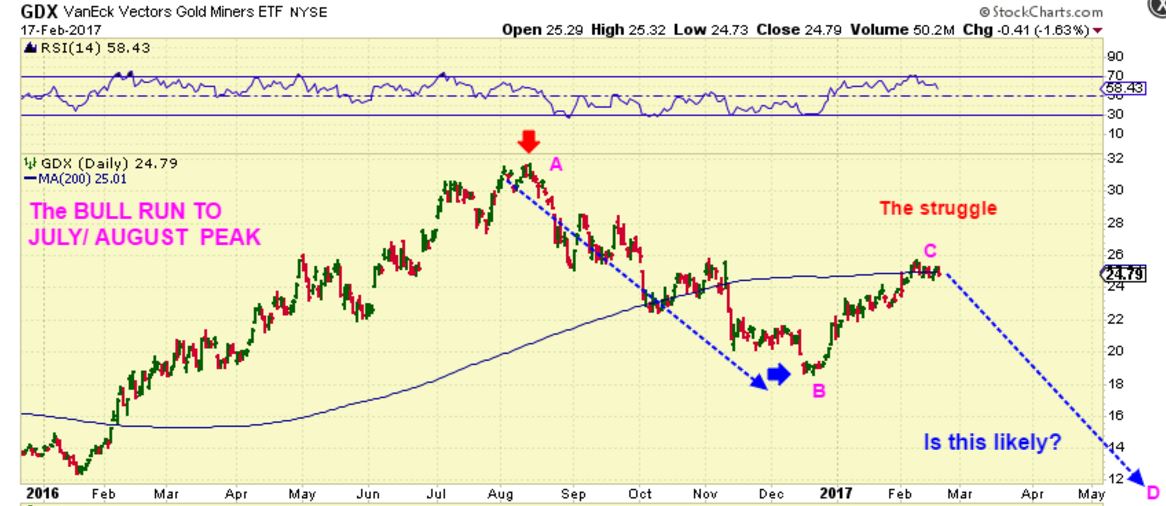
Now that I’ve got your attention – lets look at the bigger picture in all sectors of the market, and answer that nagging question that is being raised above.
Read more
There are times when I feel like I can’t even find a solid trade set up, and then there are other times when I feel like there are plenty to choose from. Right now, I feel like I’m seeing a lot of trade set ups. This Friday edition is going to feature some trade set ups after a quick review of the USD, NATGAS, and Precious Metals.
.
Read more
Sometimes building bridges by means of consolidation pave the way to higher ground. I will discuss that later in the report, after a quick market review.
.
SPX – Again, this is like a melt up phase, and if I were long I would use trailing stops and let it ride. That long bridge of consolidation has built up some energy.
This was eye opening…
Read more
Tuesday had Janet Yellen speaking before congress, and the USD and Gold both actually acted as expected. That’s a relief. Let’s review the markets and then of course we have to discuss the day that Nak got Whacked. What can we expect next after that big reversal?
.
SPX – The markets are on their way higher after a long consolidation. That consolidation gives energy to the move and even though the vix is low, I would just use a trailing stop and follow this higher. It is turning into a nice steady move higher at this point, and these can just melt upward.
Read more
I believe that Fed Chairman Janet Yellen is meeting with congress on Tuesday to discuss monetary policy. This could affect the USD and Precious metals if she mentions inflation and interest rate hike expectations, so let’s take a look at what the charts are telling us.
.
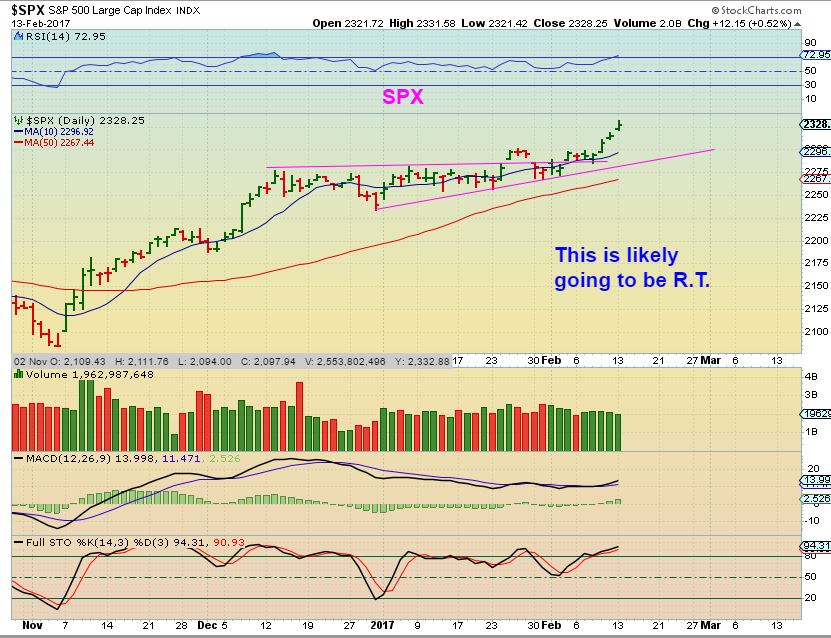
The SPX continued higher, and this makes this likely a right translated daily cycle. The bullishness of the general markets is holding on.
Read more
ALONG WITH THE WEEKEND REPORT, I WANTED TO ADD A REPORT SIMPLY DISCUSSING SOME RECENT TRADE SET UPS. A PULLBACK TODAY COULD OFFER OPPORTUNITIES IF THE DIP IS NOT SEVERE.
.
NAK was a buy all last week, and I pointed it out as a consolidation in an uptrend.
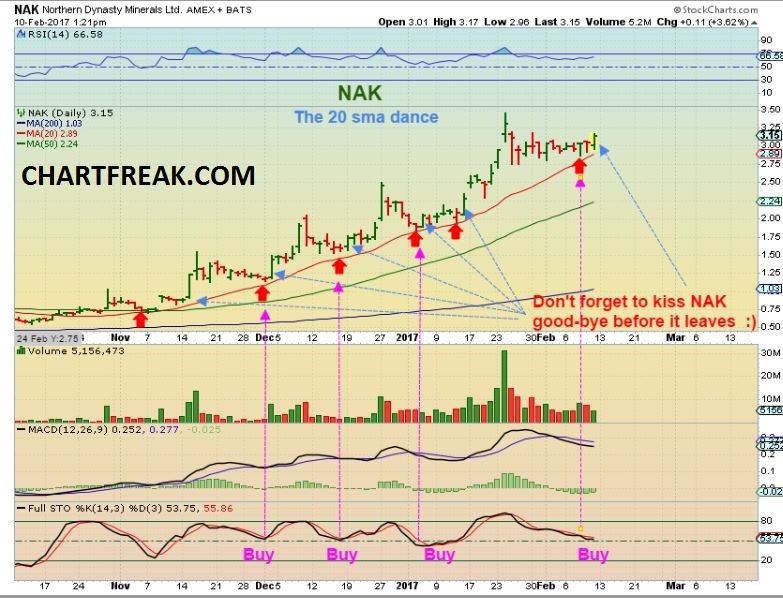
WRN – I also pointed out WRN as a nice weekly and daily set up earlier last week. It has popped to $1.62 since I posted this weekly chart, so what can we expect if you took this trade? The following charts can help…

Read more
Scroll to top