Weighing The Evidence

Bull? Bear? Bias?  We caught The Lows in Miners a few weeks ago, and the rally has surely gone beyond my expectations.  I now see many are calling THE END to the 4+ year bear market and calling the start to another phase of the Bull market in Gold.   So was the action of the past couple of weeks a guarantee of the Bear Market lows being in?  It's best to weigh the evidence and try to allow the facts to speak for themselves.  Lets continue to look at all of the markets and weigh the evidence. 

.

SPX BIG PICTURE - My readers know that I have been calling for the bear market drop in the markets since early last summer. We just landed in a very interesting place this week. Notice the dance around the 200 ma on a wkly basis since the 1980's.

SPX 2-12 wkly

Zooming in...

Read More

Whats A Melt Up?

What is a 'Melt Up'?  Most of us are familiar with a 'melt down' in the market,  so basically it is the opposite.  Either a stock or an entire sector can just sell off or get bought up into extreme levels, and then it still keeps going, not allowing the cautious investor an entry.  It may not be straight up everyday, it may run, pause, run again and again until the move exhausts itself.  This is what we will discuss in the weekend report, because it is possible that we could be seeing a 'Melt Up' in Gold and precious metals. They can last for weeks, with minor pauses.

.

This is an example of a small melt up. I used this chart to show the danger of trying to guess the top by buying DUST or Shorting Miners last week. You can ignore the writing,  just look at the melt up.

 DUST BURNED

. Read More

Safety First

Each trade that you take has some risk to it. Some trades are low risk  set ups with higher probability of success and others are just plain risky, depending on the set up.  We will discuss that a bit later in the report. 

.

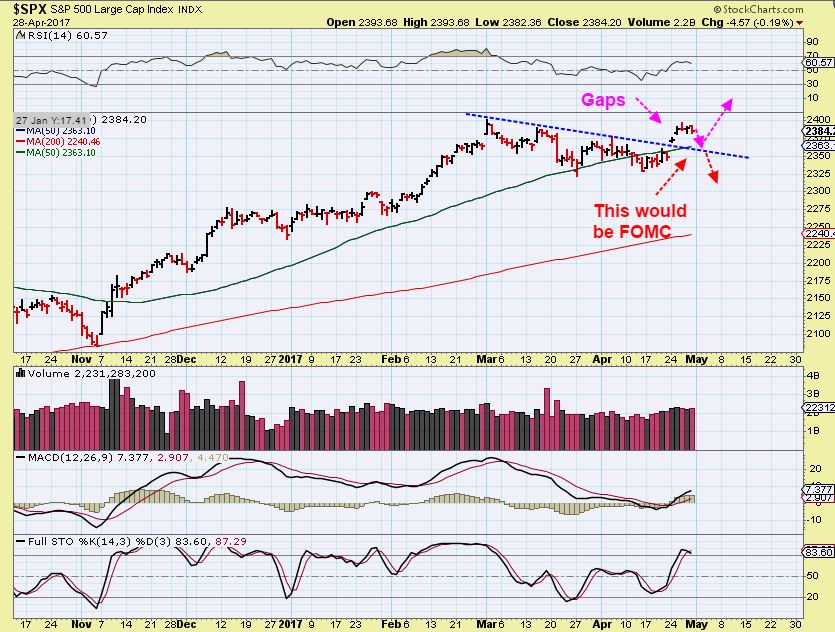
SPX- The Fed didn't change this chart very much.  I still see similarities between the double bottom in Aug & Sept, but it is weak. Notice the candle for Wednesday rallied on the Fed and gave it up.  The buy the dip crowd is weak. We are not oversold yet, but getting there.

SPX 2-10 . Read More

Moving Forward On A Fed Wednesday

Today is sort of a Fed Wednesday. It doesn't mean that there will be some big surprises, and in fact I do not expect anything like that, but I didn't want us to go into this blind folded. Certain areas of the market are due for reversals in my opinion, and a Fed testimony before congress can act as a catalyst, even if nothing new is said. Lets just Look at the charts.

.

Tuesday the NIKKEI was down 900 points, and it is currently down another 400 this morning, but...

NIKKEI

They couldn't get the sell off in the U.S. going.  THAT should have sold off the U.S. markets if they are going to drop In My Opinion.   I've been expecting a bounce, no change.

SPX 2-9

I have mentioned that when I look at the Banking index, it broke down and is struggling at lows...

Read More

I’m Starting To Sell, Not Chase

What a rocket ship ride Miners have been on.  Buying the lows has brought about some huge gains for some, and I had encouraged not selling too early with this type of set up.  Now it is time to start thinking about locking in gains, and not chasing these moves.  A pull back will come and that may lead to a buying opportunity.

.

GDX - And we have a shooting star/reversal candle in  GDX and many of the Miners. A pull back usually follows.

GDX 2-8 at 15  

NEM - I was looking at that large base and encouraging those holding a Miner like this that it may not be time to sell yet,  just because the 200sma usually acts as resistance. This could keep running.

NEM 2-1

NEM - But now one has to start seeing this straight up move as a time to at least start locking in partial profits, and using a trailing stop on the rest.

NEM 2-8 Read More

GOLD PART 2 – IN Search Of A Bottom

This is part 2 of the special weekend report discussing how we Search for a possible bottom in Gold. This half of the report will include many more charts with just the facts of what is happening in many areas.   Again, these facts keep both Bull and Bears unbiased.  They also indicate that GOLD may already be hammering in a bottom.  Miners especially have the hallmarks of a longer term low in place.

.

This chart adds to out last discussion in part 1 and my Big Picture view that I have been pointing out for months now. I pointed this out in this DEC 11 chart .  It shows that with the SPX bull market , and the bear market in Gold, we have repeatedly seen Gold ICL'S ( deep trade-able  lows) and also Golds Bear Market Rally Peaks  moving inverse to  The SPX .  I drew this to make that clear.

T= a TOP  &  ICL = A LOW

  SPX RATIO VS GOLD

 .

I also said that I would be looking for a break down in this area ( A change). Here is my updated chart

GOLD SPX 2-6

So...

Read More

GOLD PART 1 – In Search Of A Bottom

  I believe that Gold is in a 3 phase bull market, with 2 phases already behind us.  After a 4+ yr bear market, there are finally solid signs of a bottom , in many different areas.   There is no gain in clinging to a bias, that is how one loses money in the markets,  but by gathering important relevant facts  you can develop a check list and watch as necessary things begin falling into place ( or not).   JUST THE FACTS.   Currently I see things falling into place, indicating  that  THE bottom is either already in place, or very close. This bear market may be coming to an end,  and catching the recent lows has already been very profitable.  Riding a renewed Bull will be very rewarding.  We will look at " Just the facts"  here in our extended weekend report. To the charts...

.

First a review of recent bullish expectation in Miners: 

.

REVIEW- In the last 2 weekend reports we watched the HUI & GDX in the bigger time frame. This is a monthly chart of HUI, on the edge of an important break out. It has spent 6 MONTHS at the lows,  a solid base on prior support. Today the HUI is near $150.  A break out.

HUI MONTHLY 3

  GDX  reversed from below  $12.50 and also looked ready to break out above from a 7 month base. Above $15-$16 is important.  It is now at $17 as of Feb 5. 🙂

GDX MONTHLY

We need to look at a lot more than just the Miners and Precious Metals, however. Currencies come into play, along with a variety of other influences, so we'll examine the Metals now, historically , and other factors that can indicate where we are in the process of a 3 phase bull market...

  Read More

Something To Cheer About

Yes , It's a Supberbowl weekend in the U.S., but there is something more to cheer about. I am currently doing several studies with very bullish implications for the GOLD & SILVER market. My readers know several of the things that I've been tracking for months, and there are other areas that I look into also. Right now I see things that indicate ... Well, I'll leave that for the weekend report. Right now look at these 2 charts. 

.

The HUI has had bear mkt rally after bear market rally since 2012, but each 'cycle' could not surpass the last one from low to high.  THIS CHART is a first, and it is just 1  sign of change to cheer about.

HUI CHEER

HUI CLOSE UP

WHOA HUI

My weekend report will likely be released by late Sunday night or Monday morning, and it will be filled with facts that will build your confidence that finally we could be seeing the Bear Market Lows, expectations, price projections, etc.  : )

Lets look at some of our trade ideas for now....

Read More

Is That Toast You Have There?

2 Charts of the $USD - Can you believe that I drew this drop in the dollar a week ago? It was based on the first drop that took place in early December.  Lets look at the dollar as of yesterday.

USD 1-26

$USD Wednesday - This may be a piece of toast and what might that do for Gold?

USD 2-3

Let me give you a quick idea ...

Read More

Never A Straight Path

The twists and turns of the markets continue.  There is so much going on , that this is like a weekend report, with 22 charts.  Lets take a closer look.

.

SPY -  After hitting some overhead resistance , yesterdays sell off remains within acceptable parameters, however...

SPY 2-2

The BANKING INDEX still looks ugly.

BKX 2-2

This is GS for example. 

GS 2-2

Will markets keep rising with an ugly banking sector?  Lets dig deeper...

Read More