You are here: Home1 / Premium
We will discuss the Miners and the current pullback after a quick review of various Market Sectors.
.
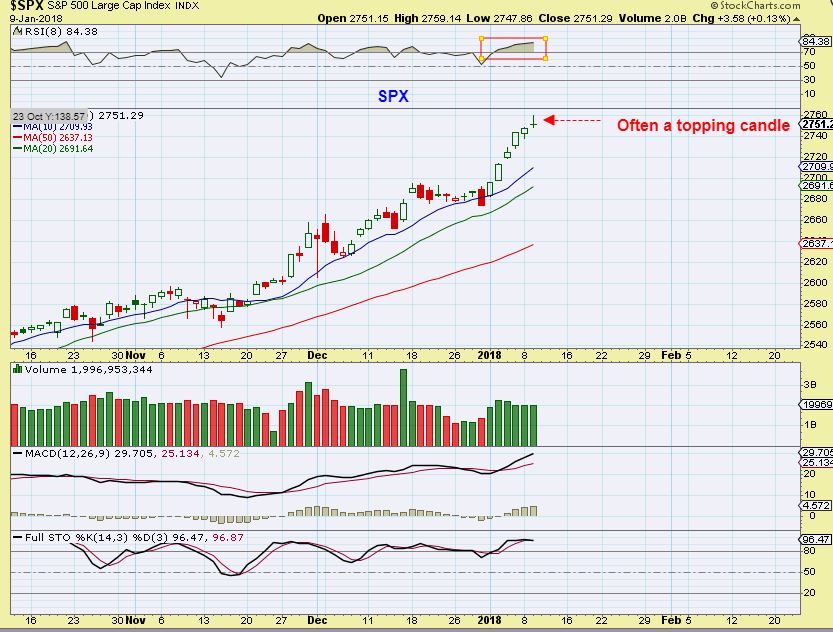
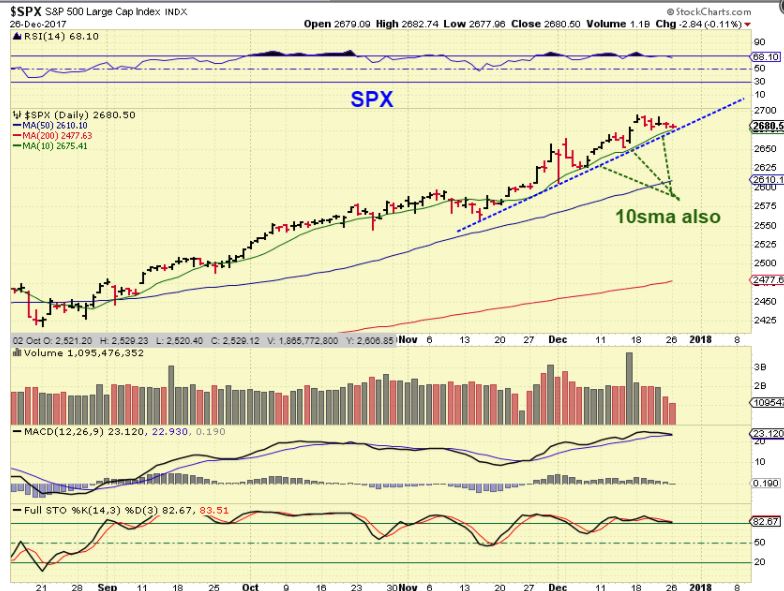
SPX - This is often a topping candle, a reversal , but lately the SPX just drops down to the 10sma and may fill some gaps if it does.
 Read More
No big changes took place since the weekend report, but we do have quite a few charts to look at, so let's dig right in...
SPX - The markets continued higher...
 Read More
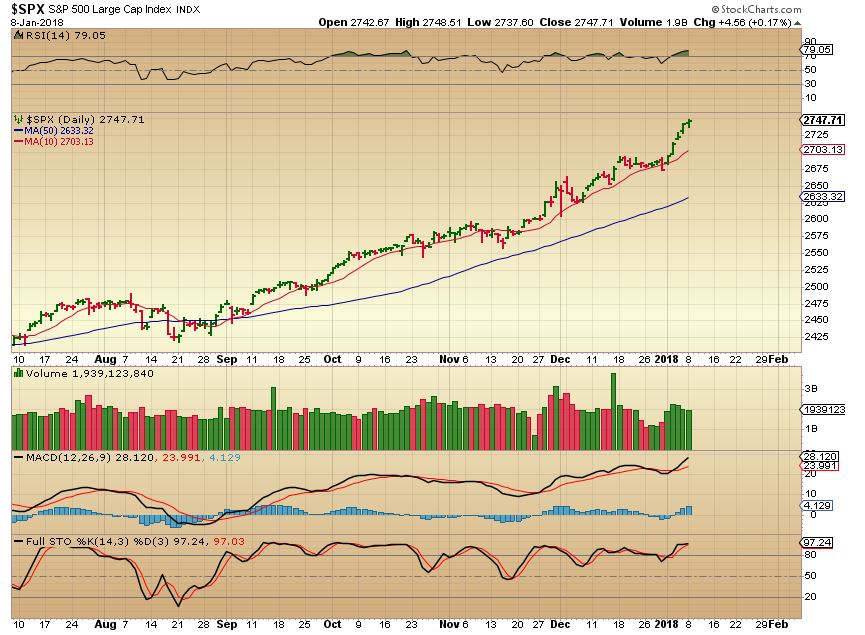
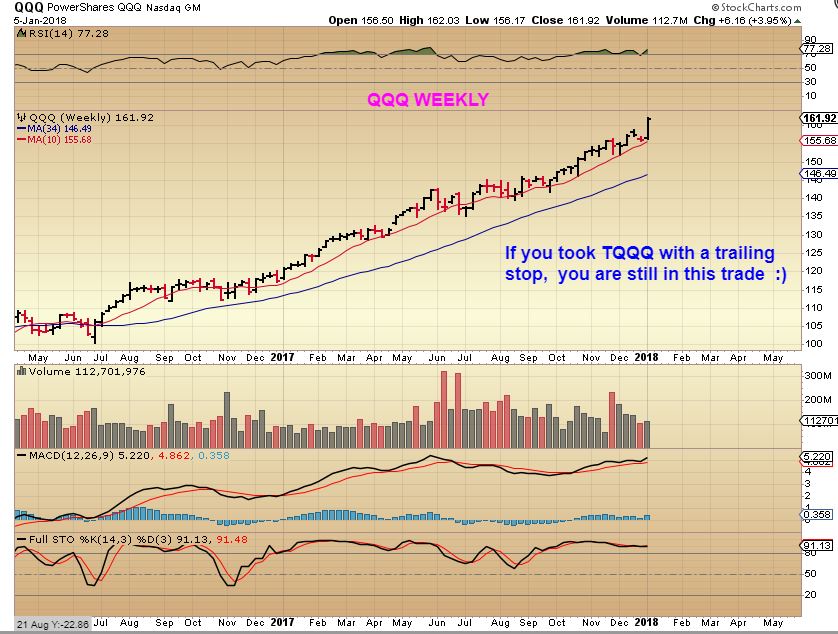
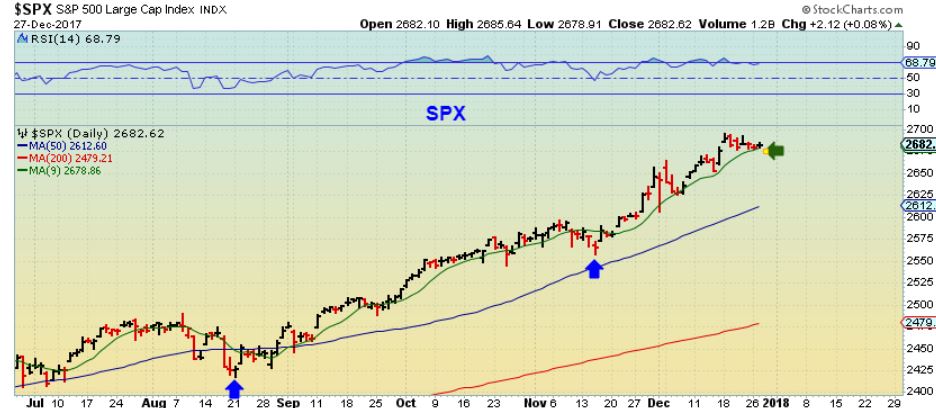
Looking at SPX, DJIA, and the NASDAQ at the end of the week, and we basically see the uptrend remains on track. Using a trailing stop has kept the 'longs' in the trade. Some are riding UPRO, UDOW, TQQQ.
I wanted to point out the VIX again, however...
Read More How timely was my article at the end of yesterdays morning report, discussing how sharply the Medical Marijuana stocks can sell off ? Holding those felt a lot like that ride in the opening Theme picture, but I am going to have a part 2 in todays report and discuss future buying opportunities in some of these companies again too.
Read More
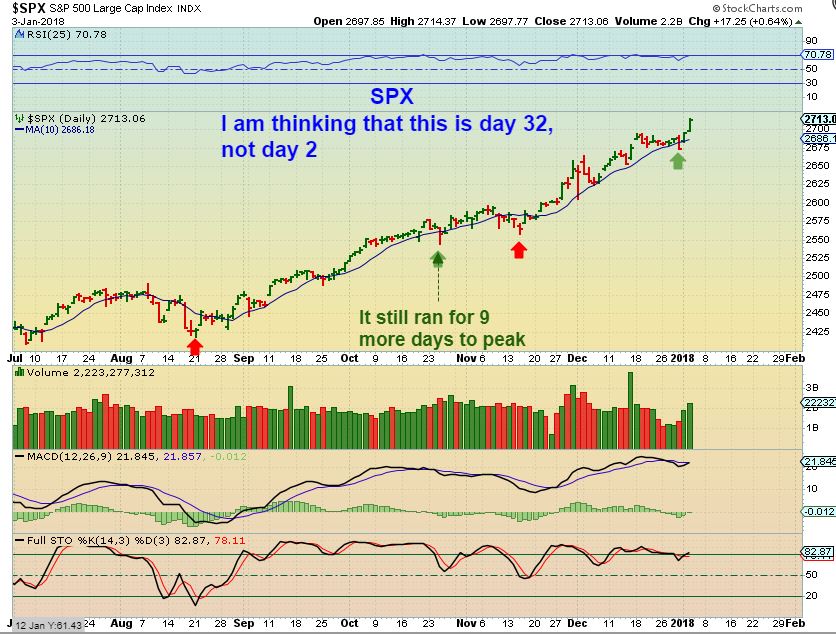
SPX #1 - There are a few reasons that I do not believe that we just saw a DCL 2 days ago. That means that I think we are on day 32, and we should still dip into a low soon. I pointed out the area of the green arrow yesterday as an example.
 Read More
 In that Theme picture, we see what is known by some as a floating market. Well, I think that many of us are seeing our own version of a floating market too. Let's discuss out stocks market action in a few sectors of interest, as well as some individual Miners and Stocks.
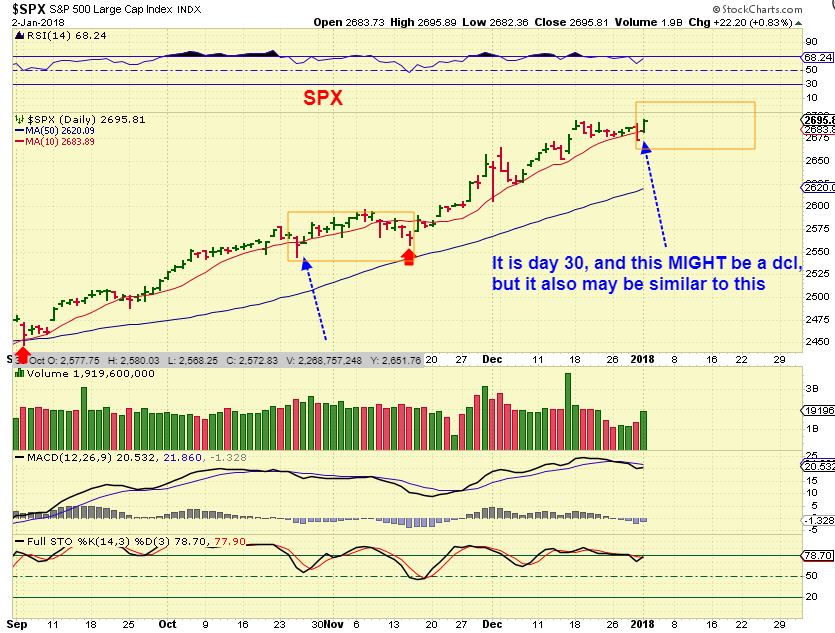
SPX - The first day of trading in 2018 was a move higher on day 31. That MIGHT have been a dcl, but I am thinking that it was a continuation move similar to what I am pointing out in October with the blue arrow. If you are long, it doesn't matter, your trailing stop is still keeping you invested.
 Read More
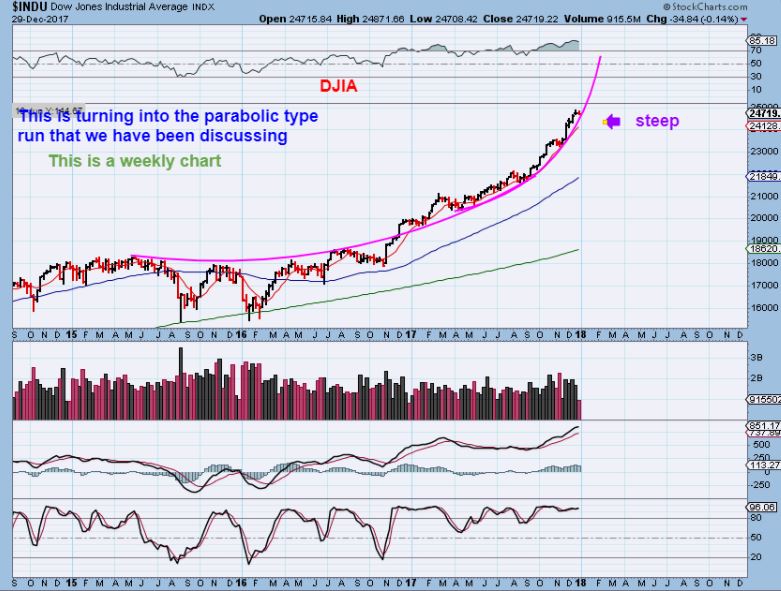
DJIA - We have discussed the parabolic nature of the general markets climb, and you can see that this continues. Riding UDOW or UPRO with a trailing stop would now have kept you in the trade for a long time. Dips are quite shallow on a weekly basis.
I would keep this in mind going into January 2018 however ...
Read More Well, this is the last trading day of the week, before another long holiday weekend. We will be entering 2018 next week (Can you believe that?)! It might be a good time to decide what you want to hold over the long weekend, or maybe what you currently are invested in is just fine. Let's take a look at our Final Trading day of 2017.
Read MoreThis is the regular report, with an extended section on Bitcoin / Cryptocurrency. That Bitcoin section will be released to the public later today too. For now, let''s review some of the areas of interest in Wednesdays markets.
SPX - No change in expectations from yesterday.
You want to keep this in mind though...
Read MoreFor a quiet holiday week of trading, we certainly saw some big explosions in a couple of sectors. Let's discuss our markets...
.
SPX - We saw the markets continue to pull back a bit as the trading week started, but nothing has been technically damaged.
 Read More
Scroll to top