You are here: Home1 / Premium
It’s the last day of the trading week, lets talk about…
Read more
.
Looking for a swing low…
Read more
Tuesday was definitely a story of Pops and Drops. I have SO MUCH to talk about, so let’s take a look…
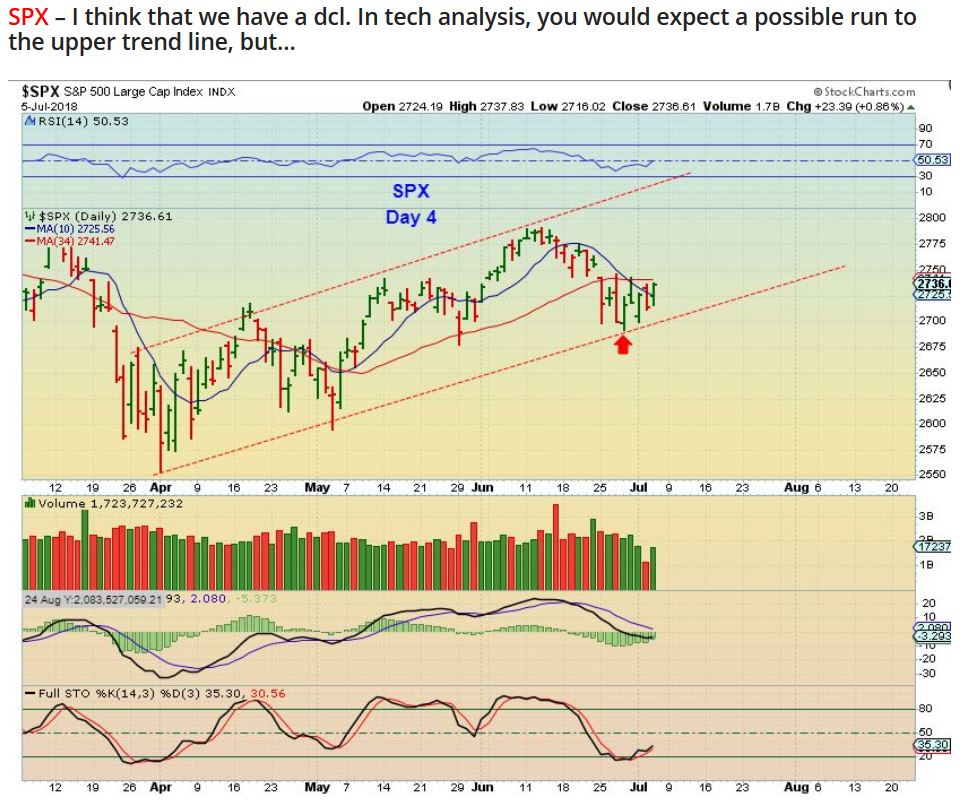
SPX – From yesterday, we are early in the daily cycle, so I had drawn this chart up, with a run to the top of the trend line likely, before a dip into a dcl starts…
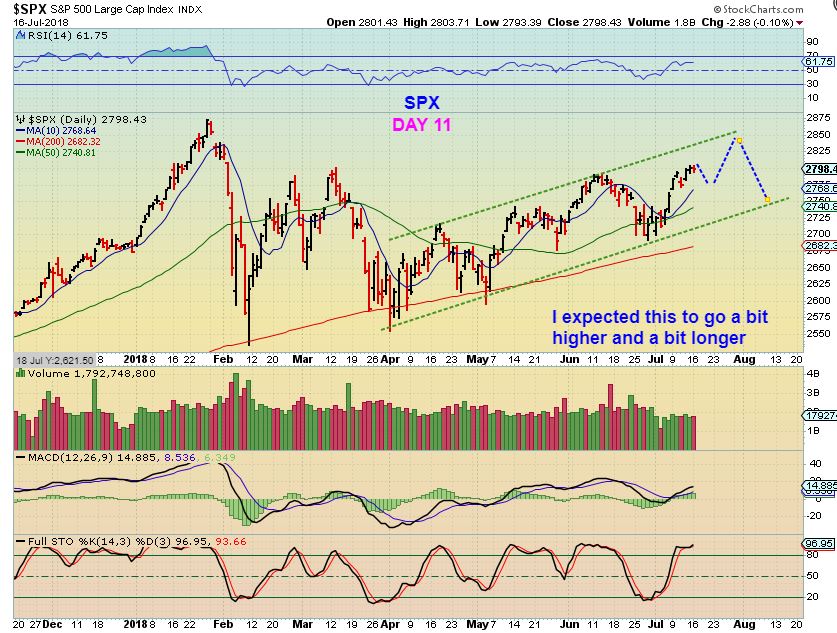
however, I also saw something else that looks important on Tuesday…
Read more
This is a chart that I put in my report last Tuesday. The Financials ( Banks) were set to start reporting earnings, and this actually looked pretty good. Take note of the POP last Monday to the 50sma.
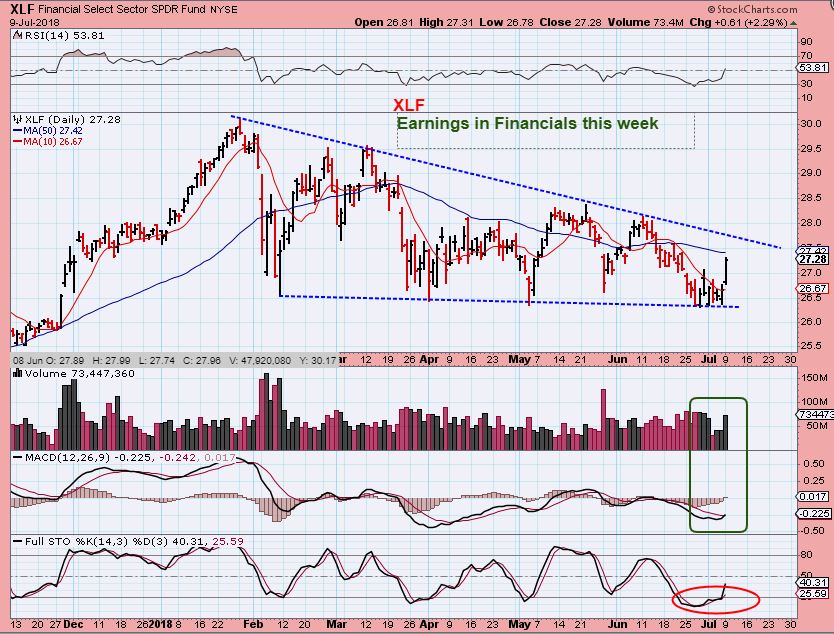
Lets take a look at the financials this week…
Read more
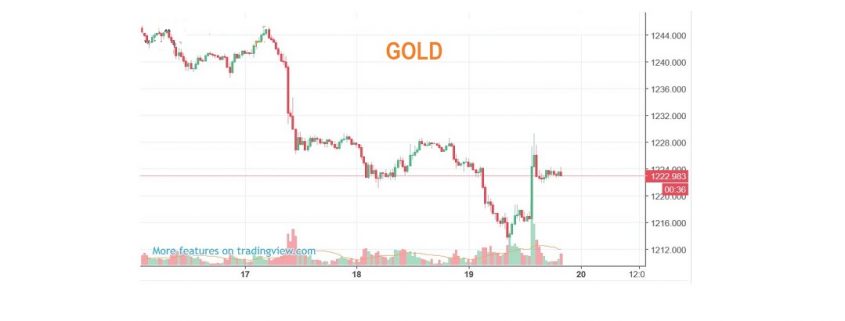
I’m sure that by now, you are ready too! Well, I have some good news on the ‘Waiting for an ICL in Gold’ part, but first let’s cover all of the markets, including something very interesting that I noticed about The EEM. To The Charts!!
.
Read more
Today is Friday the 13th, the last trading day of the week. No, I am not superstitious, and the things that we have been watching unfold seem to almost be complete. Let’s take a look…
Read more
This report is going to discuss a few things about our 2 faced friends – The Miners 🙂
Read more
Let’s review some of yesterdays market action…
Read more
What happened Mondayand what to expect Tuesday…
.
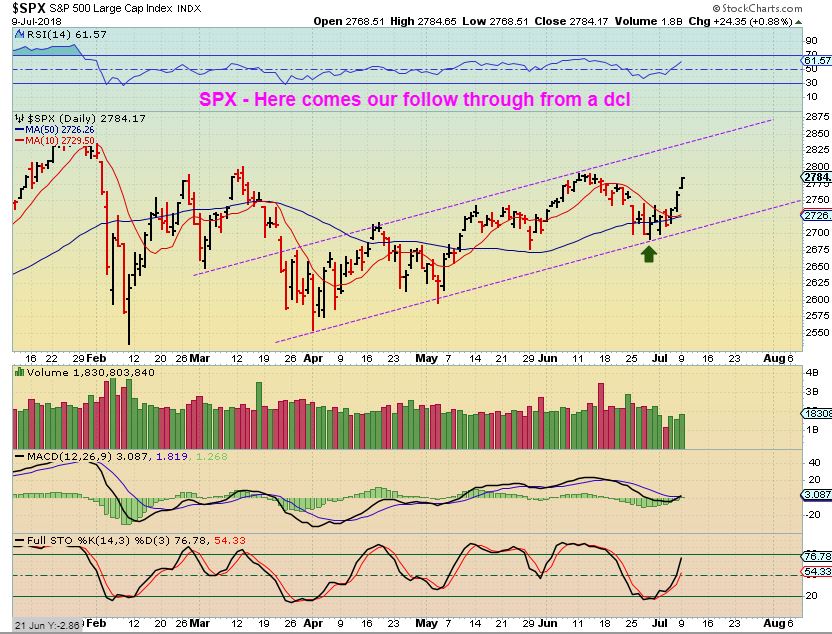
SPX – July 5th we seemed to have our dcl in place, day 4. I mentioned that it could be L.T., but a daily cycle could peak at day 15 and still be L.T., so ride it with a stop.
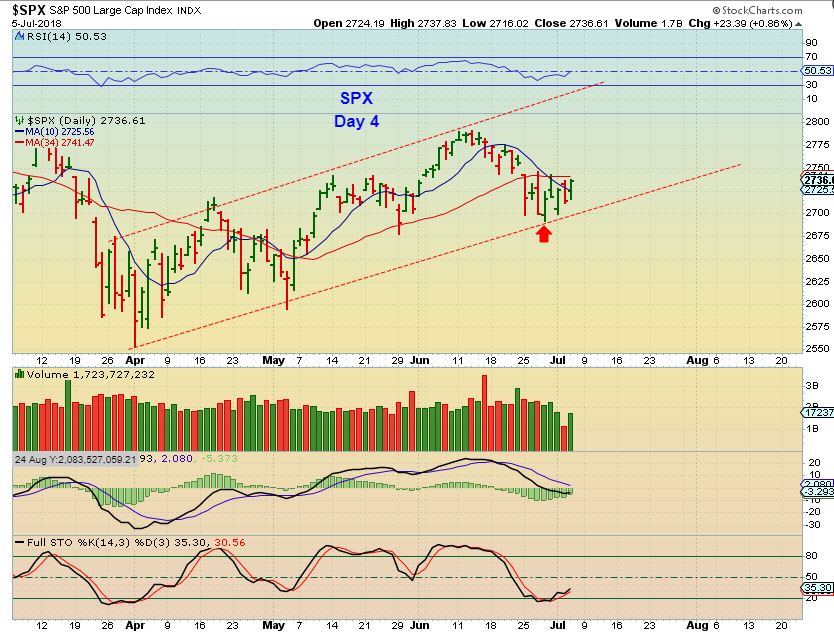
SPX – And it is heading for the upper trend line.
Read more
I know by now you know how I feel about the Precious Metals Sector, but maybe the Theme Pic will help to clear up any doubt at a glace. 🙂 We will discuss all of the Market Sectors, but the main focus is still on Precious Metals.
.
THIS IS A CHART OF THE SPX FROM FRIDAYS REPORT– The ‘but’ part was simply that I am expecting a L.T. daily cycle after a rally, so I keep that in the back of my mind…
SPX WEEKLY– And we have a weekly reversal that should have follow through higher too. The RSI held the 50% line too, so it is a bullish set up here at this point.

Read more
Scroll to top