You are here: Home1 / Premium
I was actually on the beach today and a storm started to roll in. We got a beautiful Post Fed Rainbow, but I'm still looking for that Pot Of Gold. Let's do a Post FOMC Market review...
.
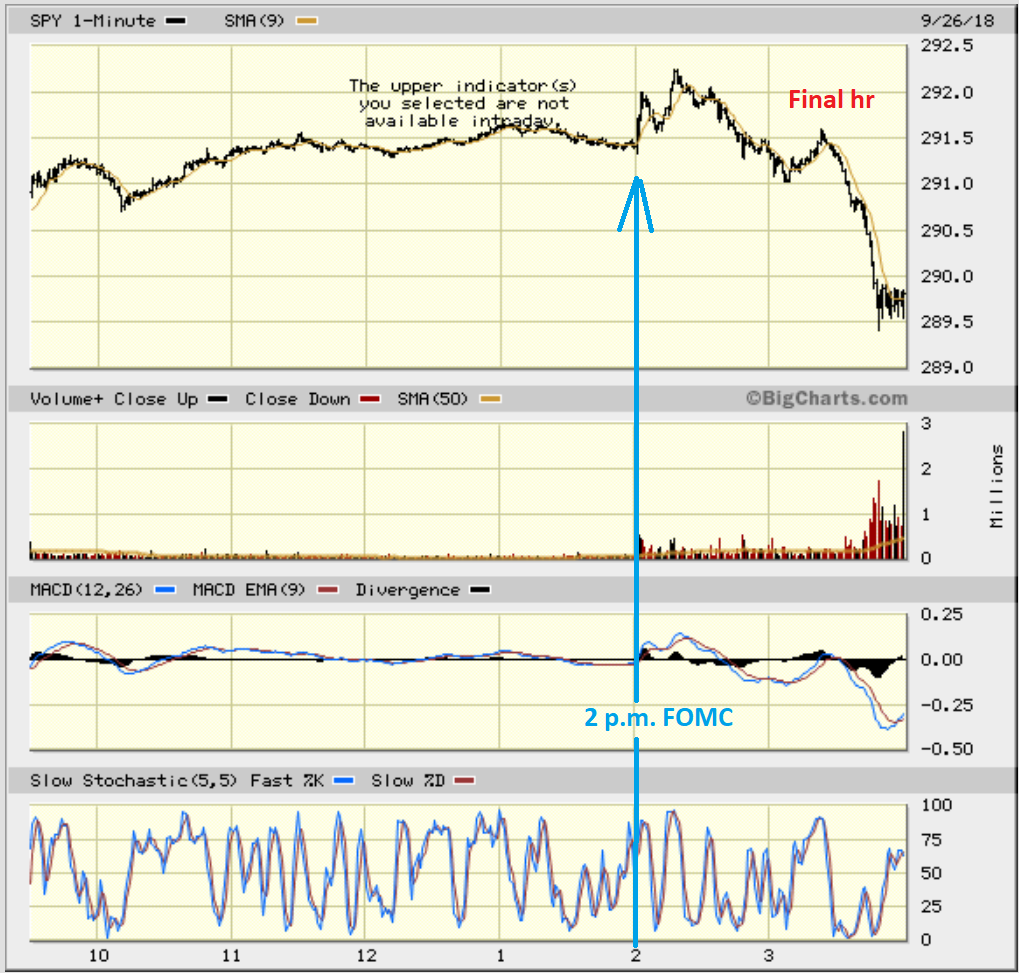
SPY INTRADAY FED REACTION - We have discussed that the Knee Jerk immediate reaction after the Fed is often a false move. Notice the reaction in the SPY at 2 p.m., as it ran higher, and then the directional change that followed.
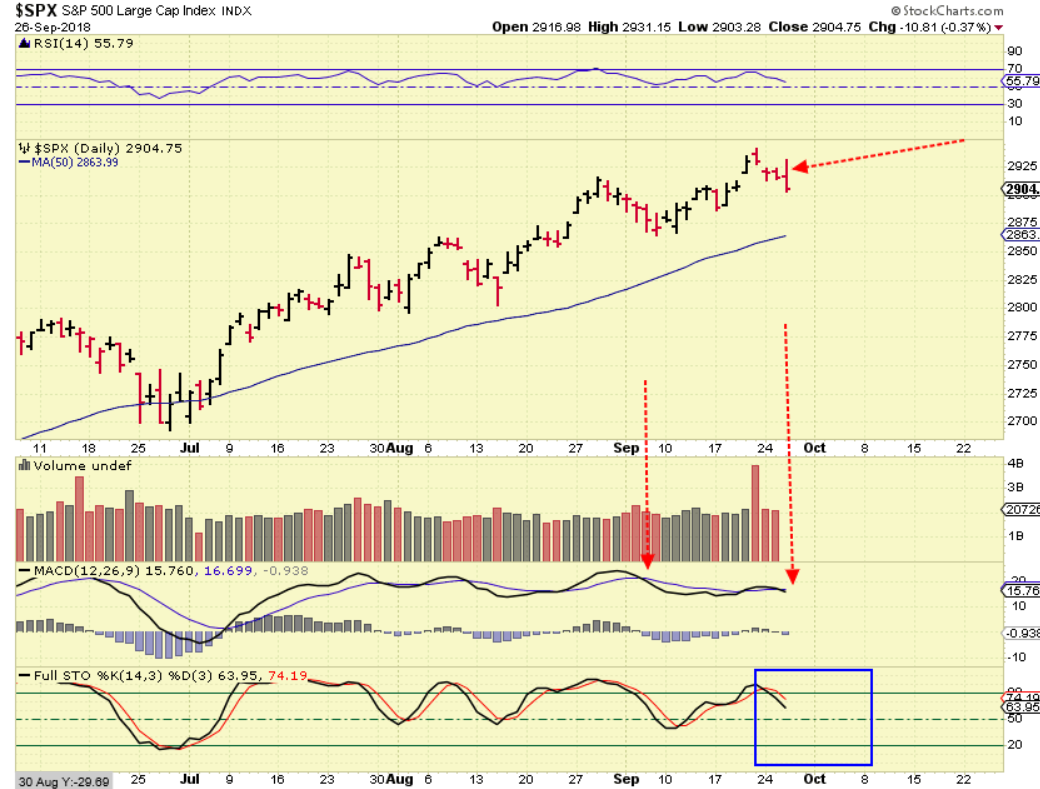
SPX DAILY - The MACD confirms that the recent high was weaker, and we are due for a DCL. Watch the 50sma for a break down or support.
 Read More
Well, we find ourselves on a Fed Wednesday today, and...
Read More We have only had 1 trading day since the weekend report and with the FOMC MTG on Wednesday, not much has changed, but one sector did seem to catch fire on Monday . We will talk about that...
Read More
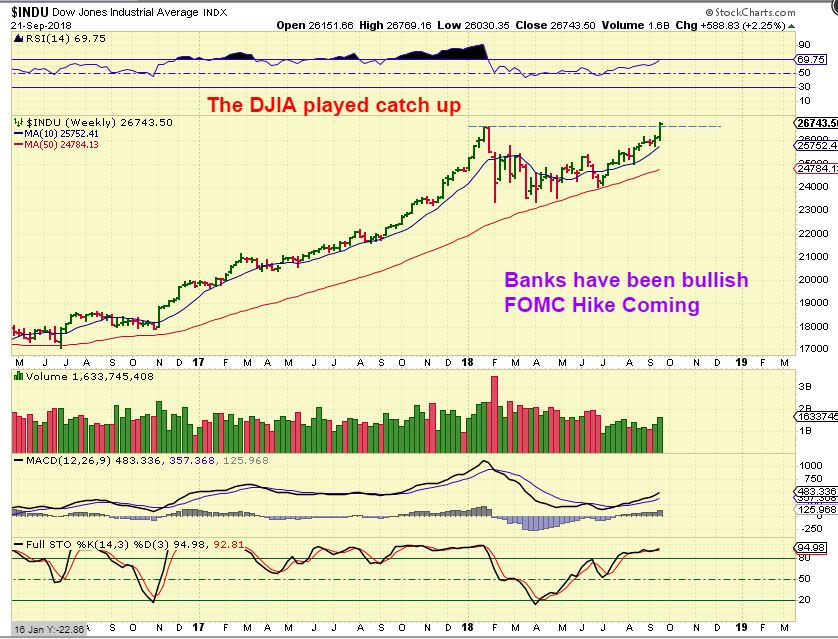
DJIA WEEKLY - The DJIA finally broke out to its all time highs.
 Read More
 After a quick review of the Markets, we'll discuss some new stock picks in various sectors and also our risky high fliers that have really been giving us a lift. As the Theme Title says, 'Enjoy the Ride , but Remember the Risks'.
.
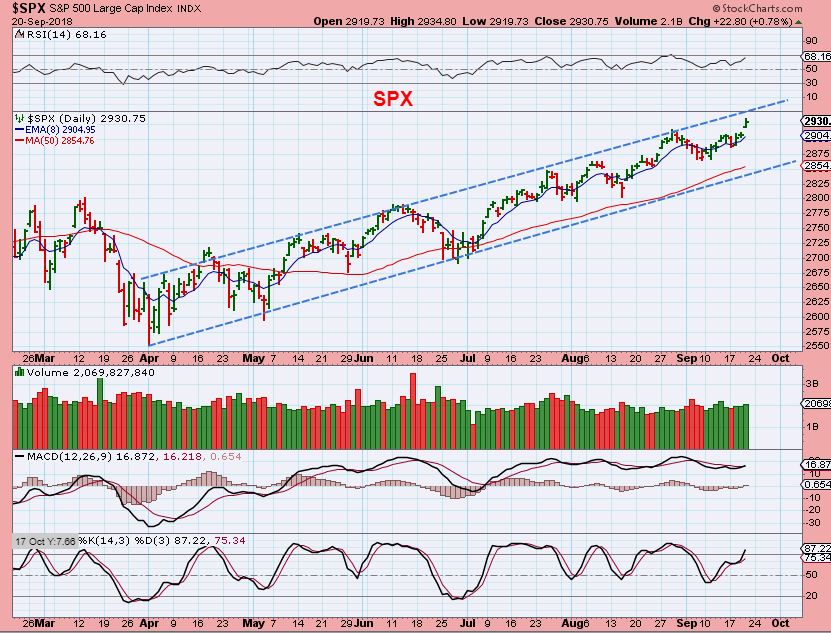
SPX #1 - Likely the upside target before a drop into that dcl. Train Kept on rolling...
 Read More
Yesterdays report actually had 46 charts in it, and the ones prior to it had many stock picks as well as the market review too. This is an important report, so I want to keep it a bit shorter than the past reports, to keep it simple. It has 23 charts ( Edit: Plus 2, I just added 2 more) 🙂
.
DJIA - We see follow through in the break higher by the DJIA. This is bullish, but..
 Read More
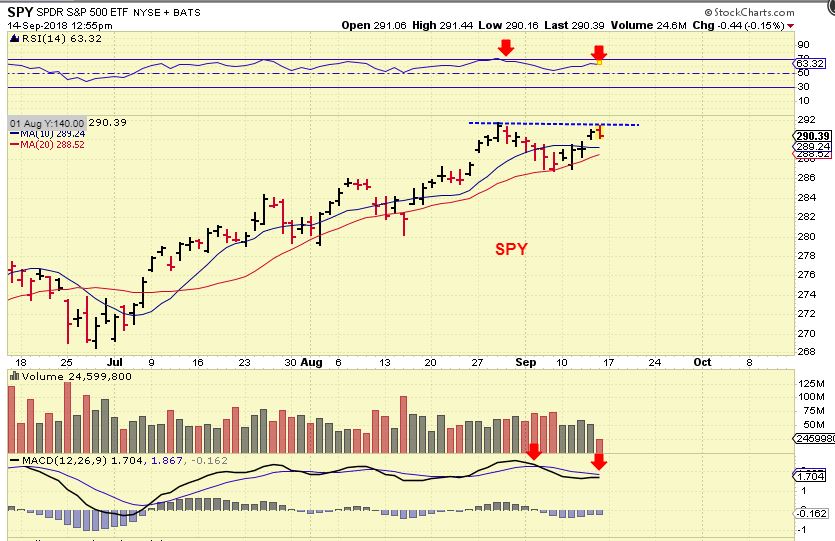
SPY FROM FRIDAY - We had a double top and divergence in the MACD ( And RSI), so it looks like it wants to pull back. It looks weak here on a daily, and I’ve been expecting a drop soon to a dcl or even an ICL
 Read More
 When the markets are choppy and seem a little indecisive, it can be hard to make money consistently. It becomes a stock pickers market, where some stocks are doing well, others may be struggling. Various sectors of the markets are currently a bit choppy, so we'll discuss that here on this Friday, the last trading day of the week...
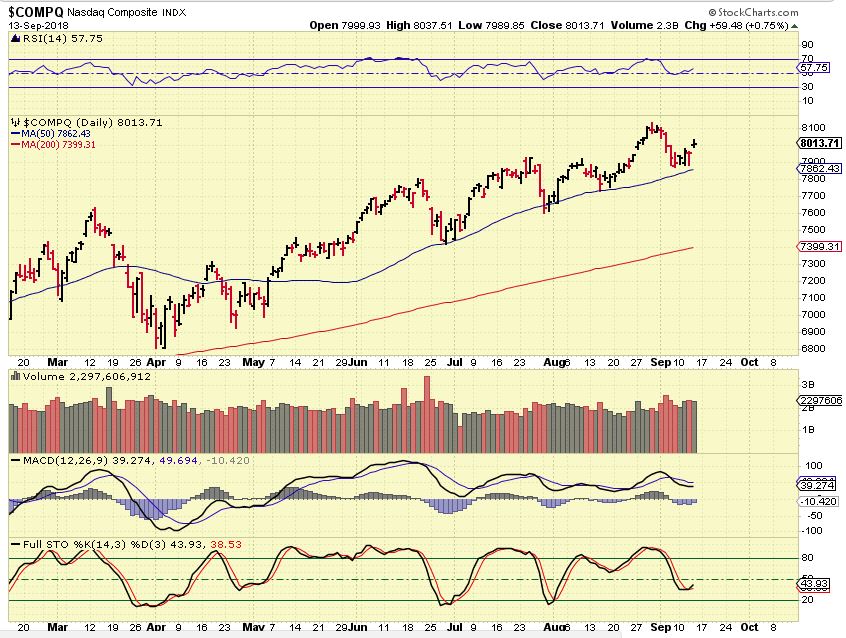
NASDAQ - After last weeks sell down, the NASDAQ landed above the 50sma and at this point that level has held as support, but it has been choppy here this week.
 Read More
Scroll to top

 Read More


